Download as PDF, PPTX
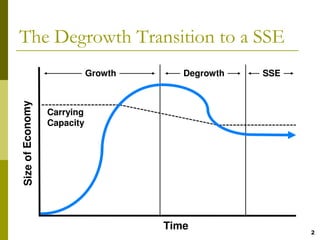
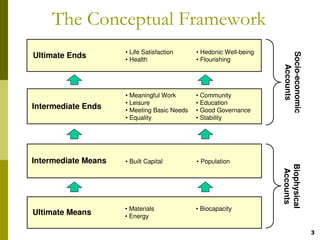
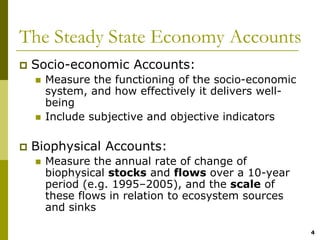
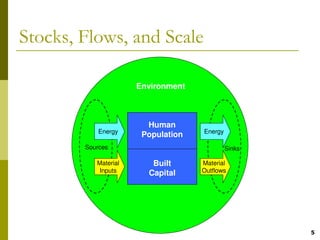
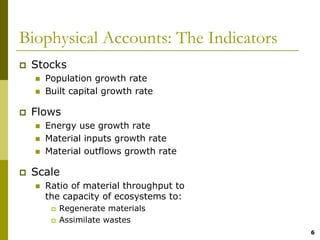
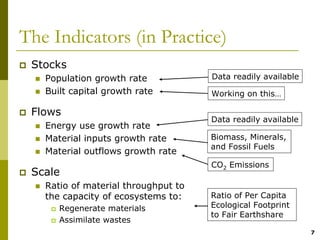
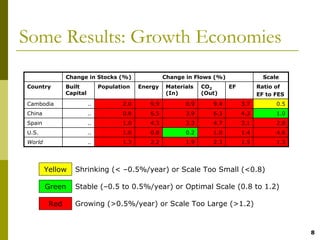
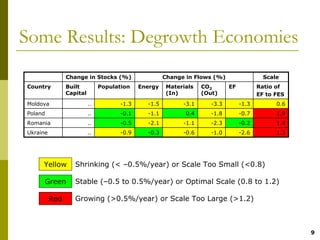
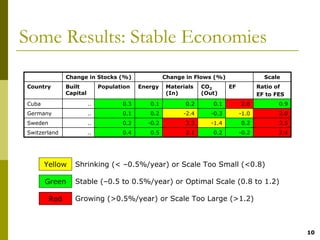
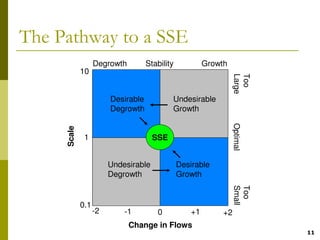
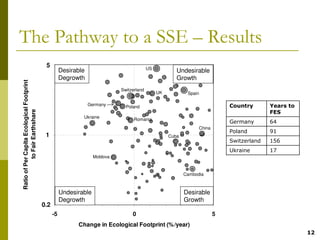
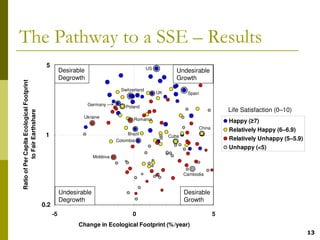
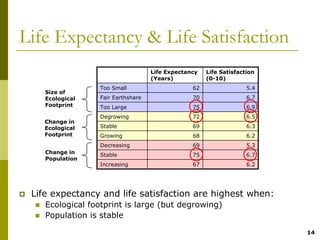
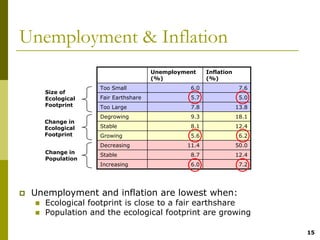

This document summarizes Daniel O'Neill's research on measuring progress towards a steady state economy (SSE). It presents a conceptual framework with socio-economic and biophysical indicators to measure stocks, flows, and scale of resource use. Preliminary results show that most economies are still growing, some are degrowing but not where most needed, and none have achieved a steady state. Life expectancy and satisfaction are highest in degrowing and stable economies. Unemployment and inflation remain challenges to address with policy changes to achieve an SSE. The research provides a way to measure progress towards macroeconomic goals aligned with sustainability.