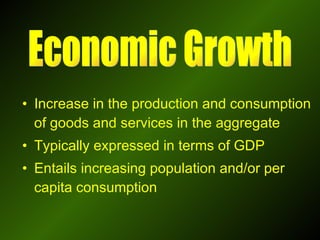
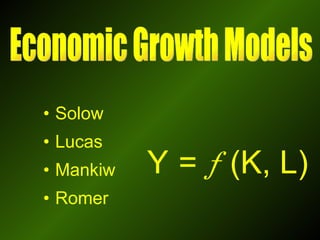
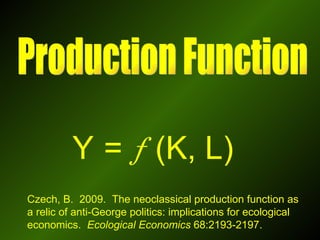
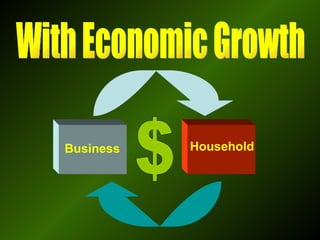
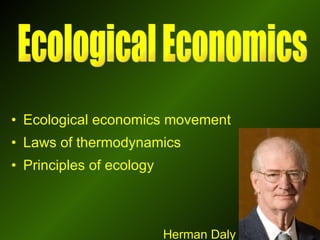
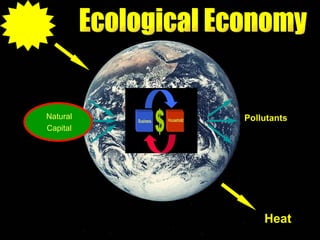
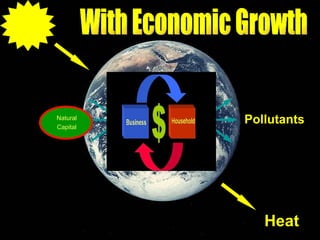
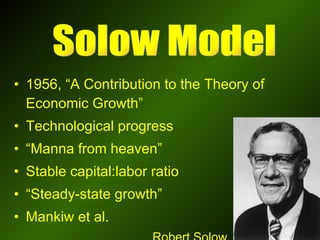
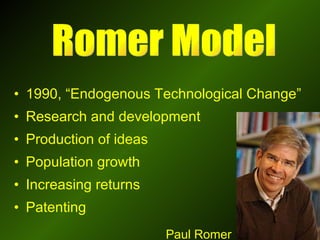
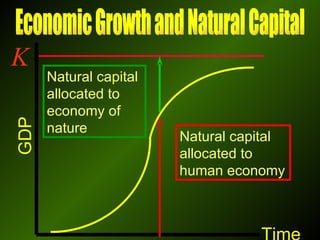
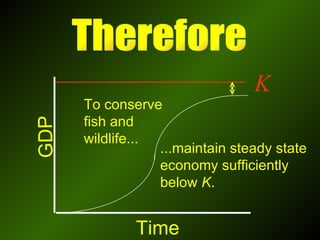
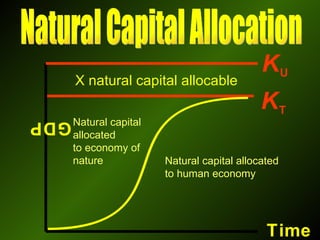
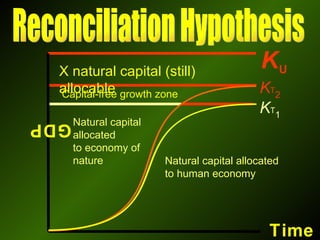
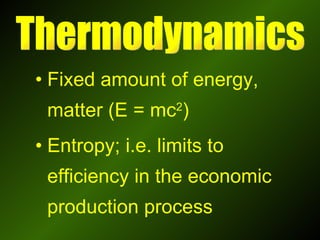
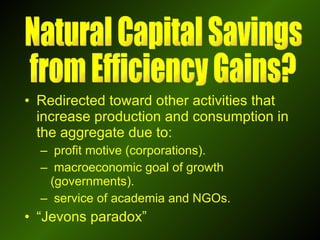
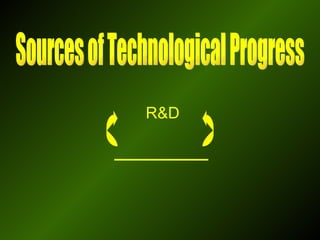
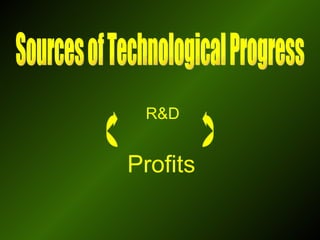
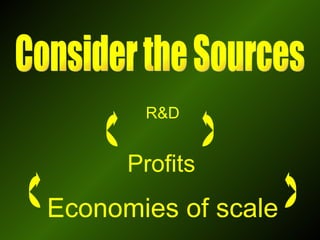
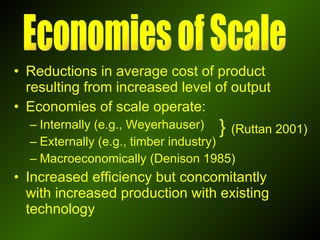
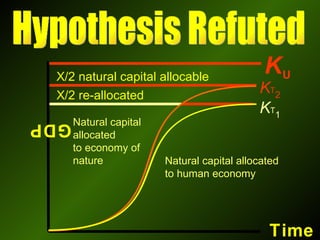
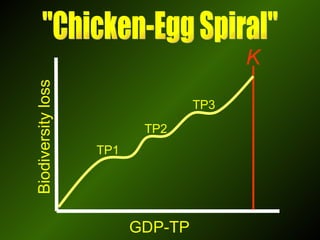
The Chicken/Egg Spiral "Reconciling" the Conflict Between Economic Growth and Environmental Protection with Technological Progress
www.steadystate.org
Increasing production or efficiency resulting from invention and innovation Types (Wils 2001) Explorative Extractive End-use Technological Progress
Increase in the production and consumption of goods and services in the aggregate Typically expressed in terms of GDP Entails increasing population and/or per capita consumption  Economic Growth
Solow Lucas Mankiw Romer Y  =     (K, L) Economic Growth Models
Y  =     (K, L) Production Function Czech, B.  2009.  The neoclassical production function as a relic of anti-George politics: implications for ecological economics.  Ecological Economics  68:2193-2197.
Business Household $ Neoclassical Economy
Business Household $ With Economic Growth
Ecological economics movement Laws of thermodynamics Principles of ecology Ecological Economics Herman Daly
Ecological Economy Heat Natural Capital Pollutants Natural Capital
With Economic Growth Heat Natural Capital Pollutants Natural Capital
1956, “A Contribution to the Theory of Economic Growth” Technological progress  “ Manna from heaven” Stable capital:labor ratio “ Steady-state growth” Mankiw et al. Solow Model Robert Solow
1990, “ Endogenous Technological Change ” Research and development Production of ideas Population growth  Increasing returns  Patenting Romer Model Paul Romer
Time GDP K Natural capital  allocated to  human economy  Natural capital allocated to economy of nature Economic Growth and Natural Capital
Fisheries Volume 30  Series Logo
K GDP Time ...maintain steady state  economy sufficiently  below   K . To conserve fish and wildlife... Therefore
But what about technological progress?
But what about technological progress? Czech, B.  2008. Prospects for reconciling economic growth and biodiversity conservation with technological progress.  Conservation Biology  22(6):1389-1398.
Increasing production or efficiency resulting from invention and innovation Types (Wils 2001) Explorative Extractive End-use Technological Progress
 
Increasing production or efficiency resulting from invention and innovation Types (Wils 2001) Explorative Extractive End-use Technological Progress
K T GDP Natural capital allocated to human economy Natural capital allocated  to economy of  nature  X natural capital allocable Time   K U Natural Capital Allocation
Capital-free growth zone   K T 1 K T 2     GDP Time K U Reconciliation Hypothesis Natural capital allocated to human economy Natural capital allocated  to economy of  nature  X natural capital (still) allocable
Fixed amount of energy, matter (E = mc 2 ) Entropy; i.e. limits to efficiency in the economic production process Thermodynamics
Consider the Sources of Technological Progress
R&D Sources of Technological Progress
Entirely institutionalized (NSF 2007) Corporations Government Colleges and Universities Non-profits Requires surplus production in existing economic sectors Relevant Aspects of R&D
Representative Nations (Duga and Stadt 2005) 22% 7% 71% USA 24.1% 8.9% 67.0% UK 19.5% 2.8% 77.6% Sweden 5.6% 24.5% 69.9% Russia 33.8% 44.9% 21.4% Poland 30.6% 39.1% 30.3% Mexico 16.1% 9.5% 74.4% Japan 17.1% 13.8% 69.1% Germany 10.1% 28.7% 61.2% China 29.5% 22.9% 47.5% Australia Acad./Other  Government  Corporations Nation
Representative Nations 30% global R&D (Duga and Stadt 2005) 22% 7% 71% USA 24.1% 8.9% 67.0% UK 19.5% 2.8% 77.6% Sweden 5.6% 24.5% 69.9% Russia 33.8% 44.9% 21.4% Poland 30.6% 39.1% 30.3% Mexico 16.1% 9.5% 74.4% Japan 17.1% 13.8% 69.1% Germany 10.1% 28.7% 61.2% China 29.5% 22.9% 47.5% Australia Acad./Other  Government  Corporations Nation
Corporations – profits.  But first: Factors of production paid for. Shareholder dividends distributed. Governments – income taxes and social security payments.  But first, solvency. Surplus Production Required for R&D
More profits at the corporate level. Increasing income at the national level; i.e., economic growth. What would more  R&D require?
Chartered for primary purpose of generating profits (Bakan 2005). Corporations
U.S. – defense, economic “objectives” China – defense, economic growth  Russia – defense, economic “objectives” Japan – economic “objectives” Duga and Stadt (2005), AAAS (2002) Focus of R&D in Bellwether Nations
U.S. R&D, 2006, Billions $ National Research Council (2007) 174  69 55 299 299 Total 3 (1%) Other gov. 3 (2%) 4 (6%) 8 (15%) 15 (5%) 10 (3%) Non-profits 10 (6%) 7 (10%) 4 (7%) 21 (7%) 84 (28%) Fed. gov.  3 (2%) 11 (16%) 35 (64%) 50 (17%) 8 (3%) College/univ. 158 (91%) 47 (68%) 8 (15%) 213 (71%) 194 (65%) Industry Devel. Applied Basic Conducted Funded Entity
But assume the R&D complex  generates technical efficiency gains.
“ annual growth rate in the global footprint of 2.12% per year…requisite technological improvement needs to exceed 2% per year” (Dietz et al., 2007,  Frontiers  5:13-18) Productivity gains >2% typified “advanced capitalist economies” during third quarter of 20 th  century (Madison 1987). Gains below 2% have befuddled economists since. Most economic growth elsewhere from factor inputs rather than productivity gains (Oguchi 2005). What rate of gain is required?
Redirected toward other activities that increase production and consumption in the aggregate due to: profit motive (corporations). macroeconomic goal of growth (governments). service of academia and NGOs. “ Jevons paradox” Natural Capital Savings  from Efficiency Gains?
R&D _______ Sources of Technological Progress
R&D Profits Sources of Technological Progress
Profits
R&D Competitive Advantage
R&D Profits Catch-22? Sources of Technological Progress
R&D ________________ Consider the Sources Profits
R&D Profits Economies of scale Consider the Sources
Reductions in average cost of product resulting from increased level of output Economies of scale operate: Internally (e.g., Weyerhauser)  Externally (e.g., timber industry) Macroeconomically (Denison 1985) Increased efficiency but concomitantly with increased production with existing technology Economies of Scale }  (Ruttan 2001)
Economies of Scale
X/2 re-allocated K T 1 K T 2     GDP Time K U Natural capital allocated to human economy Natural capital allocated  to economy of  nature  X/2 natural capital allocable Hypothesis Refuted
Biodiversity loss GDP-TP TP1 TP3 K TP2 "Chicken-Egg Spiral"
With R&D focused on end-use efficiency, the  rate  of biodiversity  loss  due to economic growth may decrease via technological progress and because there is less biodiversity left to lose, but there are diminishing “less-loss” returns to R&D scale as the low-hanging thermodynamic fruits are picked and we approach ultimate ecological carrying capacity for the economy.  Hypothesis
Technological progress is not manna from heaven. Technological progress and economic growth are tightly linked. Both are limited by natural capital stocks. The solution to environmental problems is not perpetually growing R&D budgets. The solution to environmental problems sustainable scale.  Technological progress in a steady state economy would occur at a much slower pace. Conclusions
www.steadystate.org

The Chicken/Egg Spiral

  • 1.
    The Chicken/Egg Spiral"Reconciling" the Conflict Between Economic Growth and Environmental Protection with Technological Progress
  • 2.
  • 3.
    Increasing production orefficiency resulting from invention and innovation Types (Wils 2001) Explorative Extractive End-use Technological Progress
  • 4.
    Increase in theproduction and consumption of goods and services in the aggregate Typically expressed in terms of GDP Entails increasing population and/or per capita consumption Economic Growth
  • 5.
    Solow Lucas MankiwRomer Y =  (K, L) Economic Growth Models
  • 6.
    Y =  (K, L) Production Function Czech, B. 2009. The neoclassical production function as a relic of anti-George politics: implications for ecological economics. Ecological Economics 68:2193-2197.
  • 7.
    Business Household $Neoclassical Economy
  • 8.
    Business Household $With Economic Growth
  • 9.
    Ecological economics movementLaws of thermodynamics Principles of ecology Ecological Economics Herman Daly
  • 10.
    Ecological Economy HeatNatural Capital Pollutants Natural Capital
  • 11.
    With Economic GrowthHeat Natural Capital Pollutants Natural Capital
  • 12.
    1956, “A Contributionto the Theory of Economic Growth” Technological progress “ Manna from heaven” Stable capital:labor ratio “ Steady-state growth” Mankiw et al. Solow Model Robert Solow
  • 13.
    1990, “ EndogenousTechnological Change ” Research and development Production of ideas Population growth Increasing returns Patenting Romer Model Paul Romer
  • 14.
    Time GDP KNatural capital allocated to human economy Natural capital allocated to economy of nature Economic Growth and Natural Capital
  • 15.
    Fisheries Volume 30 Series Logo
  • 16.
    K GDP Time...maintain steady state economy sufficiently below K . To conserve fish and wildlife... Therefore
  • 17.
    But what abouttechnological progress?
  • 18.
    But what abouttechnological progress? Czech, B. 2008. Prospects for reconciling economic growth and biodiversity conservation with technological progress. Conservation Biology 22(6):1389-1398.
  • 19.
    Increasing production orefficiency resulting from invention and innovation Types (Wils 2001) Explorative Extractive End-use Technological Progress
  • 20.
  • 21.
    Increasing production orefficiency resulting from invention and innovation Types (Wils 2001) Explorative Extractive End-use Technological Progress
  • 22.
    K T GDPNatural capital allocated to human economy Natural capital allocated to economy of nature X natural capital allocable Time   K U Natural Capital Allocation
  • 23.
    Capital-free growth zone  K T 1 K T 2     GDP Time K U Reconciliation Hypothesis Natural capital allocated to human economy Natural capital allocated to economy of nature X natural capital (still) allocable
  • 24.
    Fixed amount ofenergy, matter (E = mc 2 ) Entropy; i.e. limits to efficiency in the economic production process Thermodynamics
  • 25.
    Consider the Sourcesof Technological Progress
  • 26.
    R&D Sources ofTechnological Progress
  • 27.
    Entirely institutionalized (NSF2007) Corporations Government Colleges and Universities Non-profits Requires surplus production in existing economic sectors Relevant Aspects of R&D
  • 28.
    Representative Nations (Dugaand Stadt 2005) 22% 7% 71% USA 24.1% 8.9% 67.0% UK 19.5% 2.8% 77.6% Sweden 5.6% 24.5% 69.9% Russia 33.8% 44.9% 21.4% Poland 30.6% 39.1% 30.3% Mexico 16.1% 9.5% 74.4% Japan 17.1% 13.8% 69.1% Germany 10.1% 28.7% 61.2% China 29.5% 22.9% 47.5% Australia Acad./Other Government Corporations Nation
  • 29.
    Representative Nations 30%global R&D (Duga and Stadt 2005) 22% 7% 71% USA 24.1% 8.9% 67.0% UK 19.5% 2.8% 77.6% Sweden 5.6% 24.5% 69.9% Russia 33.8% 44.9% 21.4% Poland 30.6% 39.1% 30.3% Mexico 16.1% 9.5% 74.4% Japan 17.1% 13.8% 69.1% Germany 10.1% 28.7% 61.2% China 29.5% 22.9% 47.5% Australia Acad./Other Government Corporations Nation
  • 30.
    Corporations – profits. But first: Factors of production paid for. Shareholder dividends distributed. Governments – income taxes and social security payments. But first, solvency. Surplus Production Required for R&D
  • 31.
    More profits atthe corporate level. Increasing income at the national level; i.e., economic growth. What would more R&D require?
  • 32.
    Chartered for primarypurpose of generating profits (Bakan 2005). Corporations
  • 33.
    U.S. – defense,economic “objectives” China – defense, economic growth Russia – defense, economic “objectives” Japan – economic “objectives” Duga and Stadt (2005), AAAS (2002) Focus of R&D in Bellwether Nations
  • 34.
    U.S. R&D, 2006,Billions $ National Research Council (2007) 174 69 55 299 299 Total 3 (1%) Other gov. 3 (2%) 4 (6%) 8 (15%) 15 (5%) 10 (3%) Non-profits 10 (6%) 7 (10%) 4 (7%) 21 (7%) 84 (28%) Fed. gov. 3 (2%) 11 (16%) 35 (64%) 50 (17%) 8 (3%) College/univ. 158 (91%) 47 (68%) 8 (15%) 213 (71%) 194 (65%) Industry Devel. Applied Basic Conducted Funded Entity
  • 35.
    U.S. R&D, 2006,Billions $ National Research Council (2007) 174 69 55 299 299 Total 3 (1%) Other gov. 3 (2%) 4 (6%) 8 (15%) 15 (5%) 10 (3%) Non-profits 10 (6%) 7 (10%) 4 (7%) 21 (7%) 84 (28%) Fed. gov. 3 (2%) 11 (16%) 35 (64%) 50 (17%) 8 (3%) College/univ. 158 (91%) 47 (68%) 8 (15%) 213 (71%) 194 (65%) Industry Devel. Applied Basic Conducted Funded Entity
  • 36.
    U.S. R&D, 2006,Billions $ National Research Council (2007) 174 69 55 299 299 Total 3 (1%) Other gov. 3 (2%) 4 (6%) 8 (15%) 15 (5%) 10 (3%) Non-profits 10 (6%) 7 (10%) 4 (7%) 21 (7%) 84 (28%) Fed. gov. 3 (2%) 11 (16%) 35 (64%) 50 (17%) 8 (3%) College/univ. 158 (91%) 47 (68%) 8 (15%) 213 (71%) 194 (65%) Industry Devel. Applied Basic Conducted Funded Entity
  • 37.
    U.S. R&D, 2006,Billions $ National Research Council (2007) 174 69 55 299 299 Total 3 (1%) Other gov. 3 (2%) 4 (6%) 8 (15%) 15 (5%) 10 (3%) Non-profits 10 (6%) 7 (10%) 4 (7%) 21 (7%) 84 (28%) Fed. gov. 3 (2%) 11 (16%) 35 (64%) 50 (17%) 8 (3%) College/univ. 158 (91%) 47 (68%) 8 (15%) 213 (71%) 194 (65%) Industry Devel. Applied Basic Conducted Funded Entity
  • 38.
    U.S. R&D, 2006,Billions $ National Research Council (2007) 174 69 55 299 299 Total 3 (1%) Other gov. 3 (2%) 4 (6%) 8 (15%) 15 (5%) 10 (3%) Non-profits 10 (6%) 7 (10%) 4 (7%) 21 (7%) 84 (28%) Fed. gov. 3 (2%) 11 (16%) 35 (64%) 50 (17%) 8 (3%) College/univ. 158 (91%) 47 (68%) 8 (15%) 213 (71%) 194 (65%) Industry Devel. Applied Basic Conducted Funded Entity
  • 39.
    But assume theR&D complex generates technical efficiency gains.
  • 40.
    “ annual growthrate in the global footprint of 2.12% per year…requisite technological improvement needs to exceed 2% per year” (Dietz et al., 2007, Frontiers 5:13-18) Productivity gains >2% typified “advanced capitalist economies” during third quarter of 20 th century (Madison 1987). Gains below 2% have befuddled economists since. Most economic growth elsewhere from factor inputs rather than productivity gains (Oguchi 2005). What rate of gain is required?
  • 41.
    Redirected toward otheractivities that increase production and consumption in the aggregate due to: profit motive (corporations). macroeconomic goal of growth (governments). service of academia and NGOs. “ Jevons paradox” Natural Capital Savings from Efficiency Gains?
  • 42.
    R&D _______ Sourcesof Technological Progress
  • 43.
    R&D Profits Sourcesof Technological Progress
  • 44.
  • 45.
  • 46.
    R&D Profits Catch-22?Sources of Technological Progress
  • 47.
    R&D ________________ Considerthe Sources Profits
  • 48.
    R&D Profits Economiesof scale Consider the Sources
  • 49.
    Reductions in averagecost of product resulting from increased level of output Economies of scale operate: Internally (e.g., Weyerhauser) Externally (e.g., timber industry) Macroeconomically (Denison 1985) Increased efficiency but concomitantly with increased production with existing technology Economies of Scale } (Ruttan 2001)
  • 50.
  • 51.
    X/2 re-allocated KT 1 K T 2     GDP Time K U Natural capital allocated to human economy Natural capital allocated to economy of nature X/2 natural capital allocable Hypothesis Refuted
  • 52.
    Biodiversity loss GDP-TPTP1 TP3 K TP2 "Chicken-Egg Spiral"
  • 53.
    With R&D focusedon end-use efficiency, the rate of biodiversity loss due to economic growth may decrease via technological progress and because there is less biodiversity left to lose, but there are diminishing “less-loss” returns to R&D scale as the low-hanging thermodynamic fruits are picked and we approach ultimate ecological carrying capacity for the economy. Hypothesis
  • 54.
    Technological progress isnot manna from heaven. Technological progress and economic growth are tightly linked. Both are limited by natural capital stocks. The solution to environmental problems is not perpetually growing R&D budgets. The solution to environmental problems sustainable scale. Technological progress in a steady state economy would occur at a much slower pace. Conclusions
  • 55.

Editor's Notes

  • #4 Technological progress, in the vernacular, implies inventions and innovation. In economic terms, technological progress refers to increasing output per unit input, or increasing “productive efficiency,” resulting from inventions and innovation.
  • #20 Technological progress, in the vernacular, implies inventions and innovation. In economic terms, technological progress refers to increasing output per unit input, or increasing “productive efficiency,” resulting from inventions and innovation.
  • #22 Technological progress, in the vernacular, implies inventions and innovation. In economic terms, technological progress refers to increasing output per unit input, or increasing “productive efficiency,” resulting from inventions and innovation.
  • #25 The first law of thermodynamics, along with Einstein’s insight on the equivalence of energy and matter, tell us that neither energy nor matter may be created nor destroyed (although they may be transformed). This puts a ceiling on the amount of material and energy available for economic production. The second law, the entropy law, may be reduced to the statement that no production process may achieve 100% efficiency. The first and second laws do not allow for a perpetual increase in the production and consumption of goods and services. That is, they put a cap on economic growth.