Download as PDF, PPTX

![Green Growth indicators
Fill data gaps
• Consistent environmental-economic data at industry level
structural changes; industry profiles
• Natural assets and material flows
• Biodiversity and ecosystem services
• Quality of life dimensions [“well-being”]
Capture better
• The growth contribution of natural assets
• The “greening” of economic sectors beyond “eco-industries”
• Economic opportunities and the effectiveness of policies
Role of System of Environmental-Economic Accounts (SEEA)
• Key for consistent information on environment-economy interface
• Key for enabling a breakdown by industry
• Key for better capturing the growth contribution of natural assets
29
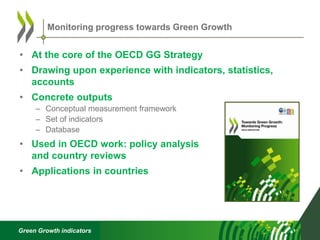
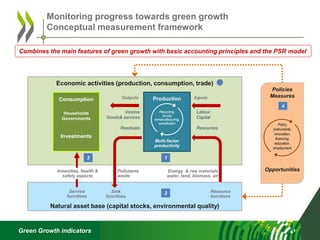
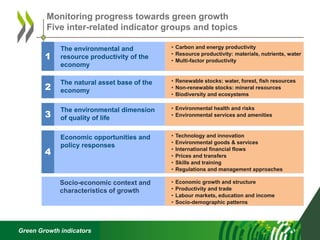
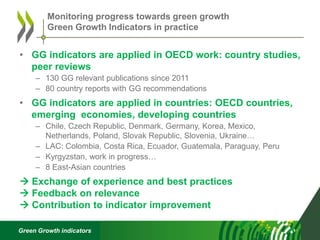
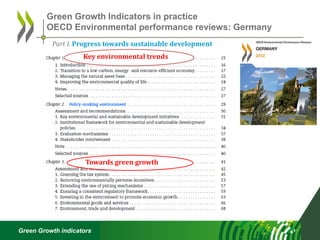
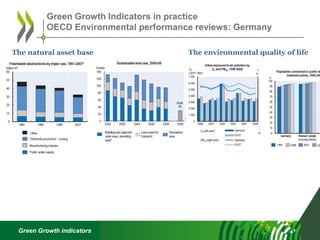
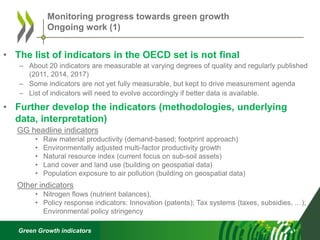
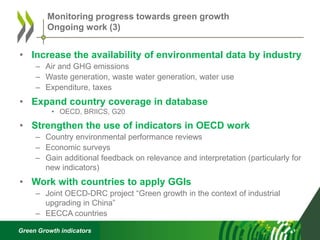
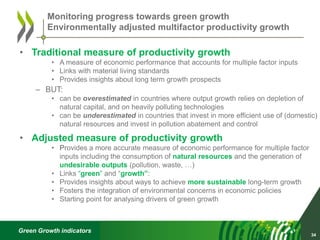
Monitoring progress towards green growth
Advancing the measurement agenda](https://image.slidesharecdn.com/oecd-ggiworkshopinarmenia-2016-160613132348/85/Presentation-by-the-OECD-29-320.jpg)


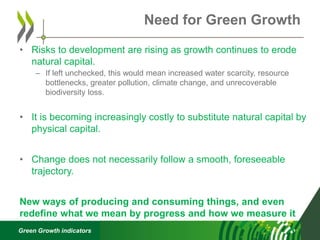
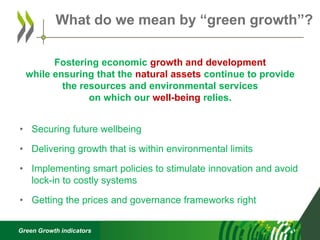
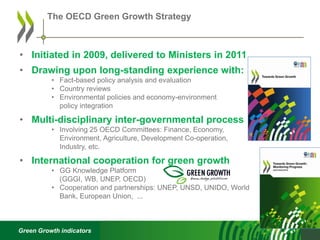
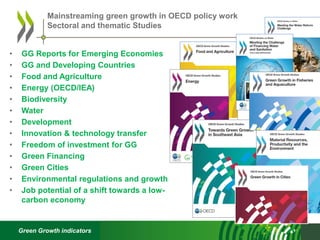
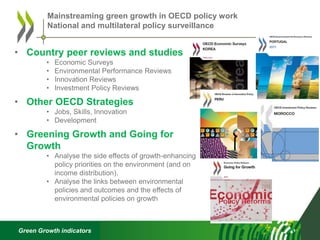
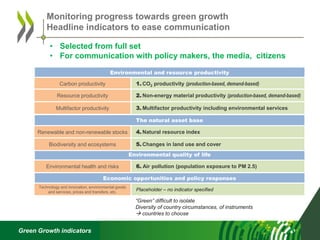
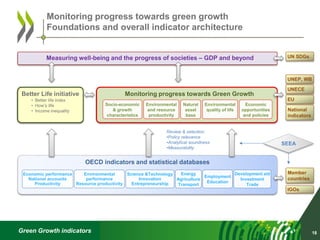
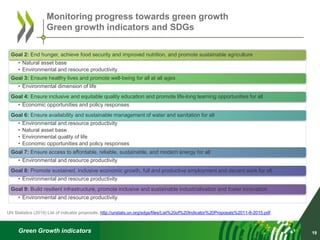
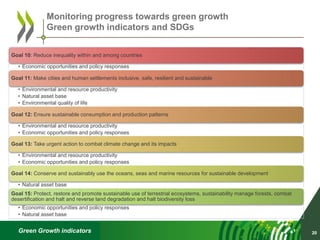
The OECD Green Growth Strategy and its measurement framework aims to foster economic growth while ensuring the sustainable use of natural resources. It presents a conceptual framework and set of indicators to monitor progress towards green growth. The framework includes indicators on environmental productivity, the natural asset base, environmental quality of life, and economic opportunities. It is applied in OECD analysis and country reviews to help countries advance green growth measurement and policies. Ongoing work includes filling data gaps, refining indicators, and increasing country coverage to further support monitoring progress on green growth.


