Download as PDF, PPTX
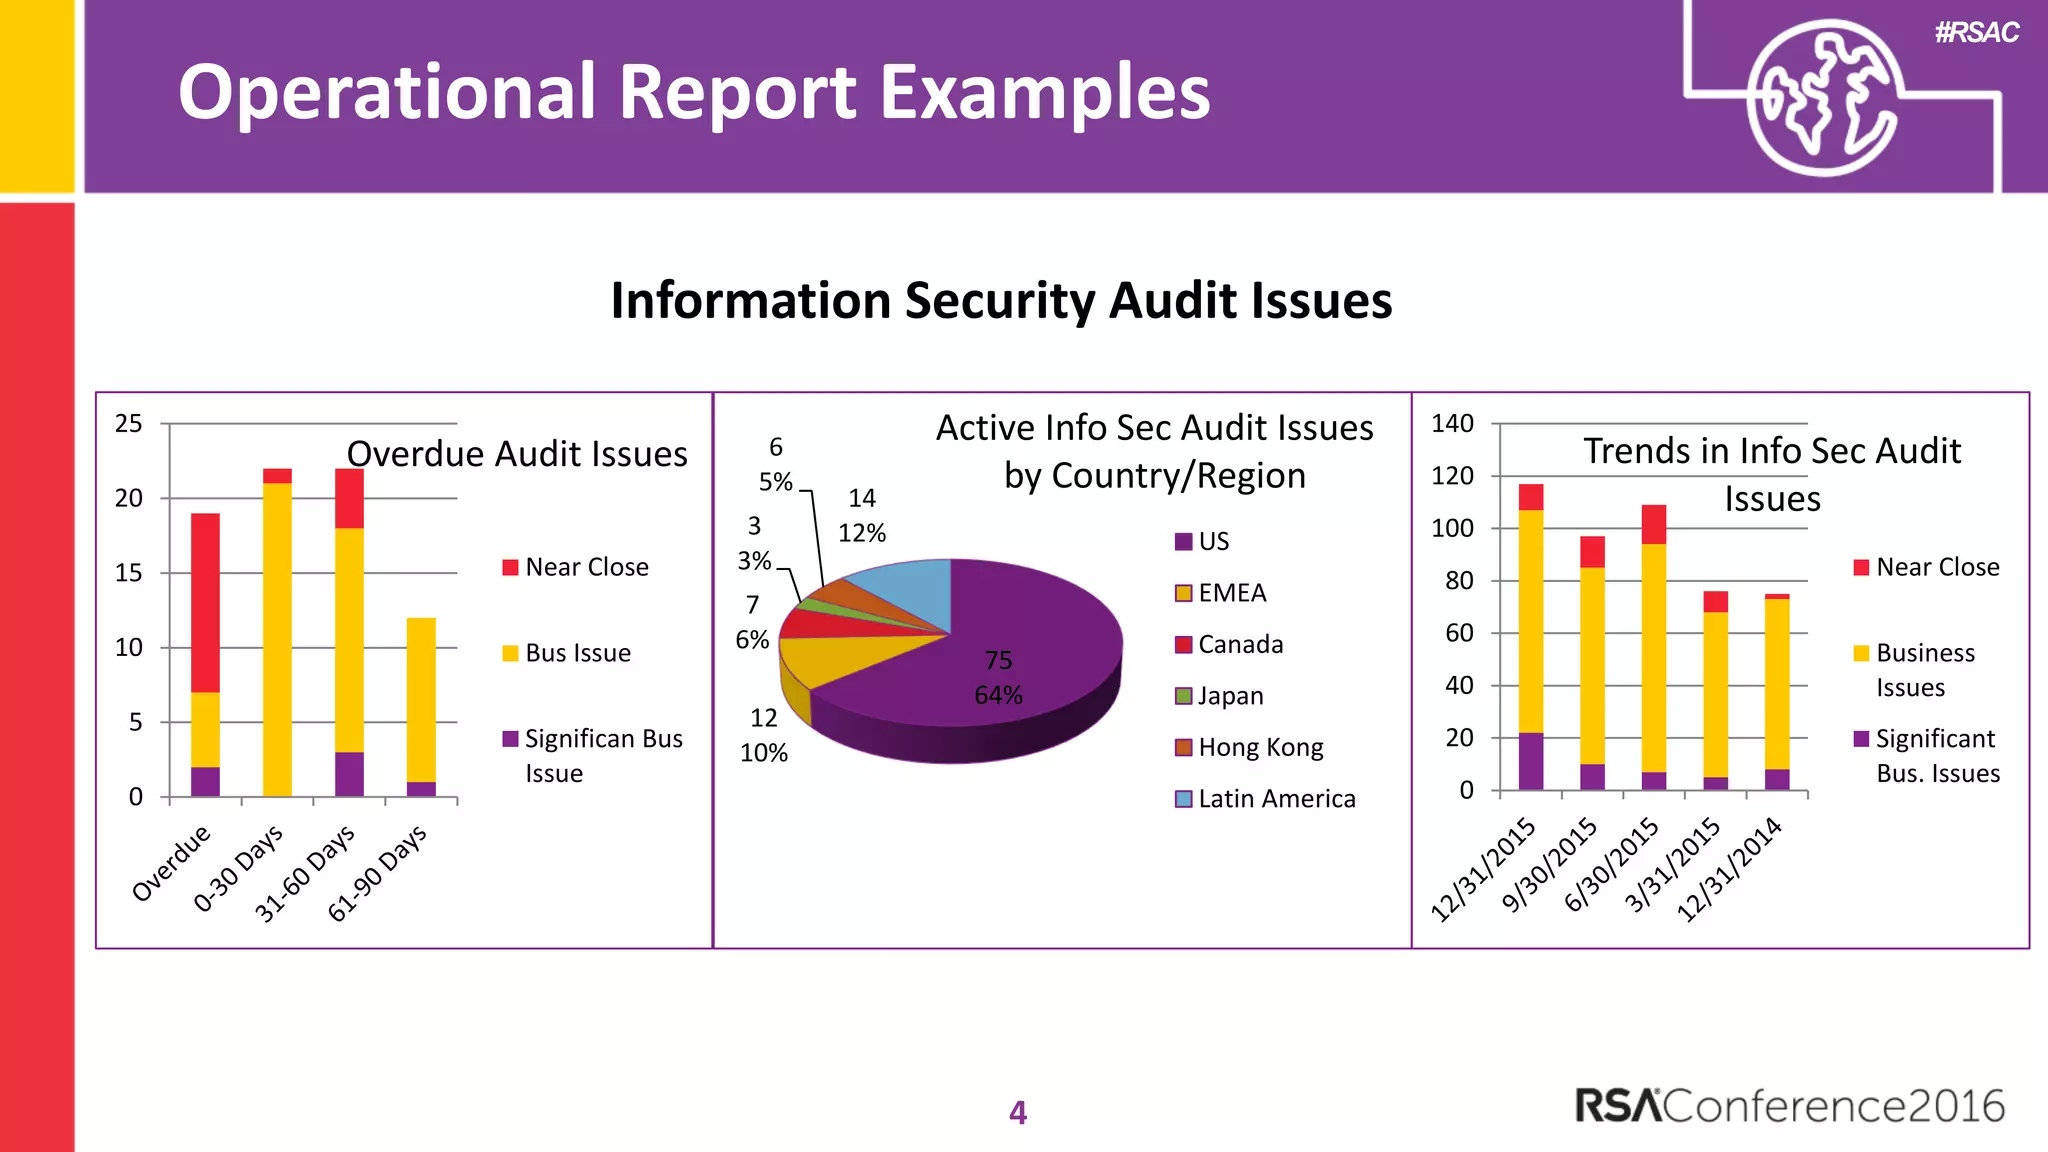
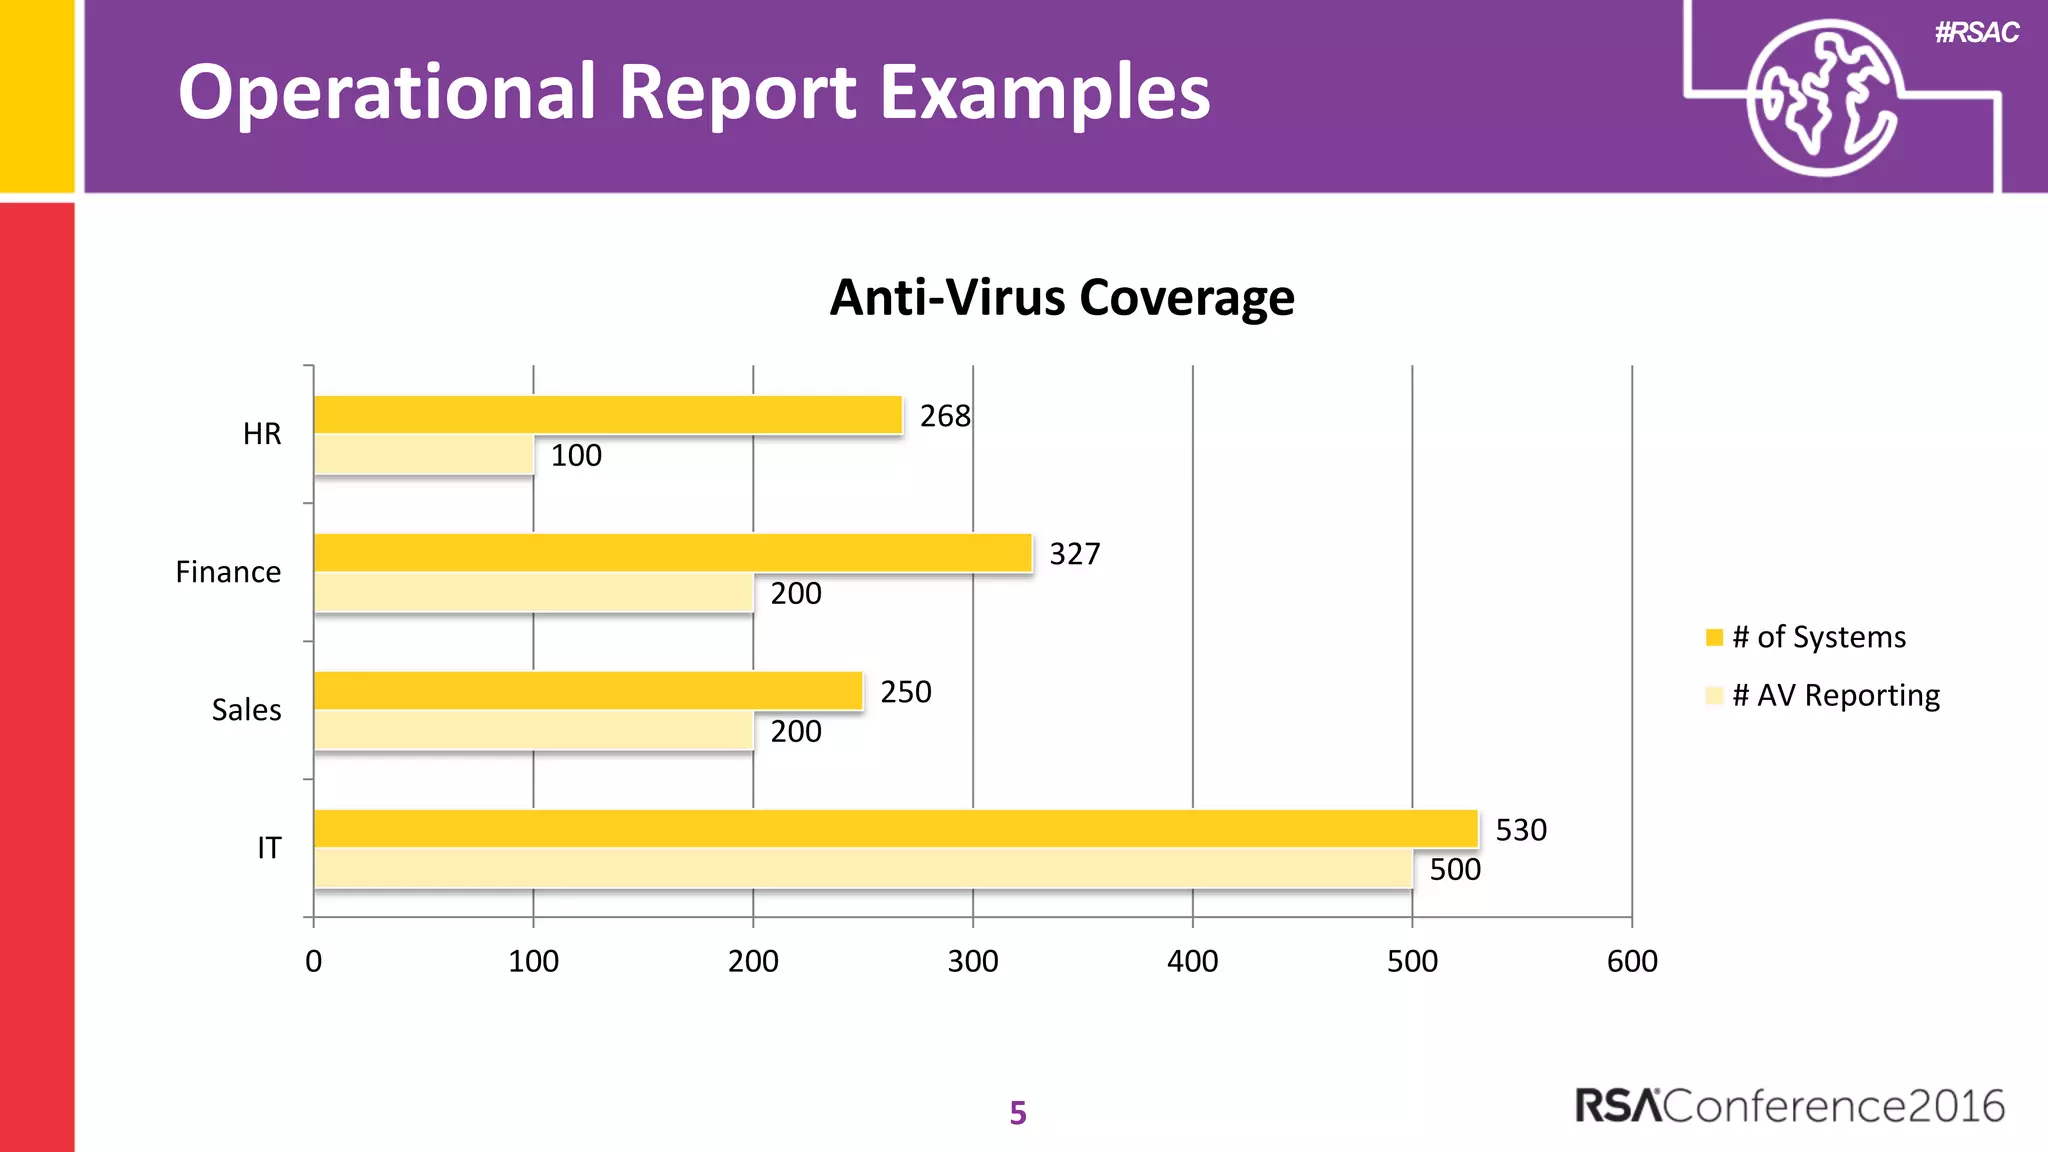
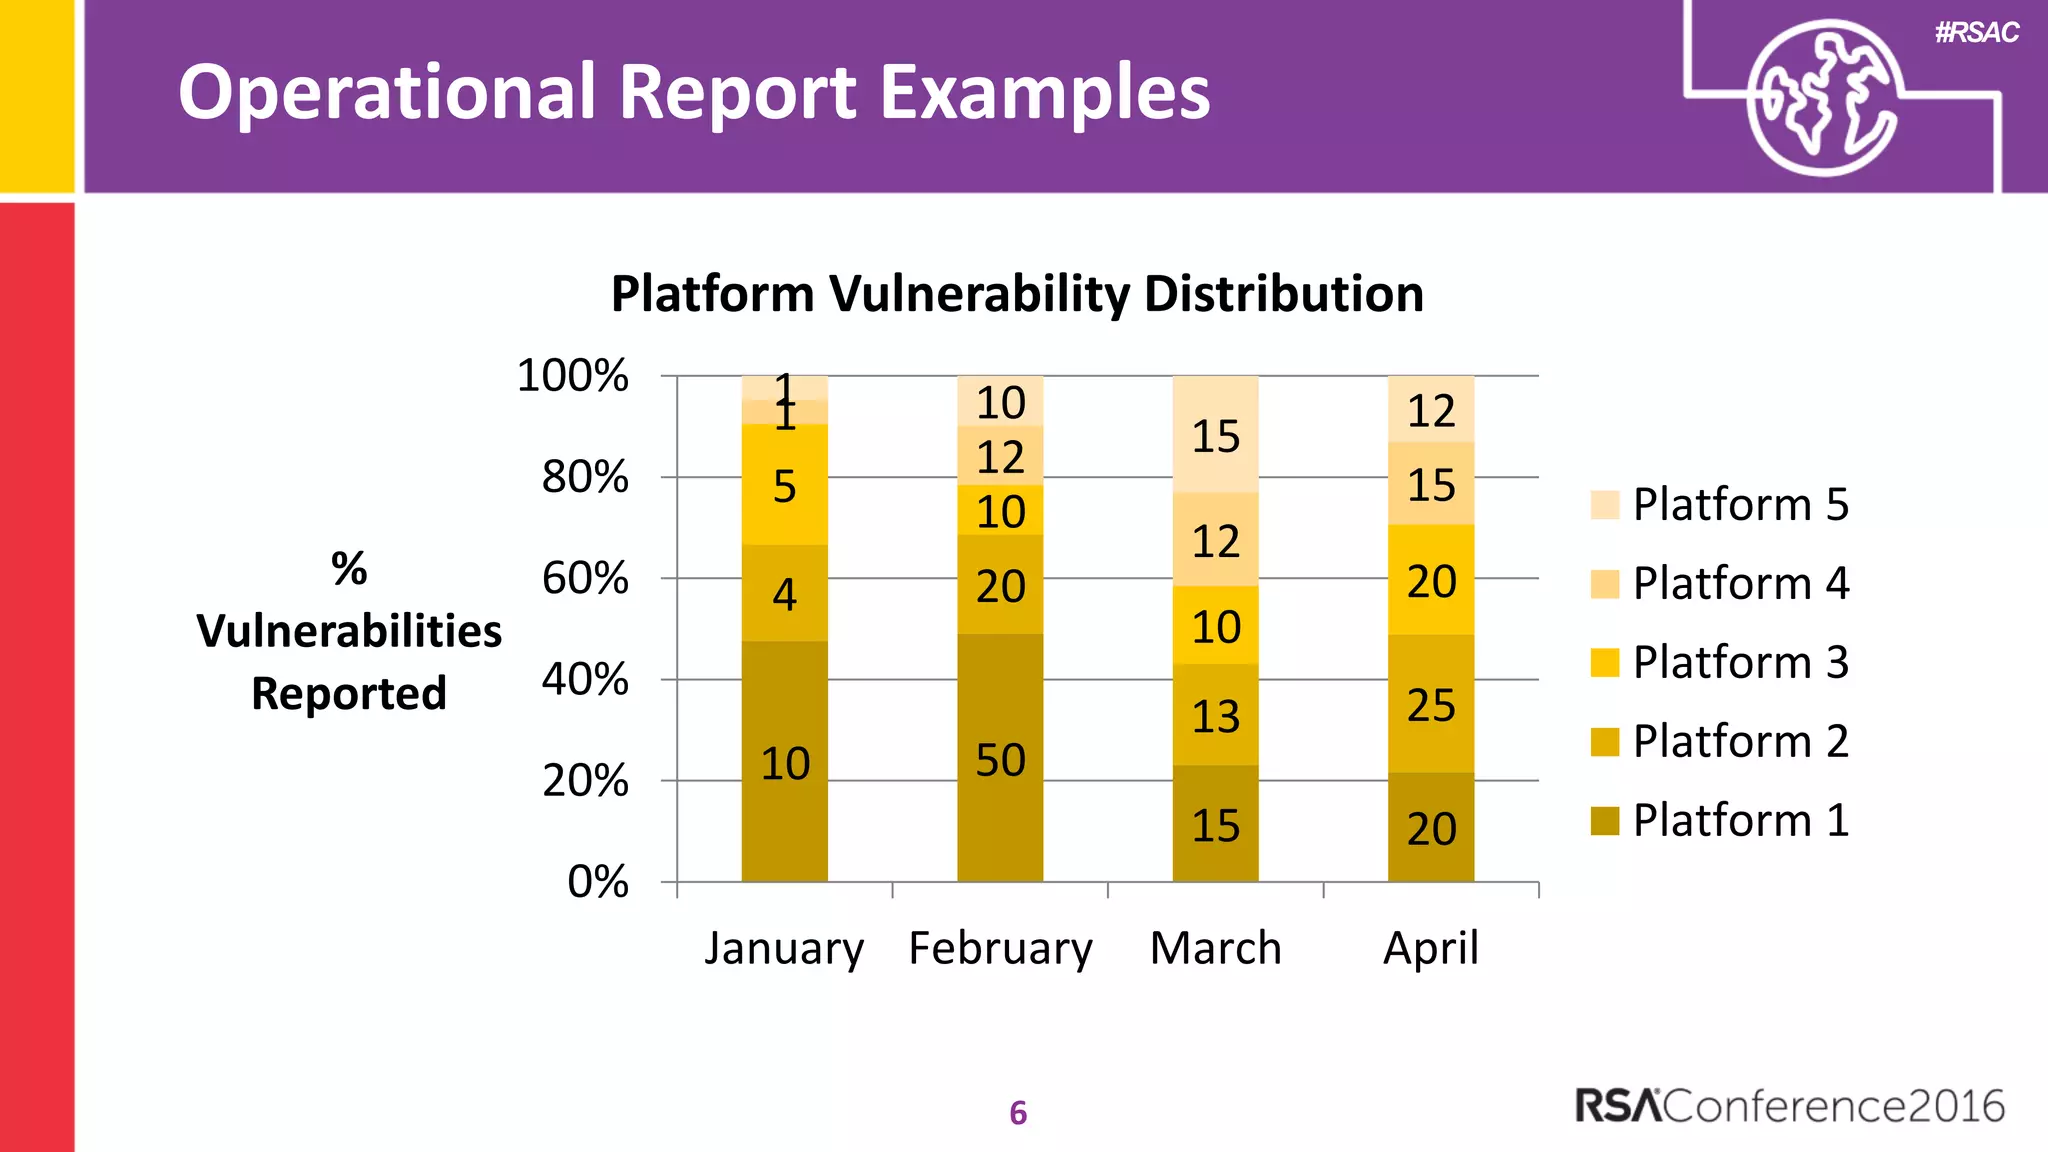
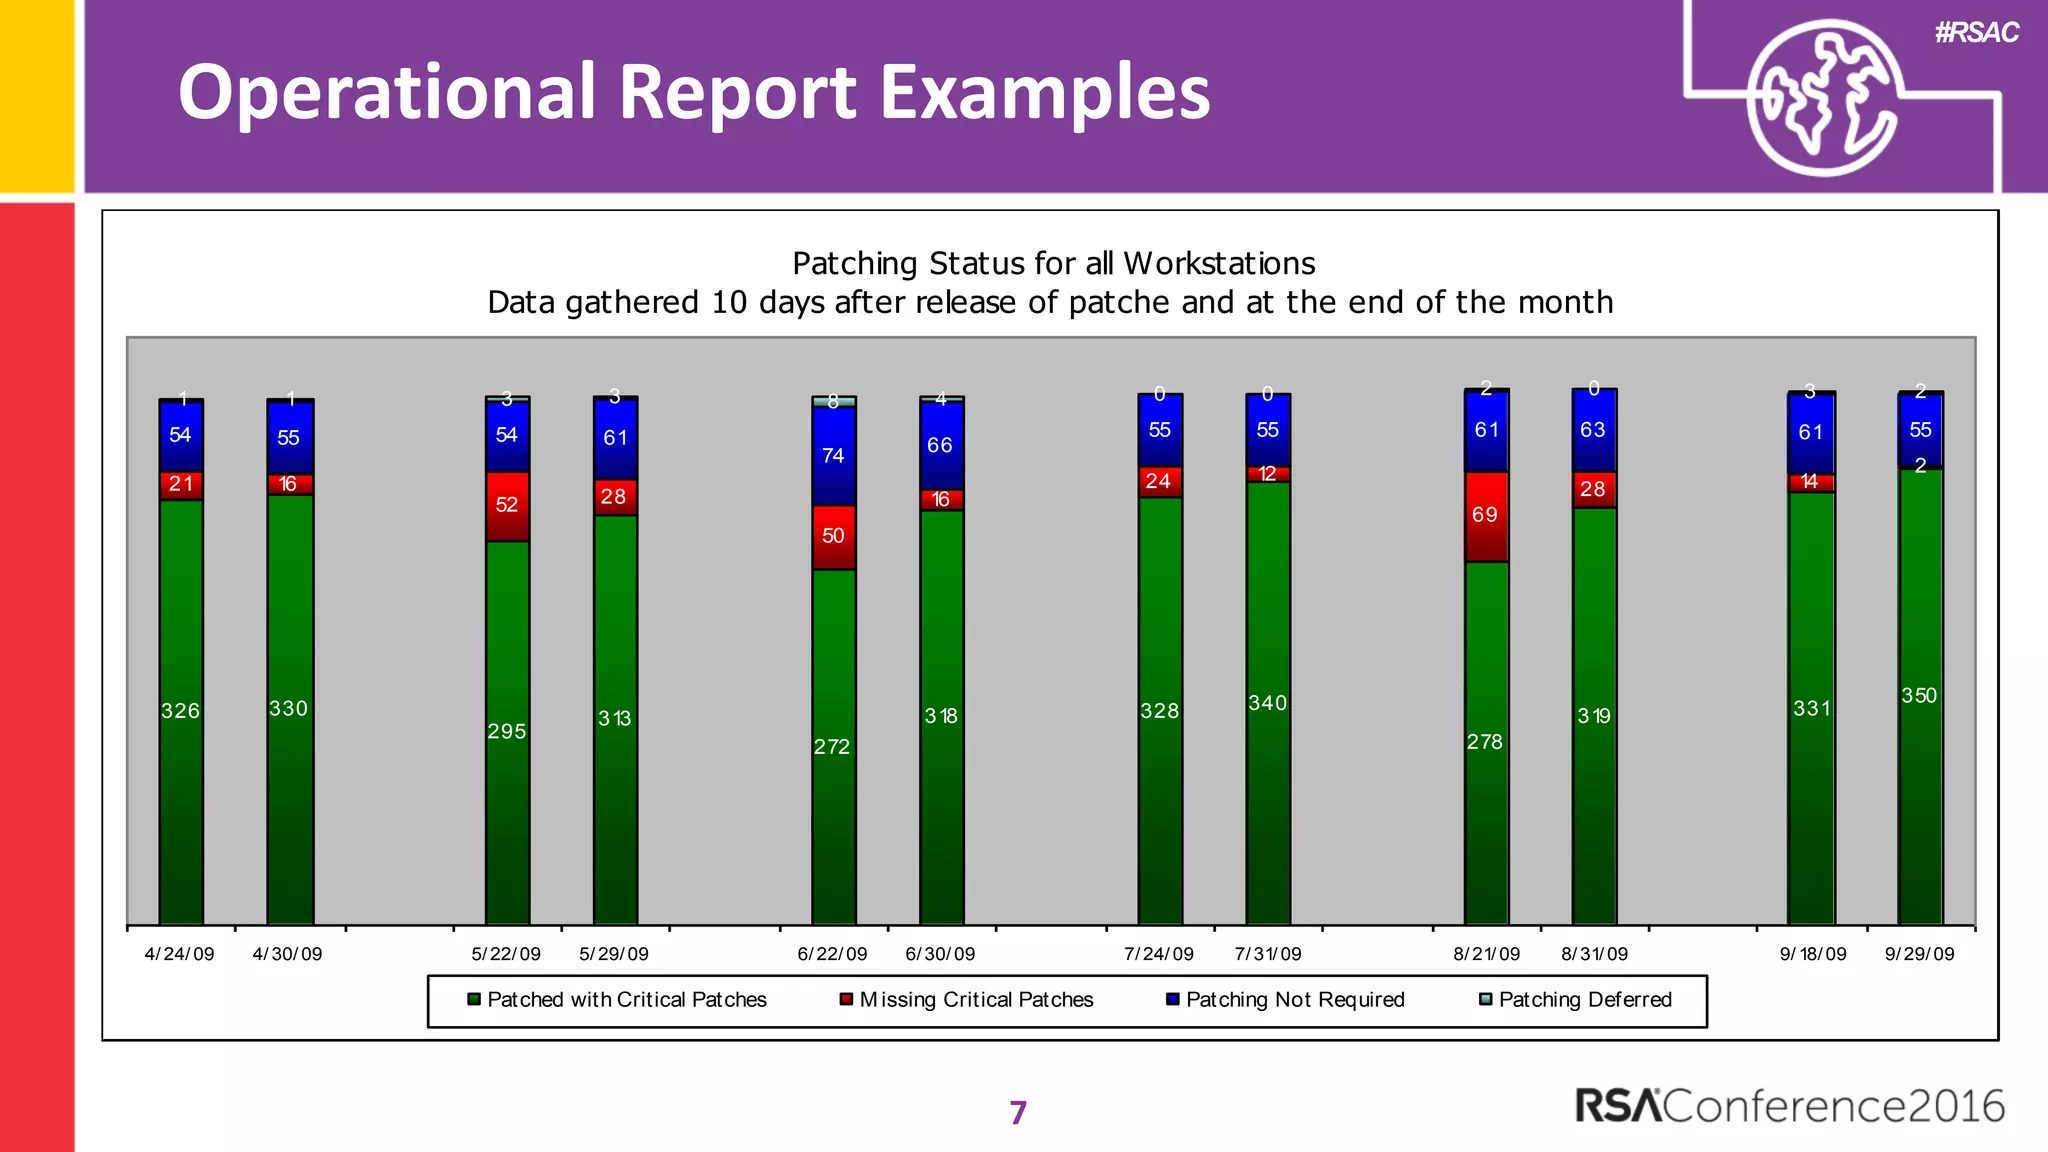
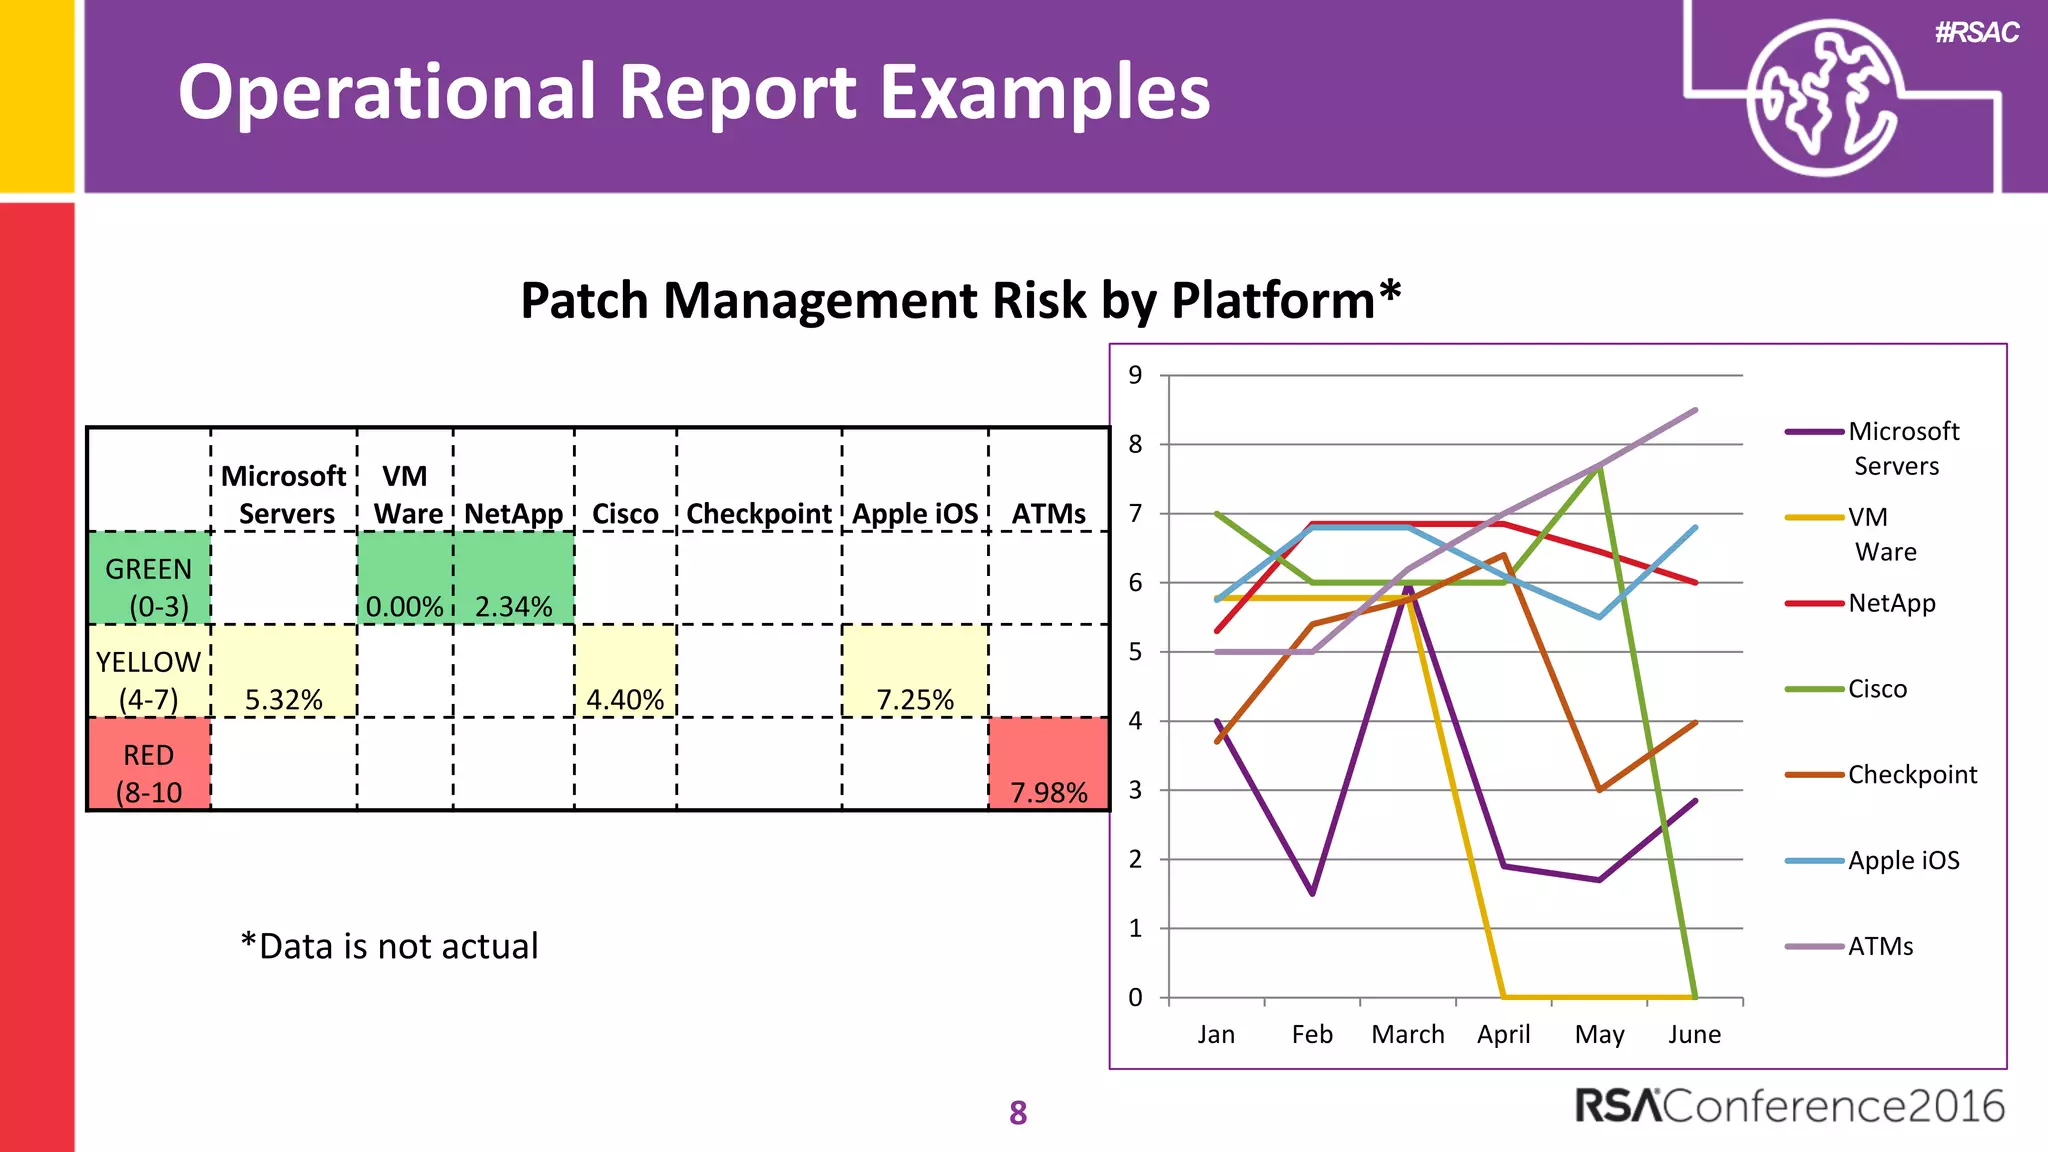
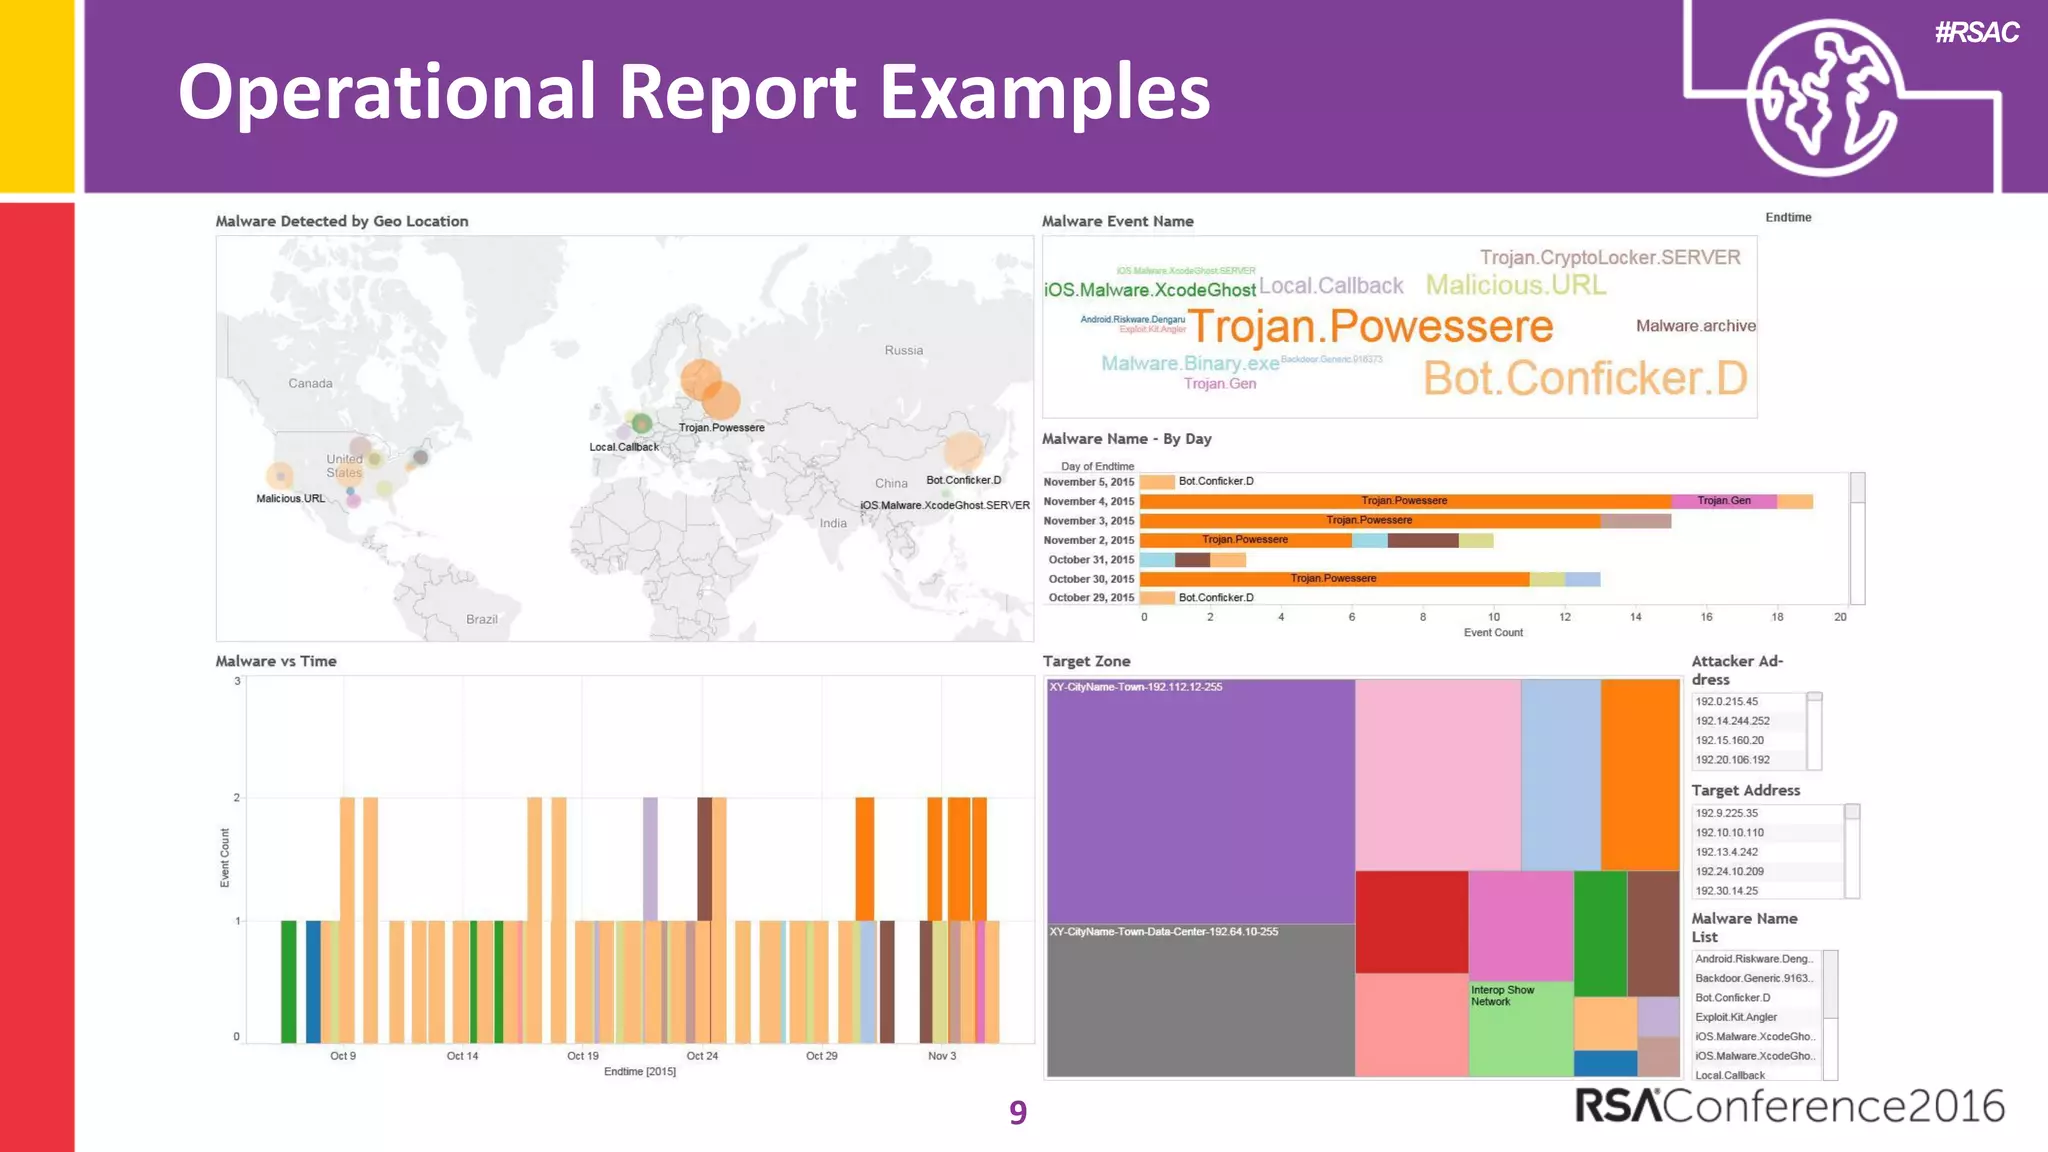
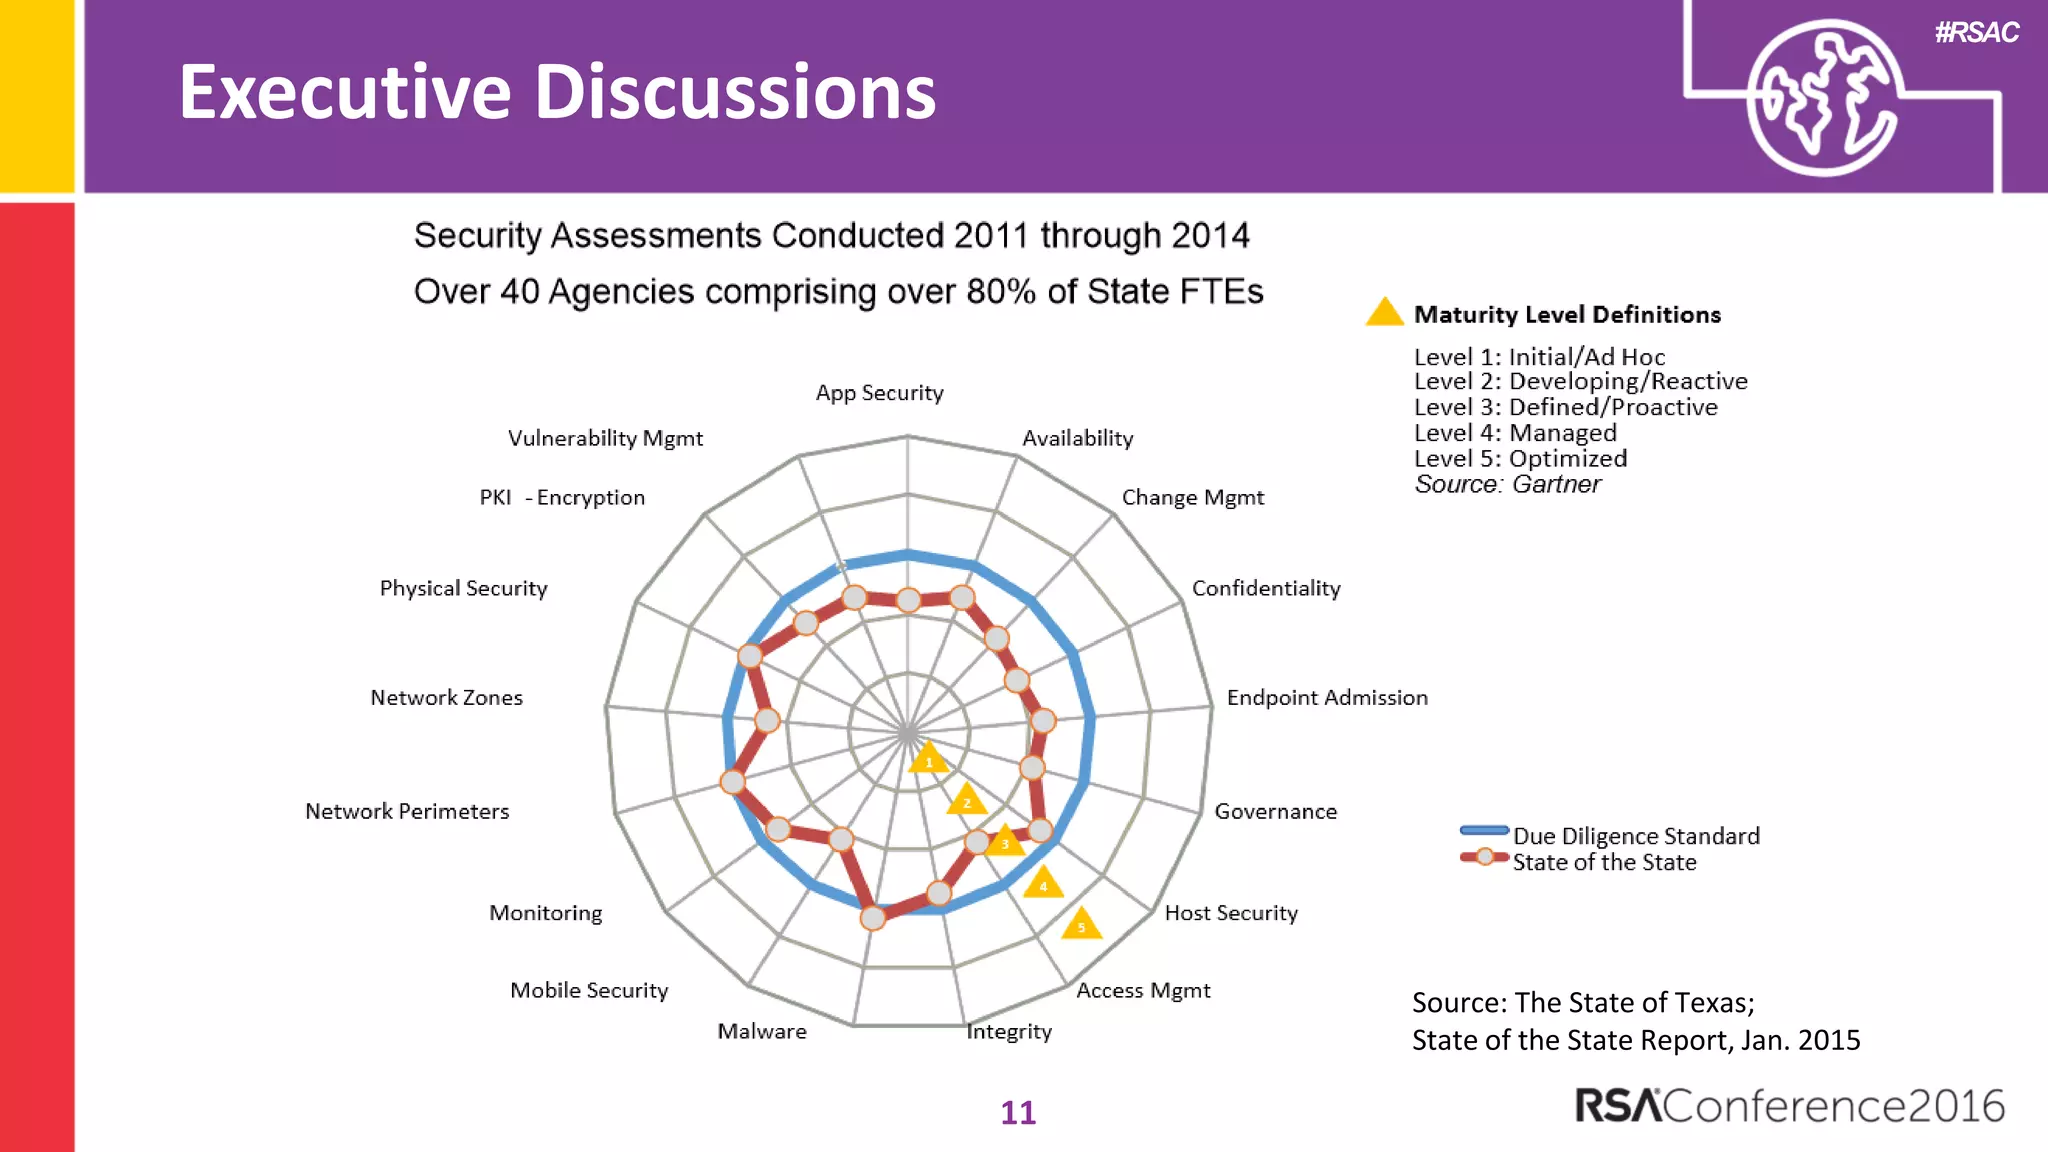
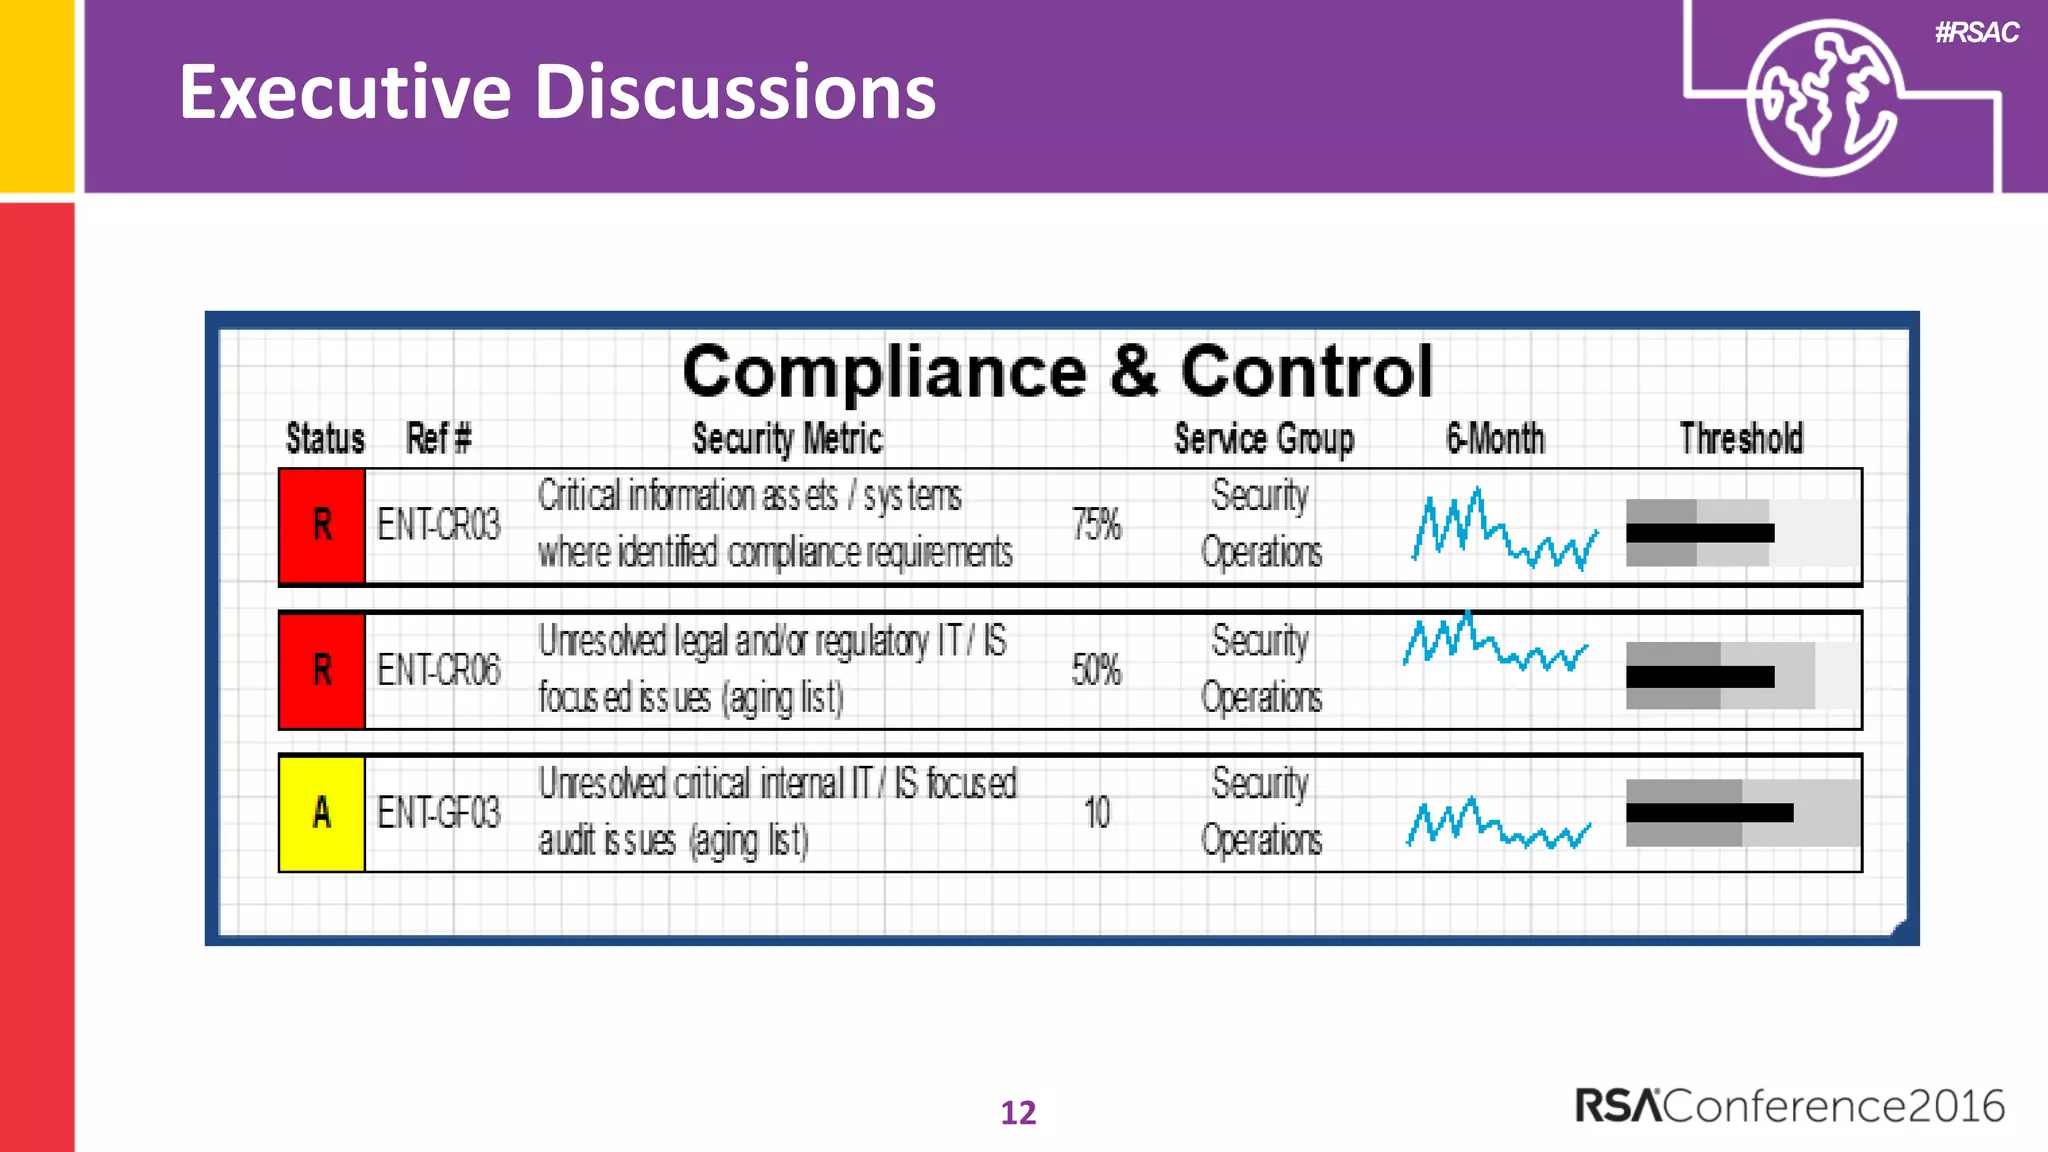
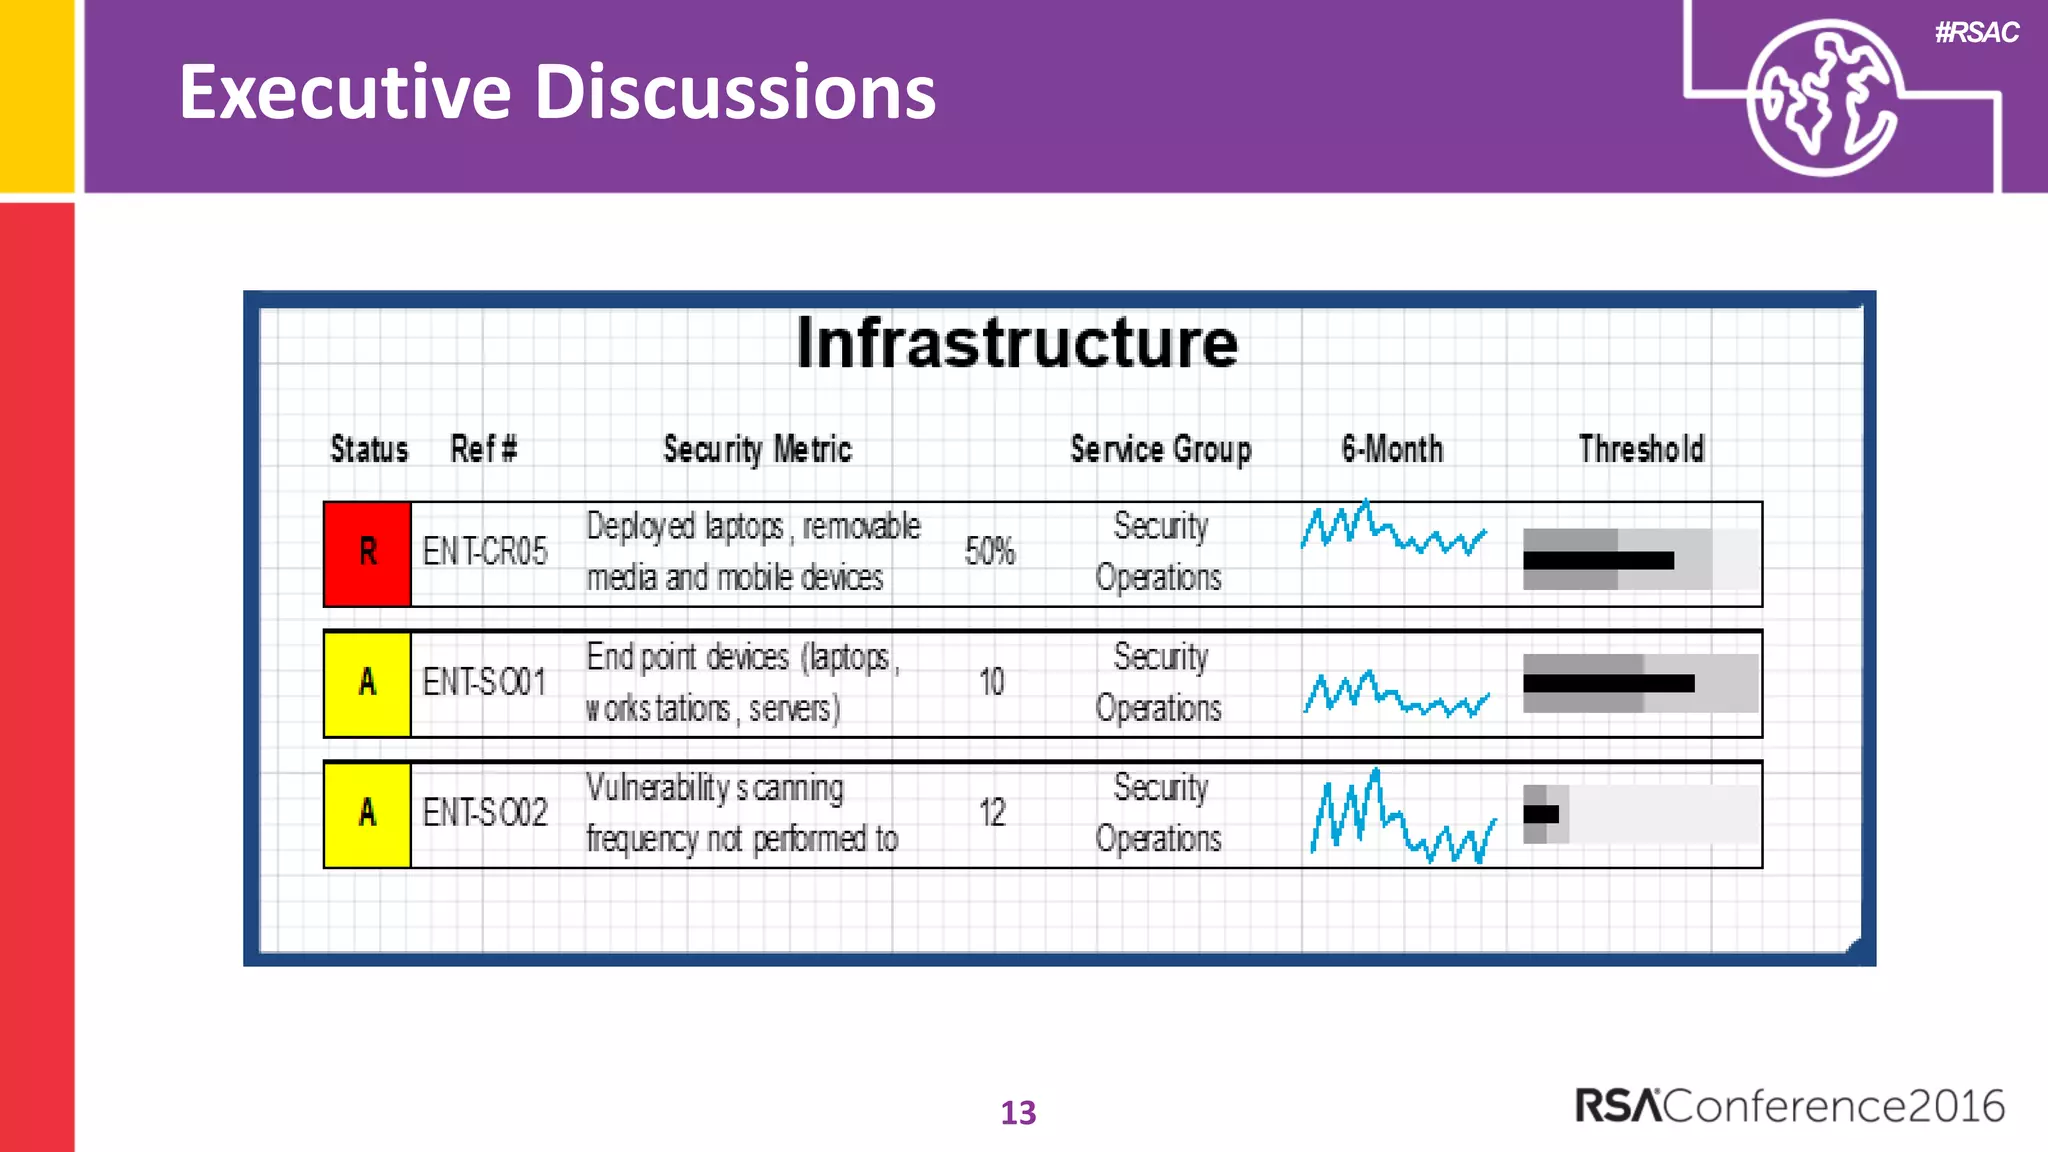
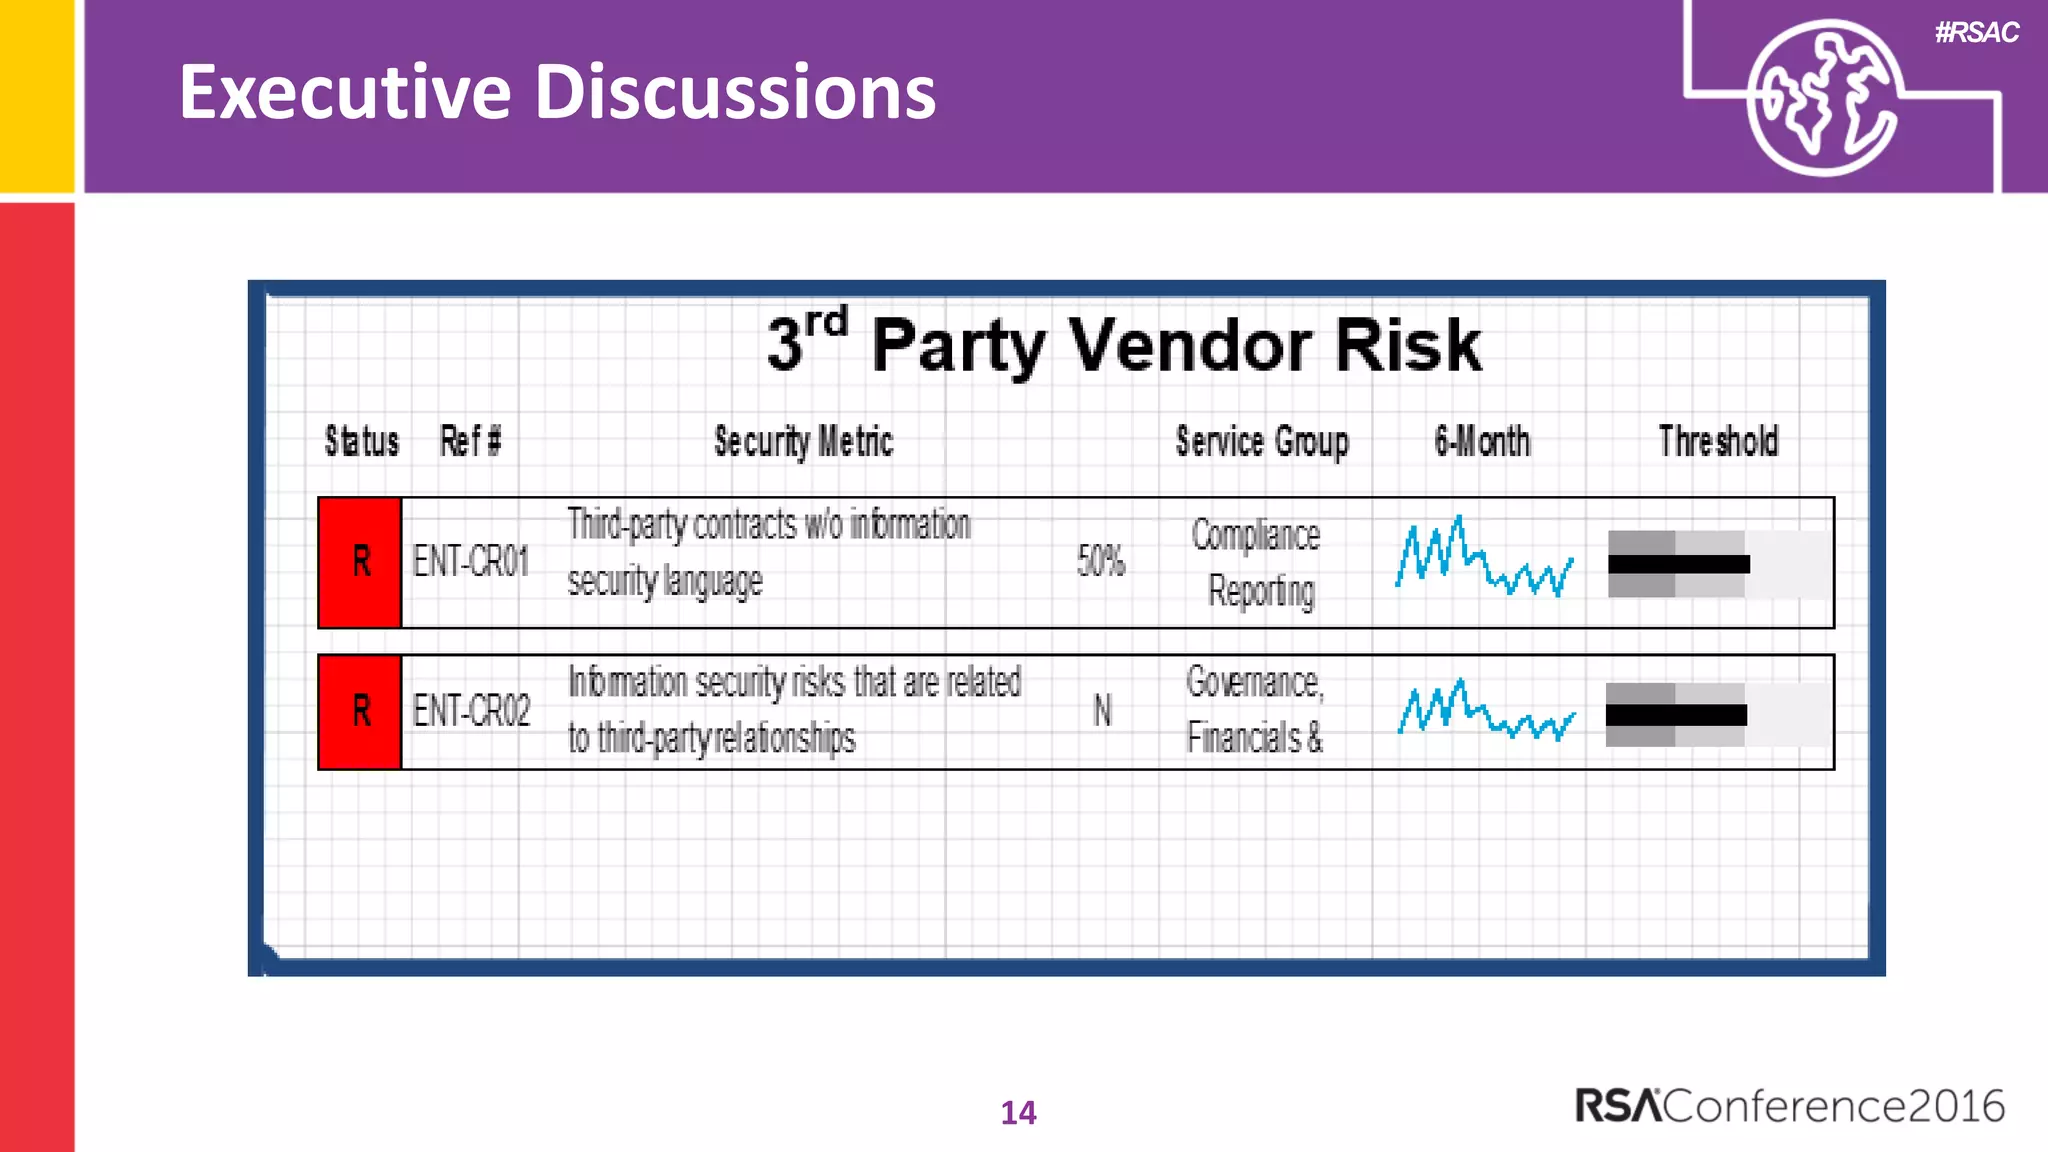
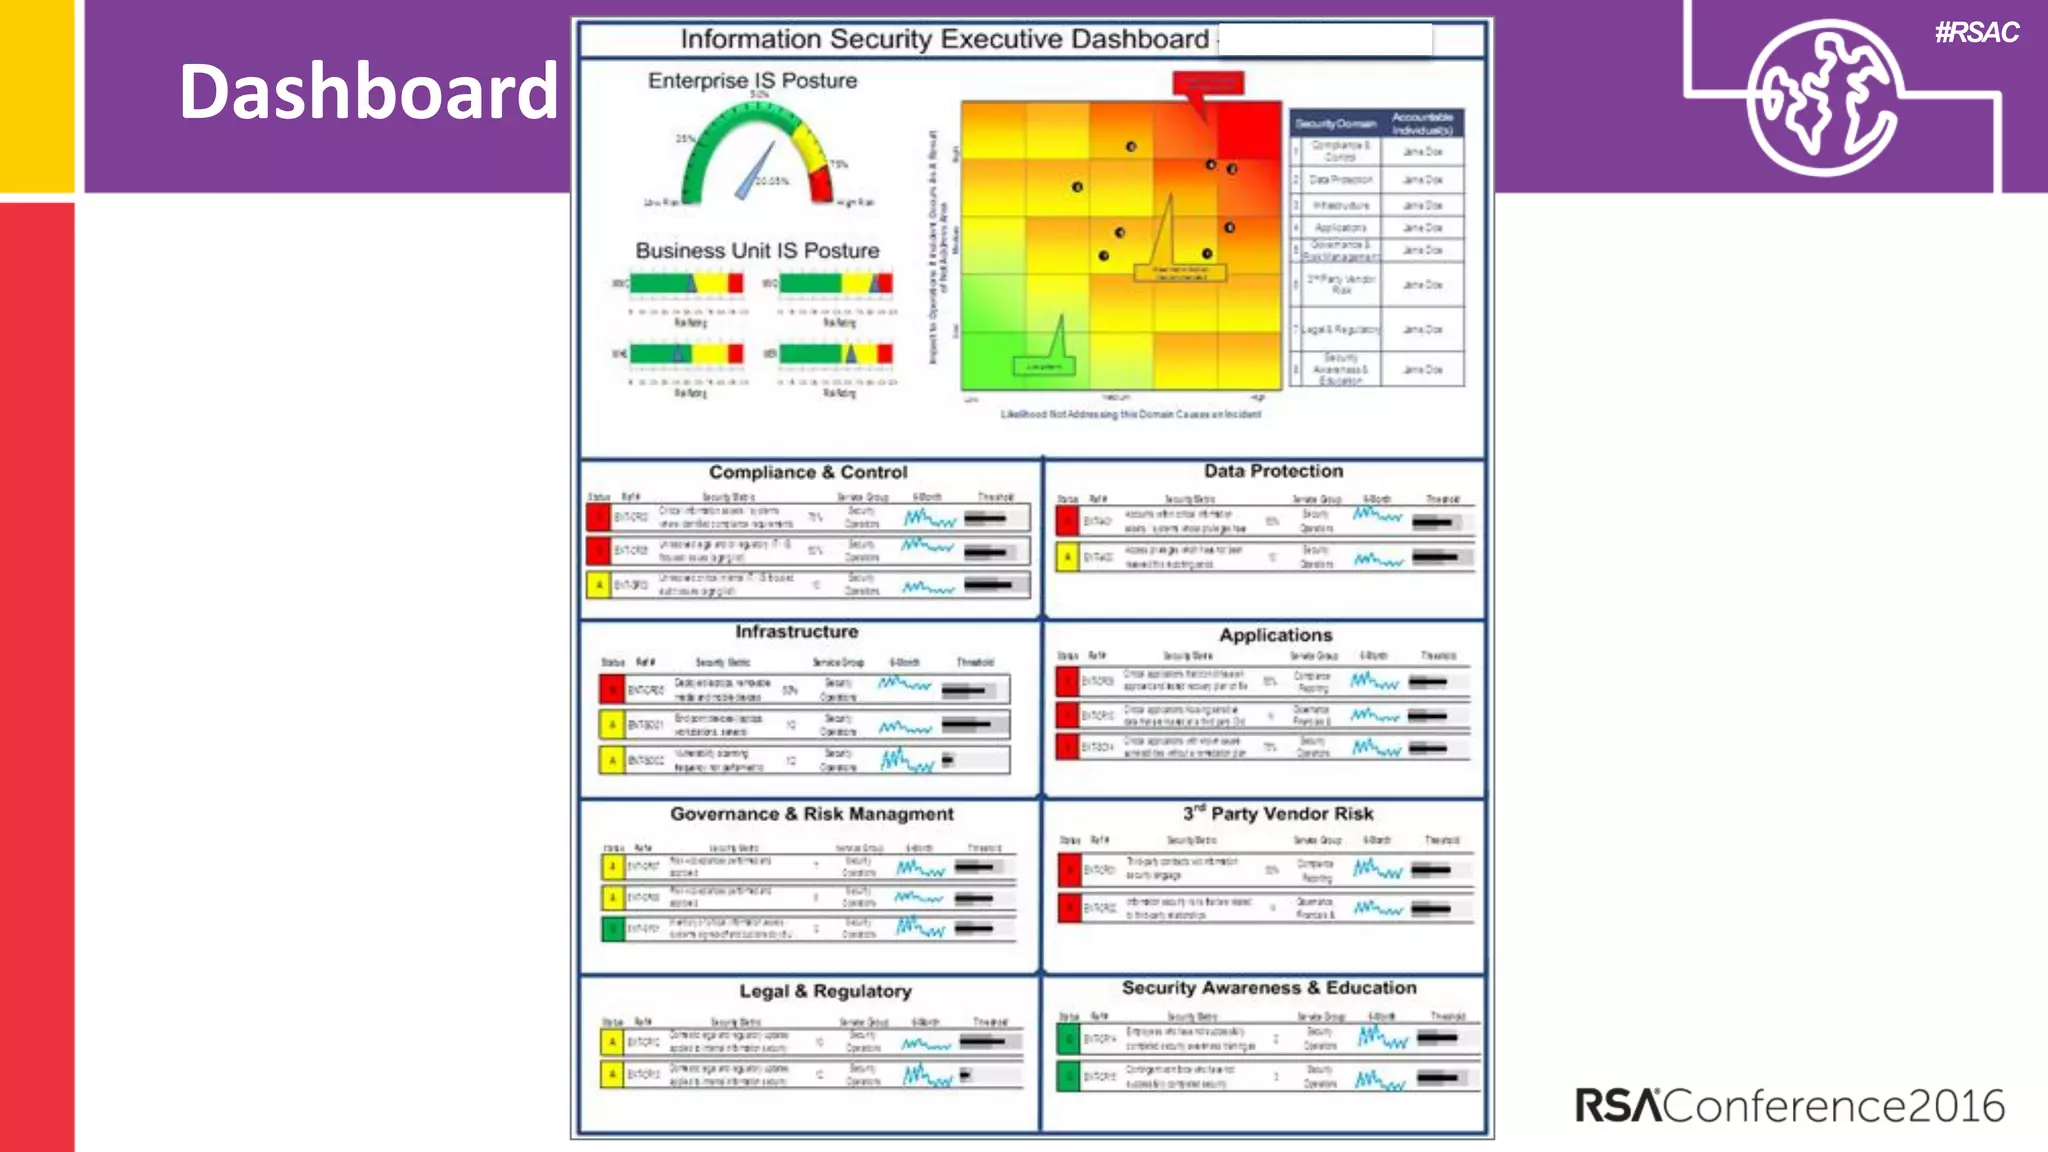
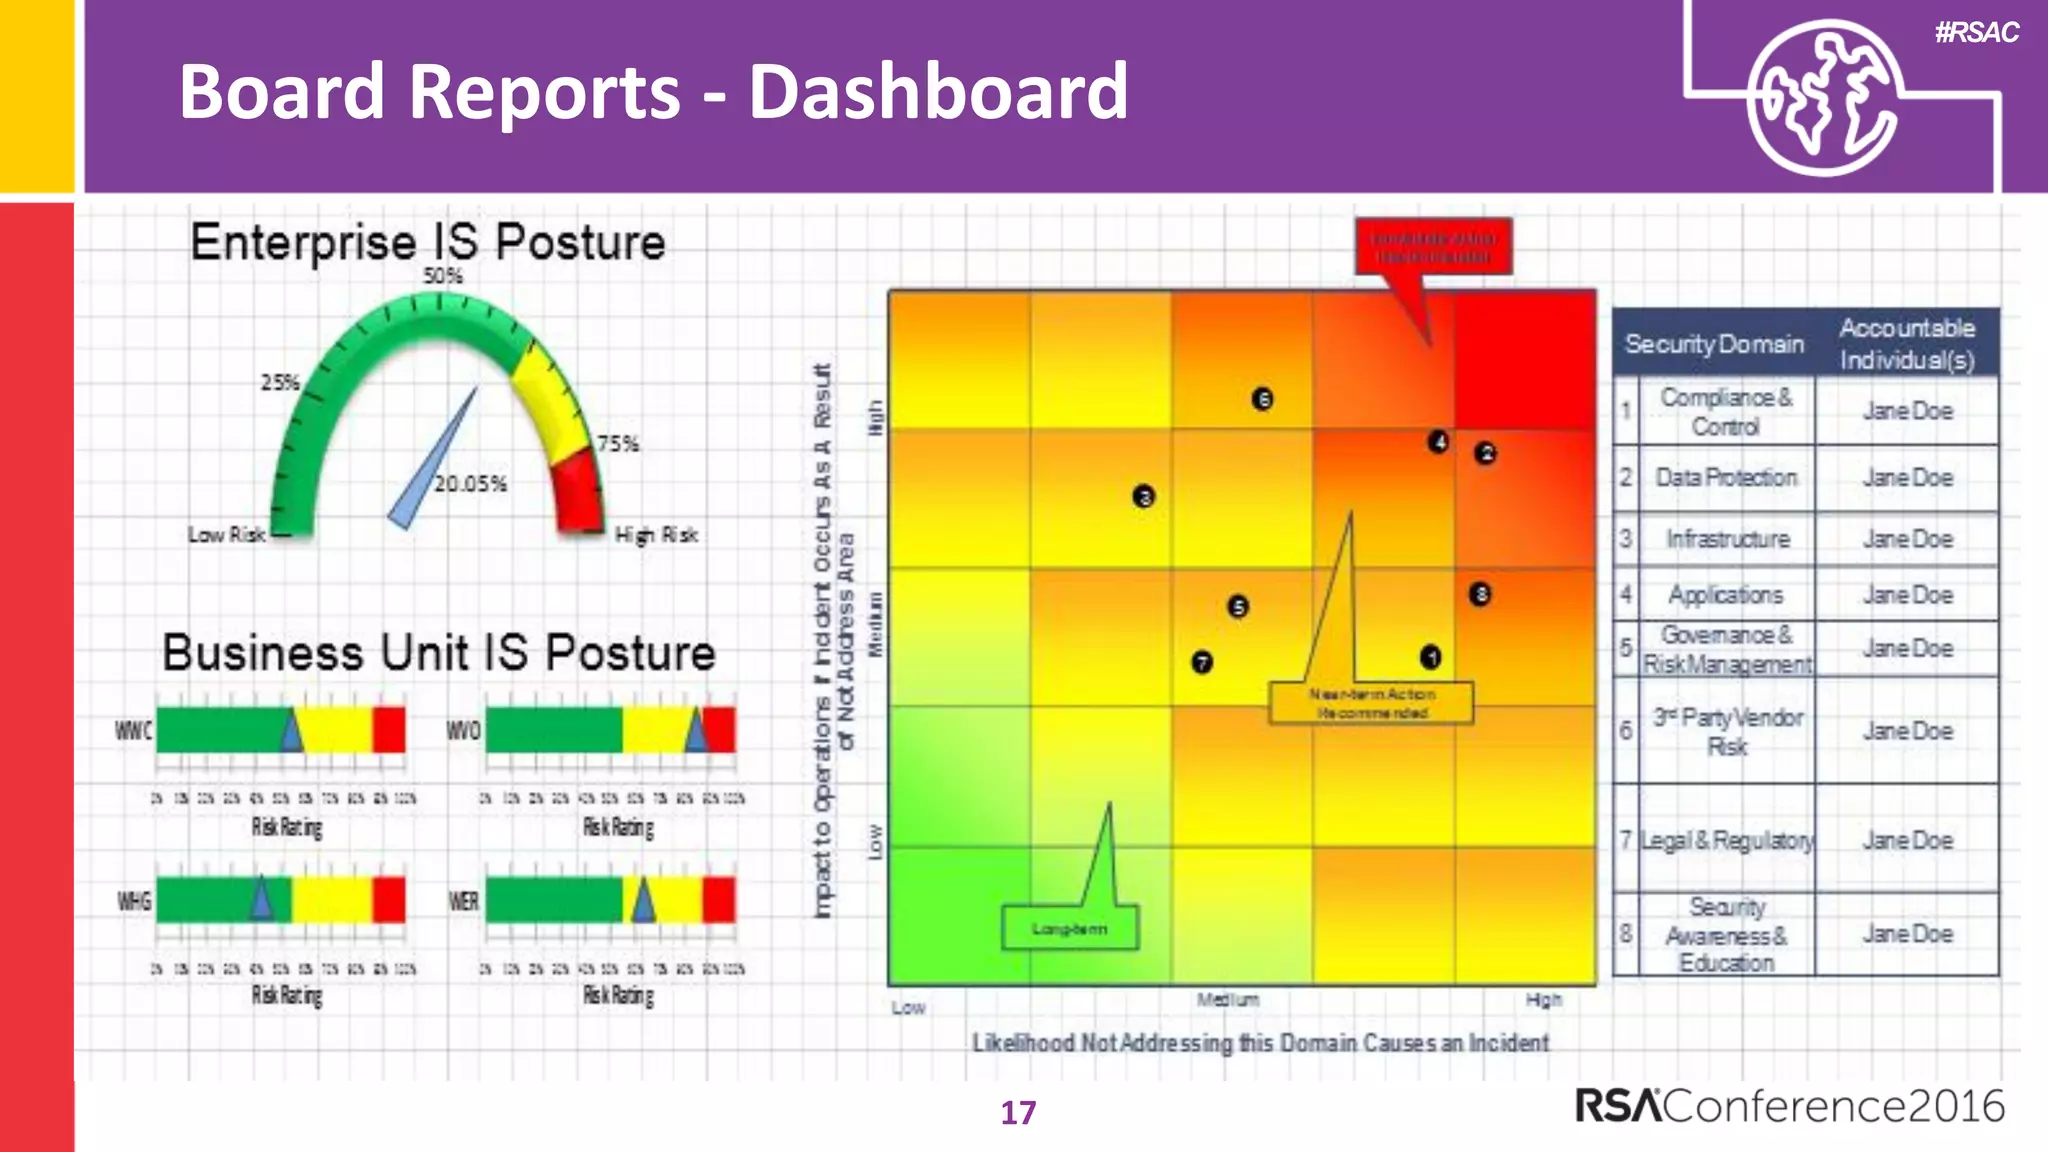
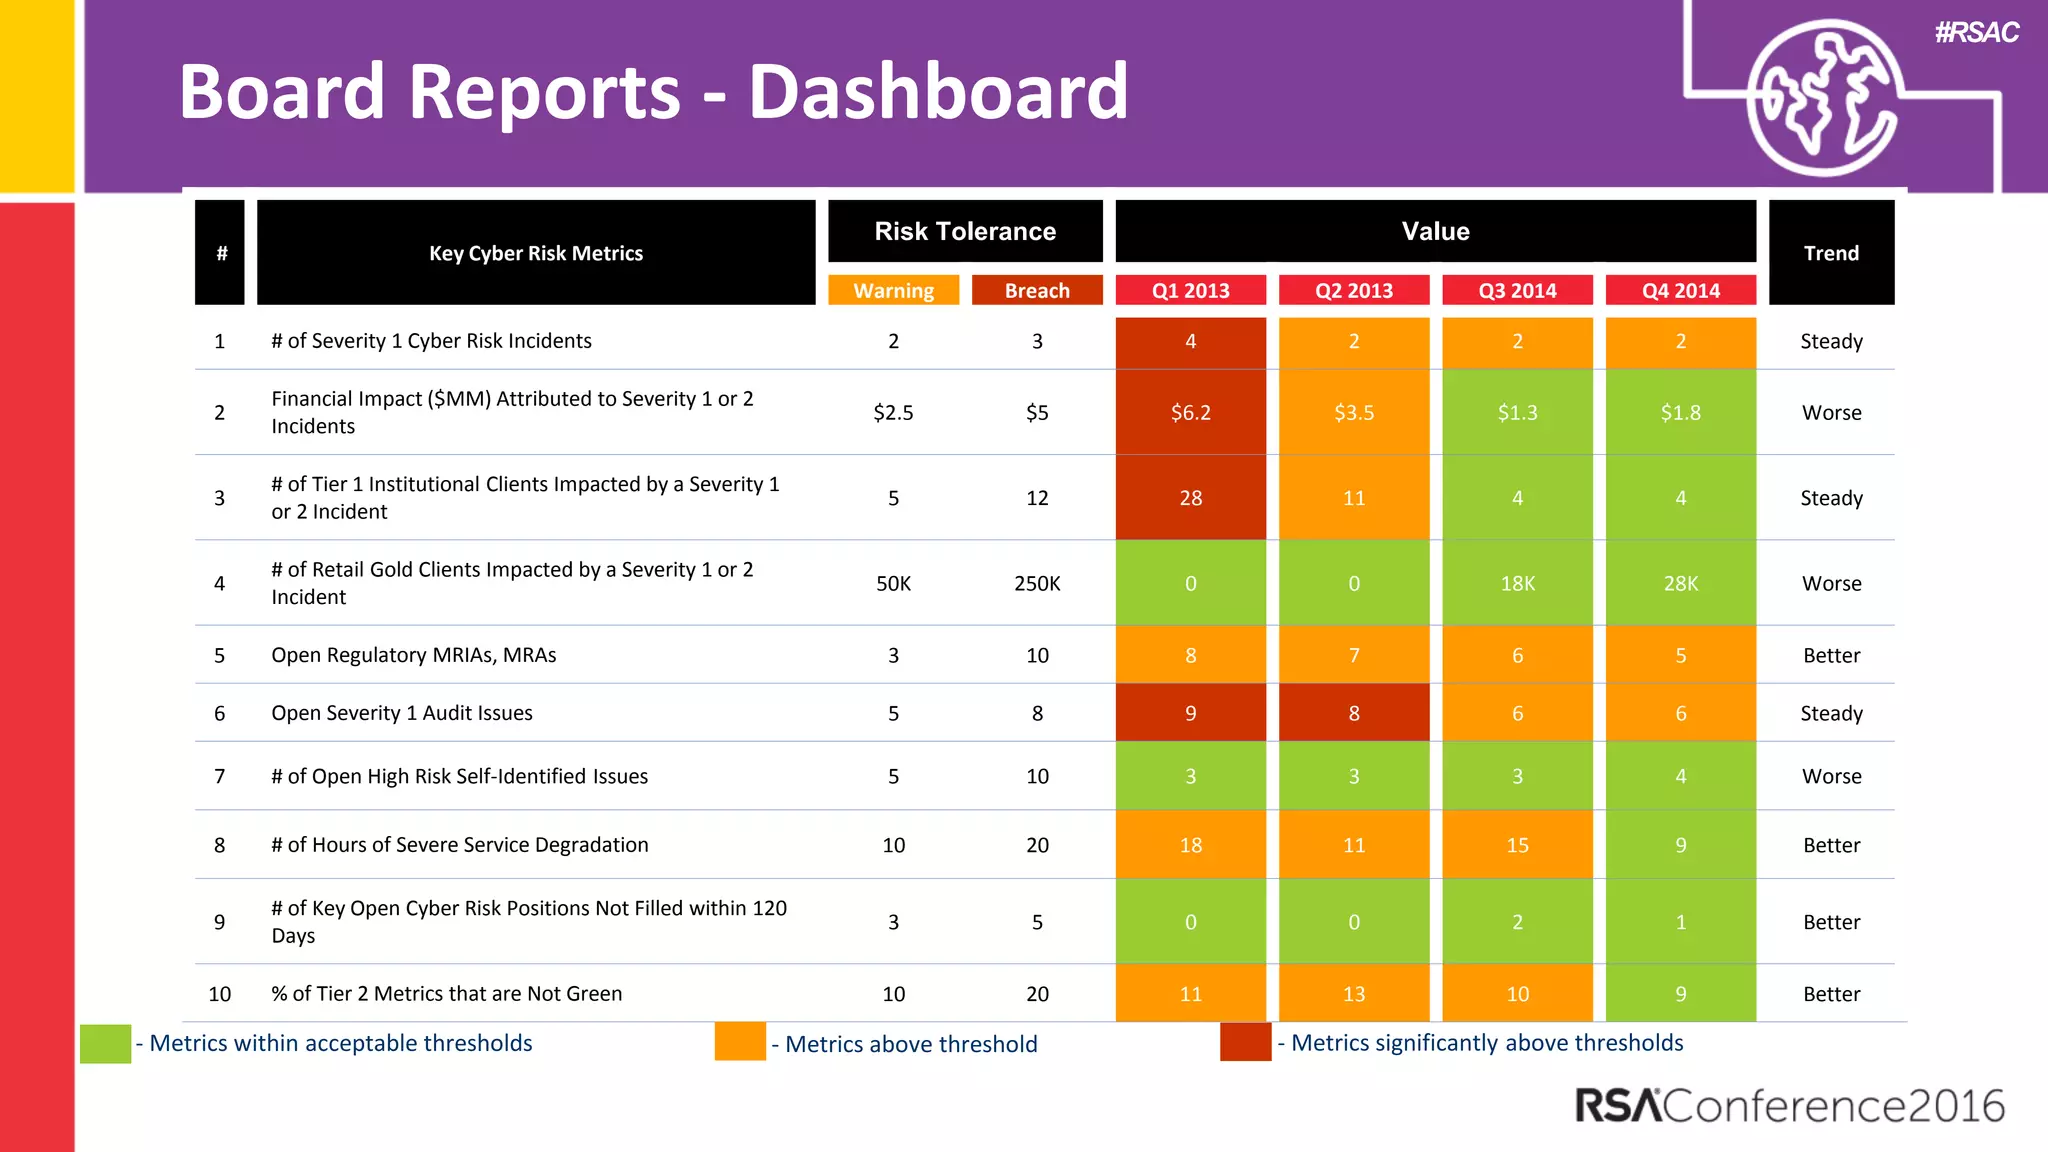
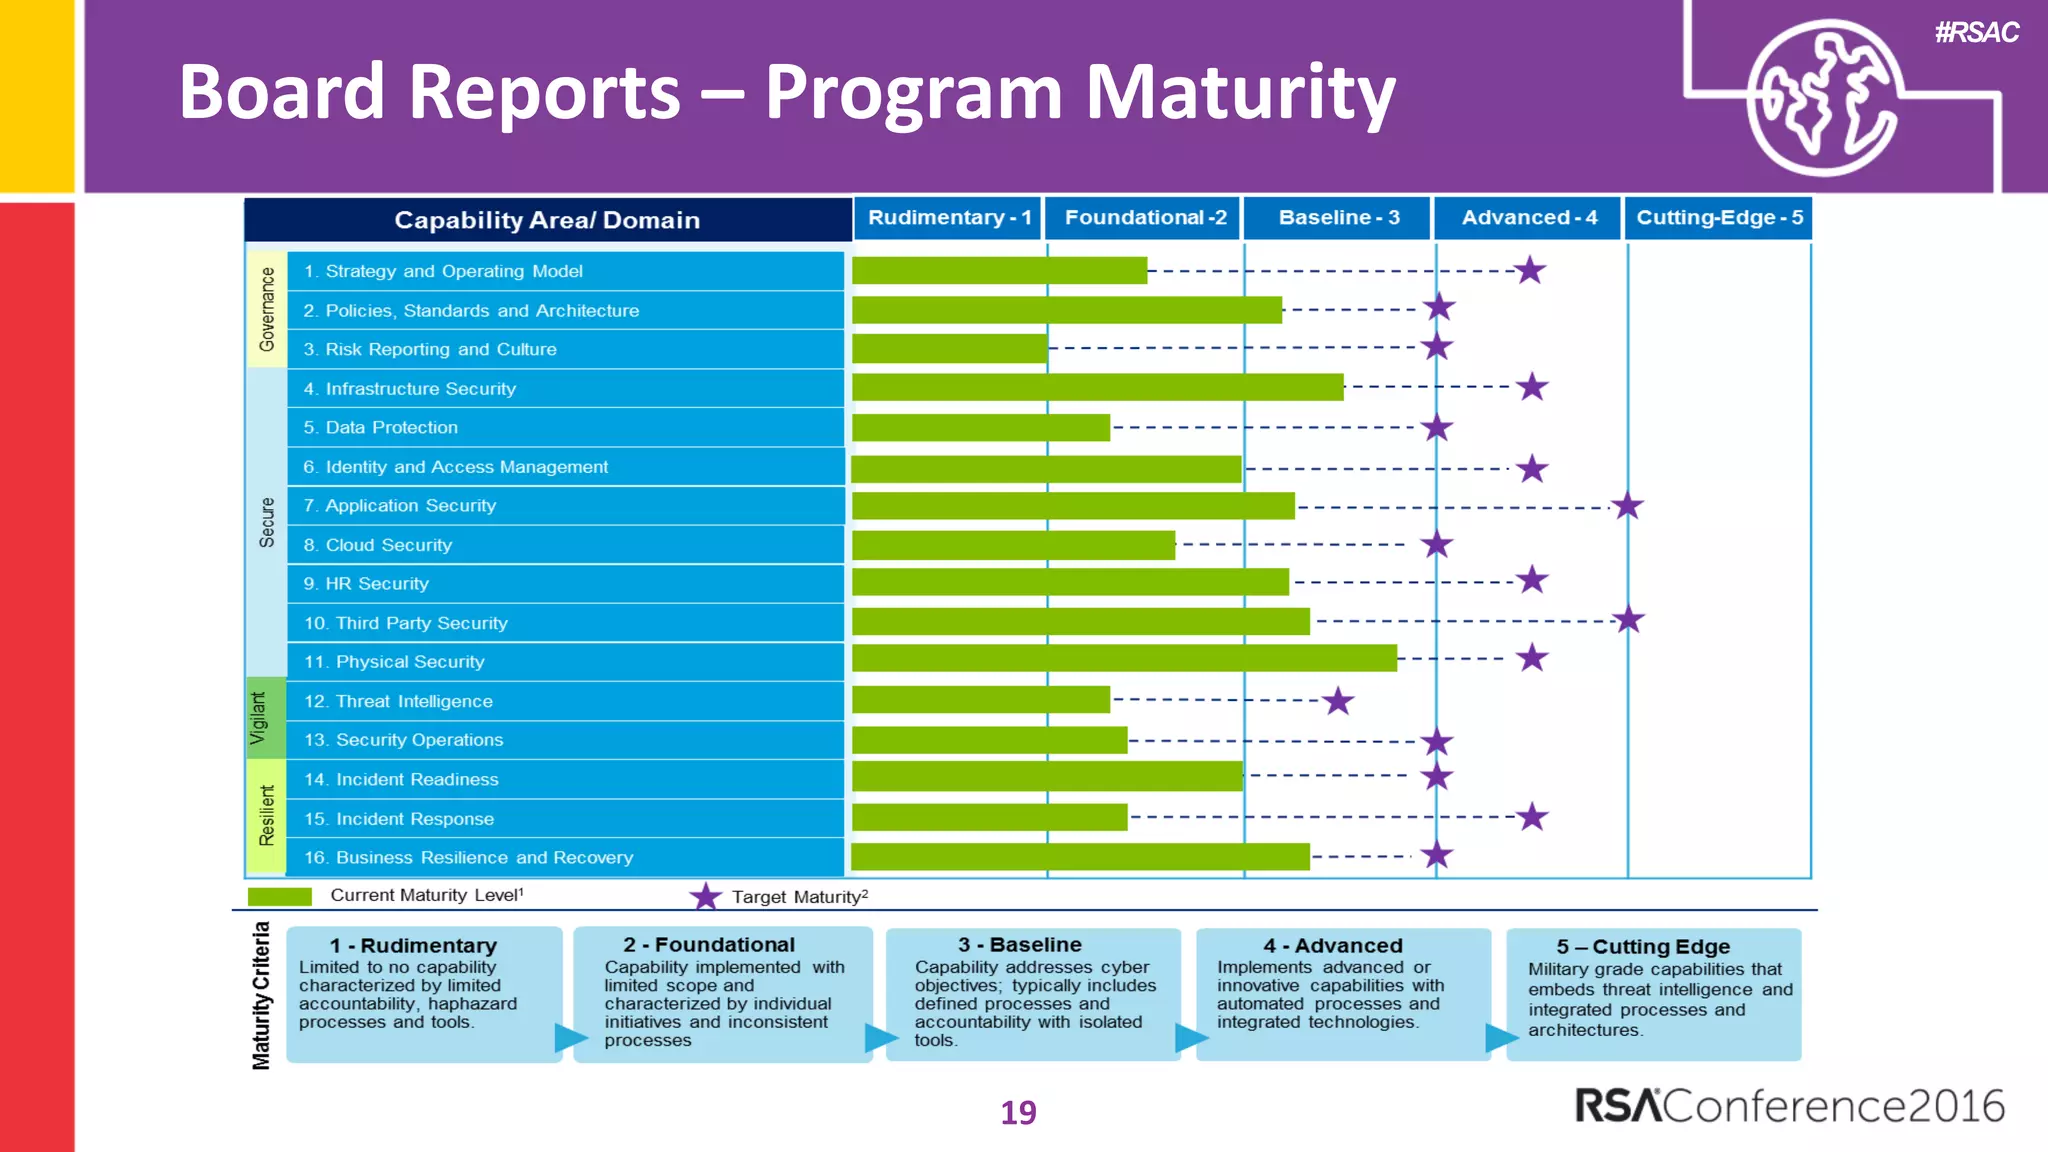
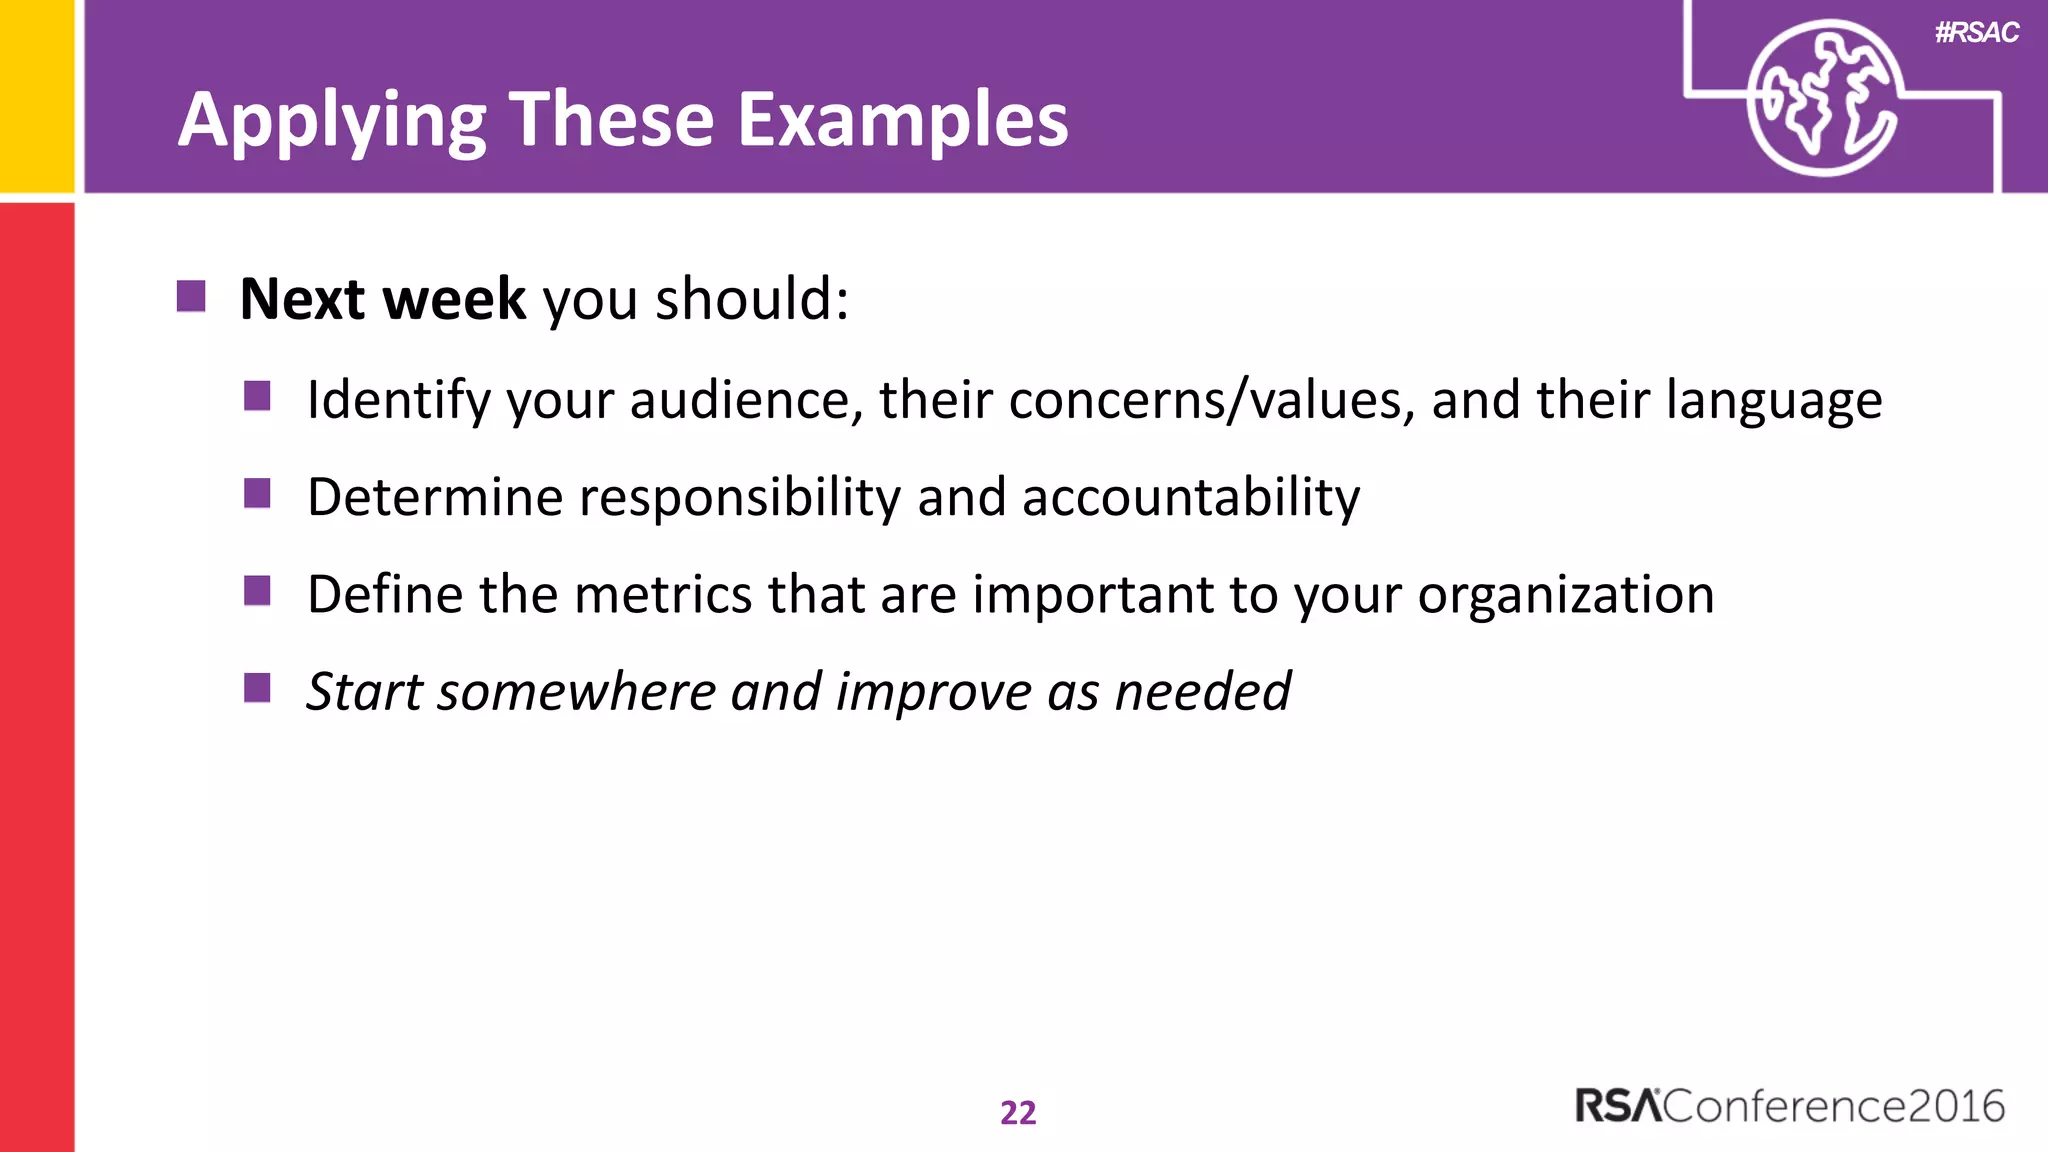
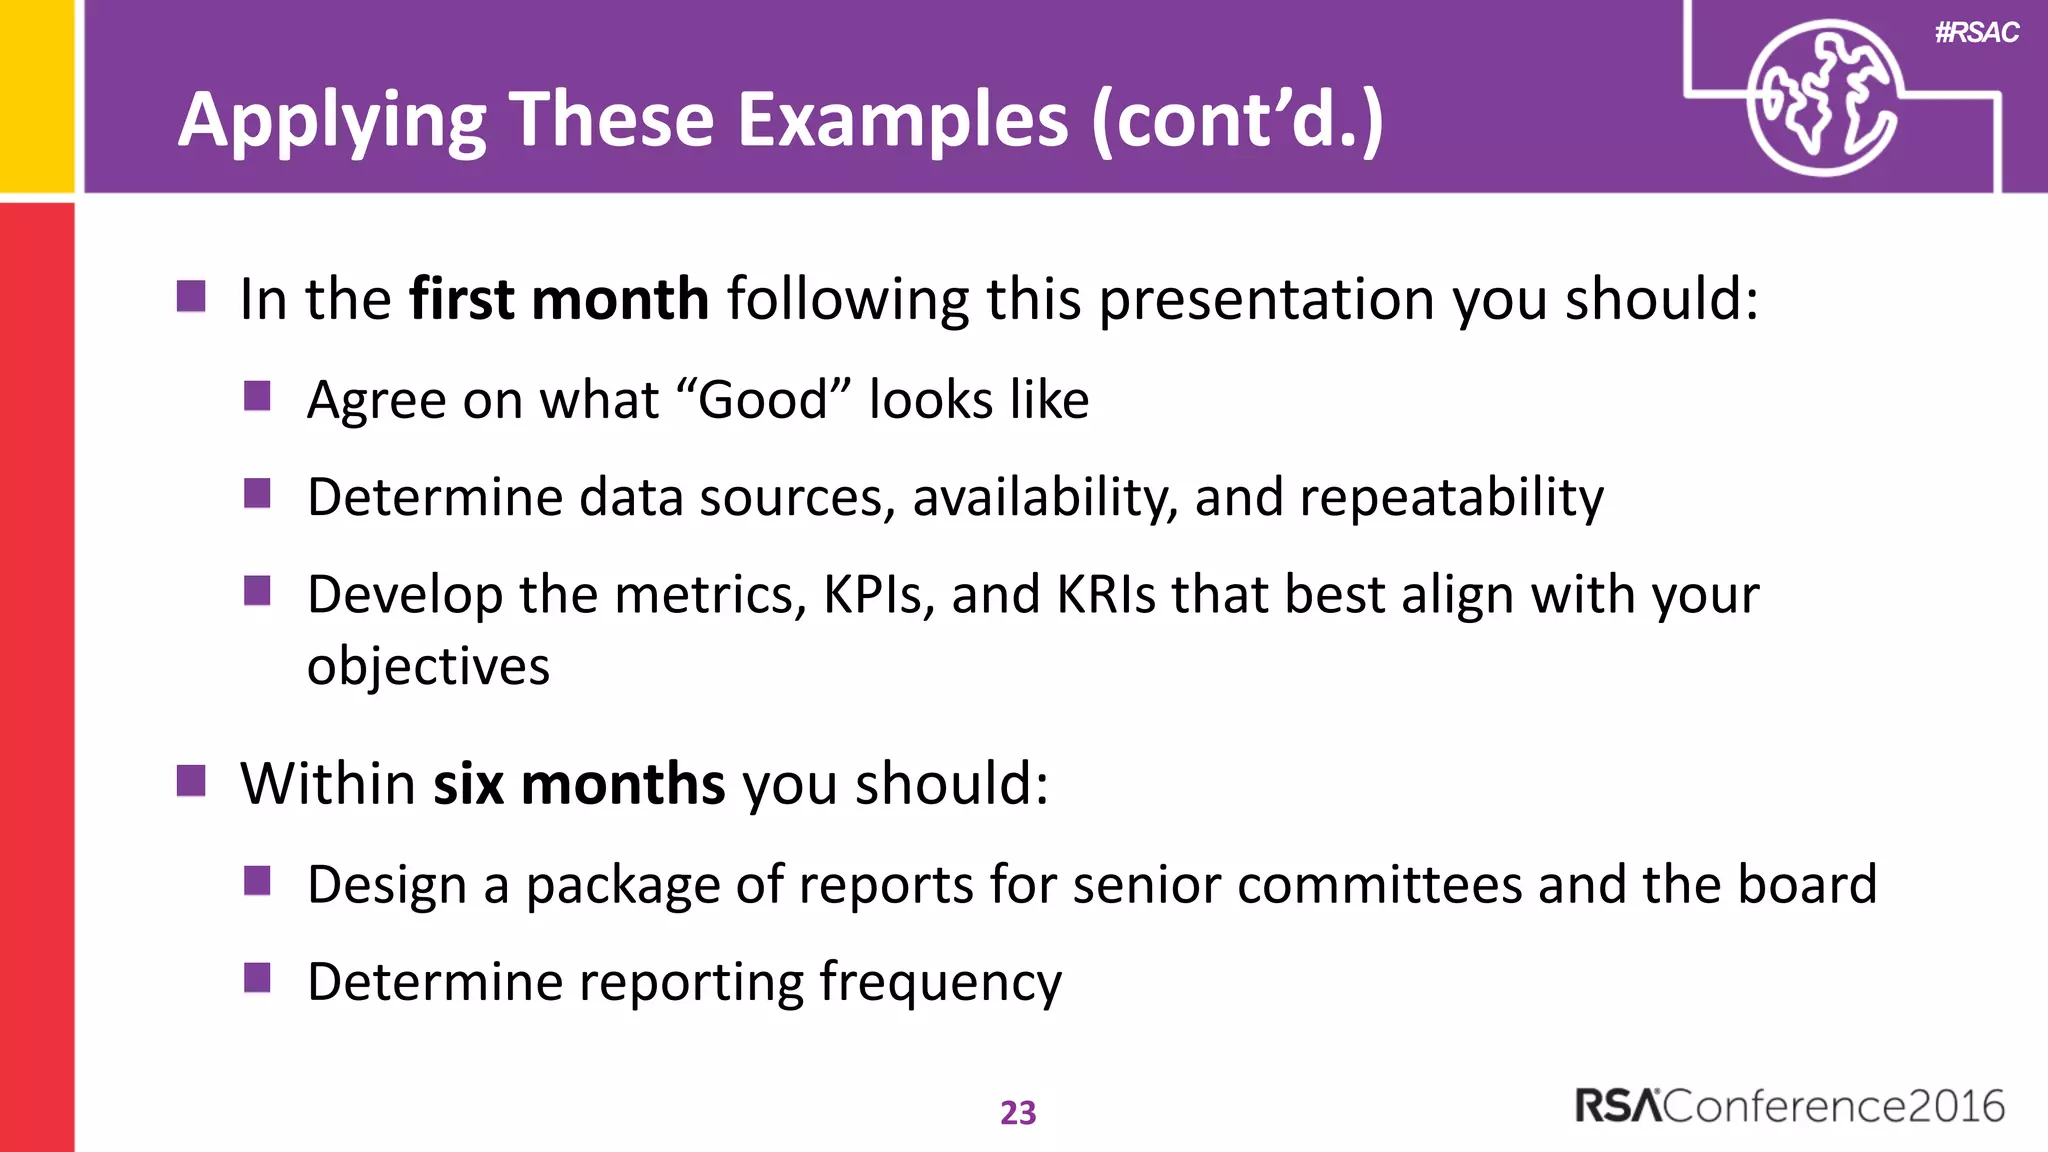

The document discusses examples of security metrics and reports that can be used to measure the effectiveness of a security program and communicate progress to stakeholders. It provides examples of operational reports that include metrics on information security audit issues, antivirus coverage, patching status, and vulnerability management. The document also discusses examples of executive discussions on security metrics and dashboards that can be presented to leadership. Finally, it recommends next steps for applying the reporting examples, such as identifying the audience, determining accountability and important metrics, and developing initial reports to refine over time.


![Coded Agents – with UiPath SDK + LangGraph [Virtual Hands-on Workshop]](https://cdn.slidesharecdn.com/ss_thumbnails/codedagentsdeck-251215155422-5497c599-thumbnail.jpg?width=640&height=640&fit=bounds)


