Downloaded 128 times
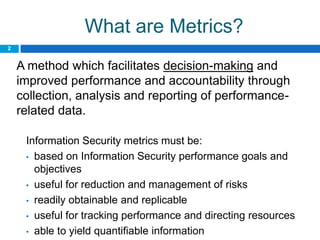
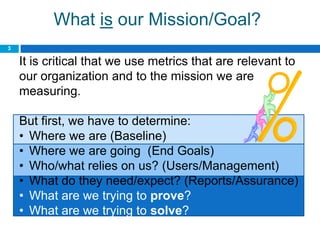
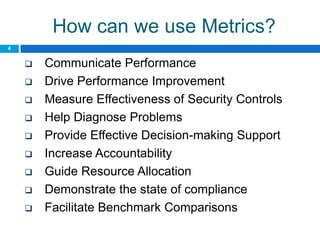
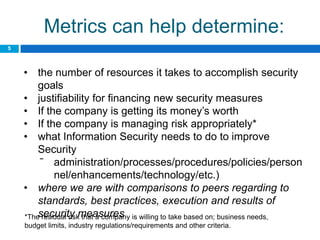

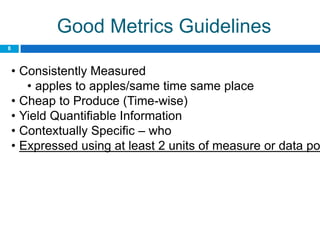
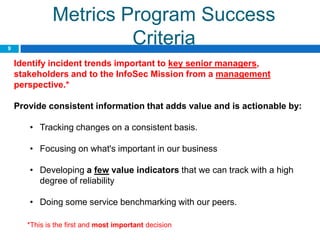
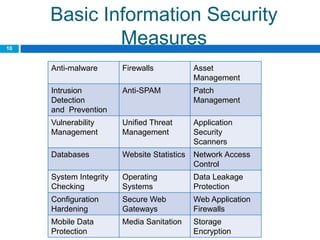
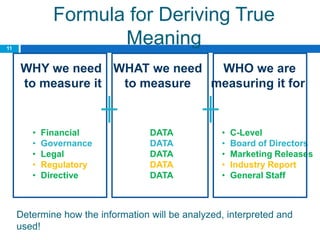
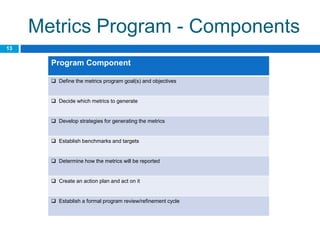
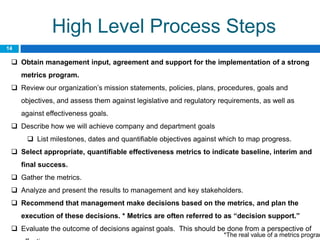
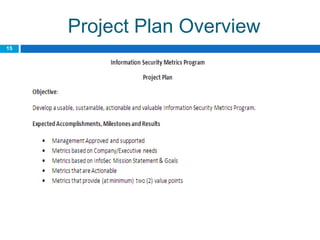
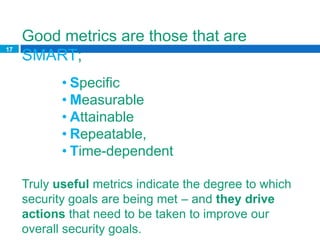

This document provides an overview of security metrics and how to develop an effective security metrics program. It discusses that metrics should be based on security goals and objectives, quantifiable, and useful for improving performance. The document outlines key steps for developing a metrics program including determining goals and baselines, selecting relevant metrics, gathering and analyzing metrics data, and using metrics for decision making and resource allocation. Examples of common security metrics and guidelines for effective metrics are also provided.


