1. Company FundamentalsCompany FundamentalsCompany Profile
A Wright Investors' Service Research Report:
Page Industries Limited.
440 Wheelers Farms Road
Milford, CT 06461 U.S.A.
COMPANY PROFILE
Figures in Indian Rupees
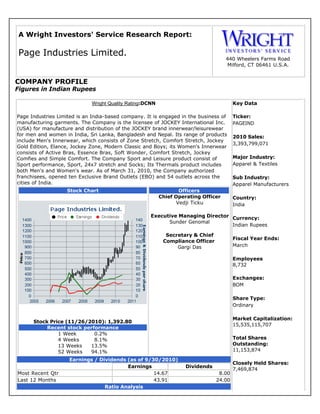
Wright Quality Rating:DCNN Key Data
Page Industries Limited is an India-based company. It is engaged in the business of Ticker:
manufacturing garments. The Company is the licensee of JOCKEY International Inc. PAGEIND
(USA) for manufacture and distribution of the JOCKEY brand innerwear/leisurewear
for men and women in India, Sri Lanka, Bangladesh and Nepal. Its range of products 2010 Sales:
include Men's Innerwear, which consists of Zone Stretch, Comfort Stretch, Jockey
3,393,799,071
Gold Edition, Elance, Jockey Zone, Modern Classic and Boys; its Women's Innerwear
consists of Active Bras, Essence Bras, Soft Wonder, Comfort Stretch, Jockey
Comfies and Simple Comfort. The Company Sport and Leisure product consist of Major Industry:
Sport performance, Sport, 24x7 stretch and Socks; Its Thermals product includes Apparel & Textiles
both Men's and Women's wear. As of March 31, 2010, the Company authorized
franchisees, opened ten Exclusive Brand Outlets (EBO) and 54 outlets across the Sub Industry:
cities of India. Apparel Manufacturers
Stock Chart Officers
Chief Operating Officer Country:
Vedji Ticku India
Executive Managing Director Currency:
Sunder Genomal
Indian Rupees
Secretary & Chief
Fiscal Year Ends:
Compliance Officer
Gargi Das March
Employees
8,732
Exchanges:
BOM
Share Type:
Ordinary
Market Capitalization:
Stock Price (11/26/2010): 1,392.80
15,535,115,707
Recent stock performance
1 Week 0.2%
4 Weeks 8.1% Total Shares
13 Weeks 13.5% Outstanding:
52 Weeks 94.1% 11,153,874
Earnings / Dividends (as of 9/30/2010)
Closely Held Shares:
Earnings Dividends
7,469,874
Most Recent Qtr 14.67 8.00
Last 12 Months 43.91 24.00
Ratio Analysis
3. Company FundamentalsComparative Business Analysis
A Wright Investors' Service Research Report:
Page Industries Limited.
440 Wheelers Farms Road
Provided By CorporateInformation.com Milford, CT 06461 U.S.A.
Wright Comparative Business Analysis Report
Report Date: 11/26/2010
Company Description
Page Industries Limited is an India-based company. It is engaged in the business of manufacturing garments. The
Company is the licensee of JOCKEY International Inc. (USA) for manufacture and distribution of the JOCKEY
brand innerwear/leisurewear for men and women in India, Sri Lanka, Bangladesh and Nepal. Its range of products
include Men's Innerwear, which consists of Zone Stretch, Comfort Stretch, Jockey Gold Edition, Elance, Jockey
Zone, Modern Classic and Boys; its Women's Innerwear consists of Active Bras, Essence Bras, Soft Wonder,
Comfort Stretch, Jockey Comfies and Simple Comfort. The Company Sport and Leisure product consist of Sport
performance, Sport, 24x7 stretch and Socks; Its Thermals product includes both Men's and Women's wear. As of
March 31, 2010, the Company authorized franchisees, opened ten Exclusive Brand Outlets (EBO) and 54 outlets
across the cities of India.
Competitor Analysis
Page Industries Limited. operates in the Men's & boys' underwear & nightwear sector. This analysis compares
Page Industries Limited. with three other companies: K-Lifestyle & Industries Limited (2010 sales of 5.56
billion Indian Rupees [US$125.99 million] of which 100% was Textiles), Pearl Global Limited (2009 sales: 3.87
billion Indian Rupees [US$87.60 million] of which 100% was Readymade Garments), and Birla Cotsyn India
Limited (2010 sales of 3.44 billion Indian Rupees [US$77.92 million] of which 63% was Trading). Note: not all of
these companies have the same fiscal year: the most recent data for each company are being used.
Sales Analysis
Page Industries Limited. reported sales of 3.39 billion Indian Rupees (US$76.87 million) for the fiscal year ending
March of 2010. This represents an increase of 33.3% versus 2009, when the company's sales were 2.55 billion
Indian Rupees. Sales at Page Industries Limited. have increased during each of the previous five years (and since
2005, sales have increased a total of 355%).
Recent Sales at Page Industries Limited.
3.39
2.55
1.92
1.36
1.01
0.75
2005 2006 2007 2008 2009 2010
(Figures in Billions of Indian Rupees)
Page Industries Limited. currently has 8,732 employees. With sales of 3.39 billion Indian Rupees (US$76.87
million) , this equates to sales of US$8,803 per employee. This company's employees do not appear to be very
efficient in generating sales.
Sales Comparisons (Most Recent Fiscal Year)
Year Sales Sales Sales/
Company Ended (blns) Growth Emp (US$) Largest Region
Page Industries Limited. Mar 2010 3.394 33.3% 8,803 India (100.0%)
K-Lifestyle & Industries Limited Mar 2010 5.562 11.0% N/A India (100.0%)
4. Pearl Global Limited Mar 2009 3.868 29.5% N/A India (100.0%)
Birla Cotsyn India Limited Mar 2010 3.440 77.5% N/A India (100.0%)
Recent Stock Performance
For the 52 weeks ending 11/26/2010, the stock of this company was up 94.1% to 1,392.80 Indian Rupees.
During the past 13 weeks, the stock has increased 13.5%. During the 12 months ending 9/30/2010, earnings per
share totalled 43.91 Indian Rupees per share. Thus, the Price / Earnings ratio is 31.72. These 12 month earnings
are greater than the earnings per share achieved during the last fiscal year of the company, which ended in
March of 2010, when the company reported earnings of 35.51 per share. Earnings per share rose 25.2% in 2010
from 2009. Note that the earnings number includes a 0.07 pre-tax charge Mar 2010. This company is currently
trading at 4.58 times sales. This is at a higher ratio than all three comparable companies, which are trading
between 0.08 and 0.16 times sales. Page Industries Limited. is trading at 14.97 times book value. The company's
price to book ratio is significantly higher than that of all three comparable companies, which are trading between
0.16 and 0.79 times book value.
Summary of company valuations
Price/ Price/ 52 Wk
Company Date P/E Book Sales Pr Chg
Page Industries Limited. 11/26/2010 31.7 14.97 4.58 94.10%
K-Lifestyle & Industries Limited 11/26/2010 N/A 0.16 0.16 -21.82%
Pearl Global Limited 8/13/2009 146.4 0.79 0.10 N/A
Birla Cotsyn India Limited 11/26/2010 9.8 0.62 0.08 -2.86%
The market capitalization of this company is 15.54 billion Indian Rupees (US$351.87 million) . Closely held shares
(i.e., those held by officers, directors, pension and benefit plans and those shareholders who own more than 5%
of the stock) amount to over 50% of the total shares outstanding: thus, it is impossible for an outsider to
acquire a majority of the shares without the consent of management and other insiders. The capitalization of the
floating stock (i.e., that which is not closely held) is 5.13 billion Indian Rupees (US$116.22 million) .
Dividend Analysis
During the 12 months ending 9/30/2010, Page Industries Limited. paid dividends totalling 24.00 Indian Rupees per
share. Since the stock is currently trading at 1,392.80 Indian Rupees, this implies a dividend yield of 1.7%. The
company has paid a dividend for 5 straight years. Page Industries Limited. has increased its dividend during each
of the past 3 fiscal years (in 2007, the dividends were 4.37 Indian Rupees per share). During the same 12 month
period ended 9/30/2010, the Company reported earnings of 43.91 Indian Rupees per share. Thus, the company
paid 54.7% of its profits as dividends.
Profitability Analysis
On the 3.39 billion Indian Rupees in sales reported by the company in 2010, the cost of goods sold totalled 2.74
billion Indian Rupees, or 80.6% of sales (i.e., the gross profit was 19.4% of sales). This gross profit margin is
lower than the company achieved in 2009, when cost of goods sold totalled 79.5% of sales. Page Industries
Limited.'s 2010 gross profit margin of 19.4% was better than all three comparable companies (which had gross
profits in 2010 between 7.0% and 9.3% of sales). The company's earnings before interest, taxes, depreciation
and amorization (EBITDA) were 653.20 million Indian Rupees, or 19.2% of sales. This EBITDA to sales ratio is
roughly on par with what the company achieved in 2009, when the EBITDA ratio was 20.2% of sales. The three
comparable companies had EBITDA margins that were all less (between 5.4% and 9.3%) than that achieved by
Page Industries Limited.. In 2010, earnings before extraordinary items at Page Industries Limited. were 396.10
million Indian Rupees, or 11.7% of sales. This profit margin is lower than the level the company achieved in 2009,
when the profit margin was 12.4% of sales. Earnings before extraordinary items have grown for each of the past
5 years (and since 2006, earnings before extraordinary items have grown a total of 248%). The company's return
on equity in 2010 was 45.6%. This was an improvement over the already high 40.9% return the company
achieved in 2009. (Extraordinary items have been excluded).
Profitability Comparison
Gross Earns
Profit EBITDA bef.
Company Year Margin Margin extra
Page Industries Limited. 2010 19.4% 19.2% 11.7%
Page Industries Limited. 2009 20.5% 20.2% 12.4%
5. K-Lifestyle & Industries Limited 2010 N/A 9.3% -0.1%
Pearl Global Limited 2009 7.0% 5.4% 0.2%
Birla Cotsyn India Limited 2010 9.0% 8.2% 2.2%
Inventory Analysis
As of March 2010, the value of the company's inventory totalled 945.50 million Indian Rupees. Since the cost of
goods sold was 2.74 billion Indian Rupees for the year, the company had 126 days of inventory on hand (another
way to look at this is to say that the company turned over its inventory 2.9 times per year). This is an increase
in days in inventory from March 2009, when the company had 679.86 million Indian Rupees, which was only 123
days of sales in inventory. The 126 days in inventory is higher than the three comparable companies, which had
inventories between 24 and 83 days sales at the end of 2010.
Financial Position
As of March 2010, the company's long term debt was 109.09 million Indian Rupees and total liabilities (i.e., all
monies owed) were 1.73 billion Indian Rupees. The long term debt to equity ratio of the company is 0.11. As of
March 2010, the accounts receivable for the company were 263.77 million Indian Rupees, which is equivalent to
28 days of sales. This is an improvement over the end of 2009, when Page Industries Limited. had 35 days of
sales in accounts receivable. The 28 days of accounts receivable at Page Industries Limited. are lower than all
three comparable companies: K-Lifestyle & Industries Limited had 54 days, Pearl Global Limited had 84 days,
while Birla Cotsyn India Limited had 97 days outstanding at the end of the fiscal year 2010.
Financial Positions
LT Debt/ Days Days
Company Year Equity AR Inv.
Page Industries Limited. 2010 0.11 28 126
K-Lifestyle & Industries Limited 2010 0.25 54 47
Pearl Global Limited 2009 0.63 84 83
Birla Cotsyn India Limited 2010 0.55 97 24
Copyright 2001-2010 The Winthrop Corporation
Distributed by Wright Investors' Service, Inc.
All Rights Reserved
Important Legal Notice
THIS REPORT IS PROVIDED FOR GENERAL INFORMATION ONLY, IS NOT TO BE CONSIDERED AS
INVESTMENT ADVICE AND SHOULD NOT BE RELIED UPON FOR INVESTMENT DECISIONS. NO
REPRESENTATION OR WARRANTY IS MADE REGARDING THE ACCURACY, RELIABILITY OR TIMELINESS
OF THE CONTENT. THE REPORTS ARE COMPUTER GENERATED AND MAY BE SUBJECT TO
PROGRAMMATIC AND/OR CONTENT ERRORS. VISITORS SHOULD VERIFY INFORMATION WITH OTHER
RELIABLE SOURCES.
THIS REPORT IS PROVIDED AS IS, WITHOUT WARRANTY OF ANY KIND, EXPRESS OR IMPLIED, INCLUDING
BUT NOT LIMITED TO WARRANTIES OF MERCHANTABILITY, FITNESS FOR A PARTICULAR PURPOSE OR
NON-INFRINGEMENT. IN NO EVENT WILL THE WINTHROP CORPORATION, WRIGHT INVESTORS' SERVICE,
INC. OR ANY OF THEIR DATA PROVIDERS BE LIABLE FOR ANY DIRECT, INDIRECT, SPECIAL OR
CONSEQUENTIAL DAMAGES, NO MATTER WHAT THE CAUSE.
THE CONTENT OF THIS REPORT IS PROTECTED BY APPLICABLE COPYRIGHT LAWS. CONTENT MAY NOT
BE REPRODUCED, DISTRIBUTED, MODIFIED OR FRAMED WITHOUT PRIOR WRITTEN PERMISSION.
16. Financial Statement AnalysesBalance Sheet - Five-Year Averages
Balance Sheet - (5 Year Averages): Page Industries Limited.
Figures in millions of Indian Rupees.
Fiscal Year 2010 2009 2008 2007 2006
Fiscal Year End Date 3/31/2010 3/31/2009 3/31/2008 3/31/2007 3/31/2006
Assets
Total Assets 1,649.7 1,178.2 809.9
Cash & Short Term Investments 87.3 81.5 61.0
Cash 4.3 1.6 0.6
Short Term Investments 83.0 79.8 60.4
Receivables (Net) 160.3 117.5 78.0
Inventories -Total 581.2 432.3 325.4
Raw Materials 221.6
Work in Process 90.7
Finished Goods 245.9
Progress Payments & Other 22.9
Prepaid Expenses 215.4 110.0 41.6
Other Current Assets 40.3 22.3 17.2
Current Assets - Total 1,084.4 763.6 523.2
Long Term Receivables
Investment in Associated
0.0 0.0 0.0
Companies
Other Investments 105.2 99.8 90.0
Property Plant and Equipment -
576.4 390.6 249.2
Gross
Accumulated Depreciation 116.3 75.9 52.4
Property Plant and Equipment –
460.1 314.8 196.8
Net
Other Assets 0.0 0.0 0.0
Deferred Charges 0.0 0.0 0.0
Tangible Other Assets 0.0 0.0 0.0
17. Intangible Other Assets 0.0 0.0 0.0
Total Assets 1,649.7 1,178.2 809.9
Liabilities & Shareholders'
Equity
Total Liabilities & Shareholders'
1,649.7 1,178.2 809.9
Equity
Accounts Payable 142.6 124.6 118.2
Short Term Debt & Current Portion
256.2
of Long Term Debt
Accrued Payroll
Income Taxes Payable
Dividends Payable
Other Current Liabilities 334.1 150.0 90.8
Current Liabilities - Total 856.2 566.3 371.6
Long Term Debt 88.7 93.2 84.3
Long Term Debt Excluding
87.1 91.7 83.1
Capitalized Leases
Capitalized Lease Obligations 1.6
Provision for Risks and Charges
Deferred Income 0.0 0.0 0.0
Deferred Taxes 14.6 13.1 11.8
Deferred Taxes - Credit 21.5 17.3 13.8
Deferred Taxes - Debit
Deferred Tax Liability in Untaxed
Reserves
Other Liabilities 0.0 0.0 0.0
Total Liabilities 962.8 675.9 471.0
Non-Equity Reserves 0.0 0.0 0.0
Minority Interest 0.0 0.0 0.0
Preferred Stock 0.0 0.0 0.0
Preferred Stock Issued for
ESOP
25. Financial Statement AnalysesSources of Capital - Net Change
Sources of Capital: Page Industries Limited.
Currency figures are in millions of Indian Rupees.
Year to year % changes pertain to reported Balance Sheet values.
Fiscal Year 2010 2009 2008 2007 2006
Fiscal Year End Date 3/31/2010 3/31/2009 3/31/2008 3/31/2007 3/31/2006
Total Capital 1,099.4 1,019.2 866.7 751.9 140.8
Percent of Total Capital
Short Term Debt 39.9% 26.3% 32.2% 23.8% 82.6%
Long Term Debt 9.9% 14.8% 10.7% 9.9% 11.1%
Other Liabilities 0.0% 0.0% 0.0% 0.0% 0.0%
Total Liabilities 157.6% 123.1% 111.3% 70.9% 233.3%
Minority Interest 0.0% 0.0% 0.0% 0.0% 0.0%
Preferred Stock 0.0% 0.0% 0.0% 0.0% 0.0%
Retained Earnings
Common Equity 90.1% 85.2% 89.3% 90.1% 88.9%
Total Capital 100.0% 100.0% 100.0% 100.0% 100.0%
Year to Year Net Changes
Short Term Debt 17.0 -1.1 10.0 6.2
Long Term Debt -4.2 5.8 1.8 5.9 -11.6
Other Liabilities 0.0 0.0 0.0 0.0 0.0
Total Liabilities 47.8 29.0 43.1 20.5 3.0
Minority Interest 0.0 0.0 0.0 0.0 0.0
Preferred Stock 0.0 0.0 0.0 0.0 0.0
Retained Earnings
Common Equity 12.2 9.4 9.7 55.2 5.8
Total Capital 8.0 15.2 11.5 61.1 -5.8
Year to Year Percent Changes
Short Term Debt 63.5% -3.9% 56.3% 53.6%
Long Term Debt -27.7% 62.4% 24.5% 377.8% -88.1%
Other Liabilities
31. Financial Ratio AnalysesLeverage Analysis
Leverage Analysis: Page Industries Limited.
Fiscal Year 2010 2009 2008 2007 2006
Fiscal Year End Date 3/31/2010 3/31/2009 3/31/2008 3/31/2007 3/31/2006
Long Term Debt % of EBIT 17.9% 29.9% 25.0% 26.9% 8.4%
Long Term Debt % of EBITDA 15.6% 26.1% 22.8% 25.5% 8.0%
Long Term Debt % of Total Assets 4.0% 7.1% 5.3% 6.2% 3.4%
Long Term Debt % of Total Capital 9.9% 14.8% 10.7% 9.9% 11.1%
Long Term Debt % of Com Equity 11.0% 17.4% 12.0% 11.0% 12.5%
Total Debt % of EBIT 89.7% 83.1% 99.9% 91.2% 70.9%
Total Debt % of EBITDA 78.2% 72.5% 91.1% 86.4% 67.8%
Total Debt % of Total Assets 20.1% 19.7% 21.4% 20.9% 29.1%
Total Debt % of Total Capital 49.8% 41.1% 42.9% 33.7% 93.7%
Total Debt % of Total Capital &
35.6% 32.6% 32.5% 27.2% 51.3%
Short Term Debt
Total Debt % of Common Equity 55.3% 48.3% 48.1% 37.4% 105.4%
Minority Interest % of EBIT 0.0% 0.0% 0.0% 0.0% 0.0%
Minority Interest % of EBITDA 0.0% 0.0% 0.0% 0.0% 0.0%
Minority Interest % of Total Assets 0.0% 0.0% 0.0% 0.0% 0.0%
Minority Interest % of Total Capital 0.0% 0.0% 0.0% 0.0% 0.0%
Minority Interest % of Com Equity 0.0% 0.0% 0.0% 0.0% 0.0%
Preferred Stock % of EBIT 0.0% 0.0% 0.0% 0.0% 0.0%
Preferred Stock % of EDITDA 0.0% 0.0% 0.0% 0.0% 0.0%
Preferred Stock % of Total Assets 0.0% 0.0% 0.0% 0.0% 0.0%
Preferred Stock % of Total Capital 0.0% 0.0% 0.0% 0.0% 0.0%
Preferred Stock % of Total Equity 0.0% 0.0% 0.0% 0.0% 0.0%
Common Equity % of Total Assets 36.4% 40.9% 44.5% 55.9% 27.6%
Common Equity % of Total Capital 90.1% 85.2% 89.3% 90.1% 88.9%
Total Capital % of Total Assets 40.4% 48.0% 49.9% 62.1% 31.0%
Capital Expenditure % of Sales 7.3% 12.0% 12.0% 10.3% 3.3%
33. Financial Ratio AnalysesLiquidity Analysis
Liquidity Analysis: Page Industries Limited.
Fiscal Year 2010 2009 2008 2007 2006
Fiscal Year End Date 3/31/2010 3/31/2009 3/31/2008 3/31/2007 3/31/2006
Total Current Assets % Net Sales 55.1% 55.1% 52.1% 60.7% 32.1%
Cash % of Current Assets 0.7% 0.4% 0.1% 0.1% 0.1%
Cash & Equivalents % of Current
1.6% 7.3% 0.2% 36.6% 0.1%
Assets
Quick Ratio 0.2 0.3 0.2 0.9 0.2
Receivables % of Current Assets 14.1% 17.4% 14.2% 10.2% 20.6%
Receivable Turnover - number of
27.3 27.7 21.5 20.3 21.1
days
Inventories % of Current Assets 50.6% 48.5% 62.9% 49.3% 75.0%
Inventory Turnover - number of
108.4 118.2 121.9 109.2 98.9
days
Inventory to Cash & Equivalents -
11.2 54.5 1.0 267.0 0.4
number of days
Receivables % of Total Assets 9.7% 11.5% 8.2% 7.0% 14.7%
Current Ratio 1.2 1.3 1.2 1.8 1.1
Total Debt % of Total Capital 35.6% 32.6% 32.5% 27.2% 51.3%
Funds from Operations % of
30.4% 35.9% 33.5% 42.4% 41.1%
Current Liabilities
Funds from Operations % of Long
447.4% 258.4% 303.9% 255.5% 779.3%
Term Debt
Funds from Operations % of Total
89.1% 93.1% 75.9% 75.3% 92.3%
Debt
Funds from Operations % of Total
44.4% 38.3% 32.6% 25.4% 86.5%
Capital
Cash Flow (in milllions of Indian
Rupees)
Operating Activities 283.0 333.5 109.7 78.1 92.0
Financing Activities -135.2 -174.7 -22.9 493.8 -55.2
Investing Activities 221.3 57.6 387.0 270.3 36.9