Smallholders’ agriculture at the tropical forest margin in cameroon opportunities for a landscpe approach to promote agroforestry
•Download as PPTX, PDF•
2 likes•1,157 views


Recommended
Recommended
More Related Content
What's hot
What's hot (20)
Viewers also liked
Viewers also liked (12)
Similar to Smallholders’ agriculture at the tropical forest margin in cameroon opportunities for a landscpe approach to promote agroforestry
Similar to Smallholders’ agriculture at the tropical forest margin in cameroon opportunities for a landscpe approach to promote agroforestry (20)
More from World Agroforestry (ICRAF)
More from World Agroforestry (ICRAF) (20)
Recently uploaded
Recently uploaded (20)
Smallholders’ agriculture at the tropical forest margin in cameroon opportunities for a landscpe approach to promote agroforestry
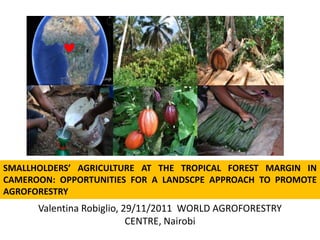
- 1. SMALLHOLDERS’ AGRICULTURE AT THE TROPICAL FOREST MARGIN IN CAMEROON: OPPORTUNITIES FOR A LANDSCPE APPROACH TO PROMOTE AGROFORESTRY Valentina Robiglio, 29/11/2011 WORLD AGROFORESTRY CENTRE, Nairobi
- 2. BIO-PRESENTATION v.robiglio@cgiar.org Forest landscape ecologist at IITA partner in the ASB platform Research subject: analysis of land use systems at the humid tropical forest margin. Implications for livelihoods, carbon sequestration and biodiversity. Key words: smallholder farmers, shifting cultivation, land use trajectories, deforestation and forest degradation, tree based mitigation (REDD+/REALU) and adaptation strategies
- 3. CAMEROON Population: 19.5 M, 42% rural, urbanization Dense tropical forest : 3.4%, variation across regions 7.5 p/Km2 Est, 12.5 PFD 12M ha protected 4.5M p/Km2 South; production 7.5 Economy: GDP 44 billions $, agriculture 20% GDP – NPFD 5M ha liable to conversion labor force 70%; Export: oil, lumber and cocoa Deforestation rate: 1.1% Dense humid forest: 16.5 M ha Major driver of deforestation small-scale agriculture REDD+
- 4. THE LAND USE MOSAIC AT THE FOREST MARGIN Fallow Units and secondary forests 4 M ha Annual crops 900 t ha Cocoa Agro-forests 500 t ha
- 5. DEFORESTATION In much of CA and WA the expansion of agriculture by small-holder farmers is a leading driver of deforestation; Nutrients in the plant biomass are mined by agricultural households employing slash and burn; The same households depend on stock of wild food, fuelwood, and traditional medicines which are produced by the forest they cut down and burn in their agricultural practices; Fallows and agroforests provide environmental services such as biodiversity conservation and carbon stock =>mitigation of deforestation.
- 6. LANDSCAPE CONCEPT AND LANDSCAPE APPROACH Production Ecosystem services Biodiversity Institutions Carbon sink and sequestration Livelihoods strategies policy System resilience Landscapes: spatially heterogeneous geographic areas characterized by diverse interacting patches or ecosystems Landscape approach is necessary to deal at the same time with production, biodiversity, ecosystem services and functions, livelihoods strategies, policy and institutions across scales. That approach is particularly valuable to create an understanding in the complex (competing) interrelationships between resource use and users across scales.
- 7. BEYOND THE UNDERSTANDING OF LAND USE /LAND COVER CHANGE What are the implications of LULC on local and global environmental services provided by landscapes? Are LULC changes indicator of agricultural change? (e.g. a change in the social asset, or technology…) What are the entry points for AFS once adopting a landscape approach? Comparison of HH data for 1996-2011 in AWAE
- 8. impact of combined agricultural expansion/deforestation and intensification processes on the potential for biodiversity conservation in shifting cultivation landscapes What are the current trends in the agricultural mosaics and how do they affect forest species regeneration capacity and conservation potential of the mosaics? 1) What factors do control species regeneration (fallows)? 2) What are the factors that shape LULC at the local scale and how do they operate? Robiglio V., Sinclair F.L. (2011). Maintaining the Conservation Value of Shifting Cultivation Landscapes Requires Spatially Explicit Interventions. Environmental Management . 48(2): 289-306.
- 9. impact of combined agricultural expansion/deforestation and intensification processes on the landscape structure potential for biodiversity conservation in shifting cultivation landscapes Shifting cultivation landscapes are complex fragmented landscapes: Complexity results from the dynamics within the non-forest agricultural matrix and from the linked process of forest loss and recovery in fallows. PLOT LEVEL TRAJECTORIES LANDSCAPE LEVEL OUTCOME
- 10. impact of combined agricultural expansion/deforestation and intensification processes on the potential for biodiversity conservation in shifting cultivation landscapes •Focus Group RRA •Participatory GIS mapping to define territory/landscape scale on the base of land resources management; •RS fine grained monitoring of transition and modification of LC classes; •Analysis of forest fragmentation and agricultural expansion (FRAGSTATS) Nkometou Core Area Herbaceous land Shrubland Grassland herbaceous 100 1951 2001 1951 2001 1951 2001 80 60 Nkometou 40 %of class’ land 43.6 65.7 58.3 49.1 68.9 67.8 20 Core areas per patch 1.4 1.8 1.5 1.4 1.2 1.3 0 Mean core area 1.4 12.7 3.7 1.9 5.8 9.7 1951 2001 1951 2001 1951 2001 Median core area 0.6 1.1 1.1 0.9 2.3 2.2 Core area range 7.1 449.5 42.0 25.8 45.0 44.8 shb hb gr_hb hb shb frF_agr fr_mlF mlf dhf gr_hb gr
- 11. impact of combined agricultural expansion/deforestation and intensification processes on the potential for biodiversity conservation in shifting cultivation landscapes Plot level trees species richness and diversity assessment per land use type factors affecting the pattern of abundance of woody species: -Plot level factors : the land use, weeds layer, the density of un- felled trees, age -Landscape factors: mature vegetation, forest , matrix. 1. test of the influence of plot and landscape sets using RDA 2. significant sets arranged in a hierarchy, on the basis of a variance partitioning procedure.
- 12. impact of combined agricultural expansion/deforestation and intensification processes on the potential for biodiversity conservation in shifting cultivation landscapes Results Species regeneration: 1) The type of agricultural matrix in which the fallows are embedded, the degree of adjacency to mature vegetation and the distance from the forest have the highest impact on forest species distribution in the regenerating fallows. Land Use / Land Cover change: 1) Agricultural patches are expanding and merging; 2) Remnant forest patches are shrinking and increasingly isolated; 3) Within the agricultural matrix the proportion cropped at any time is increasing, as well as the frequency and size of short fallow patches; 4) Fallow plots are increasingly scattered throughout the agricultural matrix and isolated from one another and the remaining forest => loss of fallow functions and degradation of the agricultural matrix
- 13. impact of combined agricultural expansion/deforestation and intensification processes on the potential for biodiversity conservation in shifting cultivation landscapes Implications: Methodological: 1. Analytical frameworks of forest fragmentation and conservation at the tropical forest margin should integrate the processes that control secondary forest recovery within the agricultural matrix: the intensity, persistency and spatial pattern of the agricultural disturbances. Landscape management: 1. Non-forest matrix provides required conditions in the absence of forest; 2. With the loss of fallow functions, scattered trees, live fences, multistrata cocoa, home gardens and small degraded forest spots that farmers maintain, become the foci of conservation and dispersal of forest species; 3. Spatial distribution matters!
- 14. factors influencing farmers land use decision making in the villages functional territories Robiglio V., Mala W.A. and Diaw M.C. (2003) Mapping landscapes: Integrating GIS and social science methods to model human-nature relationships in Southern Cameroon. Small-Scale Forestry Volume 2, Number 2, 171-184.
- 15. What are the implications of landscape change on the local and global environmental services? •12 villages HH surveys + Focus groups for LUC Drivers, Resources Management, income, landholdings •6 villages for carbon and trees biodiversity assessment , GPS-LU mosaic mapping, land use trajectories and profitability analysis •LULC analysis over 2001-2007 based on Landsat and Aster img.
- 16. What are the implications of landscape change on the local and global environmental services? data collection • 173 Plots • LUTs: Degraded forest Logged forest Secondary forest Fallows Cocoa farms Trees dbh > 5cm, measured and identified +understory, litter, dead trees • Allometric equation adopted: AGB = ρ * EXP {-1.499 + [2.148 * LN(DBH)] + [0.207 * LN(DBH)] 2 – [0.0281 * LN(DBH)] 3} Chave et al. (2005) AGB = aboveground biomass in kg/tree ρ = wood density g/cm3 EXP = ―e‖ to the power of DBH = diameter at breast height in cm
- 17. What are the implications of landscape change on the local and global environmental services? preliminary results 1. LULC 2001/2007 : Clusters of local landscape changes allow identifying typical landscapes of shifting cultivation, settled areas with more stable agriculture, and areas with net deforestation, how these are distributed in space and how they relate to pattern of identified drivers. Within a dynamic landscape with high percentages of LU changes, the aggregated proportion of forest is stable but there are contrasting local dynamics ;
- 18. What are the implications of landscape change on the local and global environmental services? preliminary results 2. Land Use Mosaic: Perennial crops Slash and Burn systems Traditional Shaded Cocoa Oil Palm-small scale Forest fields (Essep ) M ixed Foodcrop M onoculture Foodcrops % of land 9.70% 4.30% 8.20% 3.40% 0.10% S (ha) 0.6 3.4 0.6 0.13 0.19 *Data for 1 site Fallow land is the main component of the land use mosaic
- 19. What are the implications of landscape change on the local and global environmental services? Land Use System Change Carbon stock distribution General trends of Change reported by the farmers in sites with good market acces: 1) Increase of number of fields by HH, in particular under short intercrop systems : introduction of mono-cultural crops 2) Increase of average fields surface in particular for forest farms 3) Decrease of remnant trees left during field preparation both for mixed food crops and in cocoa farms DEGRADATION of the RURAL MOSAIC
- 20. What are the implications of landscape change on the local and global environmental services? preliminary results 3. Carbon and species diversity indicators Carbon/tree species diversity correlate significantly across the land use types considered (R, Pearson 0.748; SW, Pearson 0.663, p<0.001) Carbon /tree species diversity correlate for non- pioneer and late/shade bearer species in fallow intercrop degraded forest (R, Pearson 0.64, p<0.01). late/shade bearer species show the clearest pattern with C stock both for fallows and degraded forest
- 21. What are the entry points for AFS? On –farm timber production a flourishing domestic timber sector… 3.0 Millions m3 2.0 1.0 Robiglio, V. et al. 2011.From farmers to loggers: understanding the role of 0.0 the rural land for timber production 2000 2005 2010 in Cameroon. Submitted to a special Official production SSL informal production issue of Small Scale Forestry . Robiglio, V. et al. ASB PolicyBrief23 On-farm timber production Once SSL production is included the overall for emission reduction with value of national timber production doubles! sustainable benefits at the tropical forest margins. 21
- 22. What are the entry points for AFS? On –farm timber production …targets a handful of species harvested … Five species made about 75% of total sales in Yaounde. Ayous is the most largely commercialised Important commercial species are harvested more in the NPFD Source: Cerutti and Lescuyer 2010 22
- 23. What are the entry points for AFS? On –farm timber production …in the agricultural land use units 23
- 24. What are the entry points for AFS? On –farm timber production What are on-farm trees in the rural mosaic? Farmers traditionally maintained selected forest species on their farms 1. increase crop productivity (e.g. enhancement of soil fertility, of nutrient cycling, management of light and moisture, protection from wind); 2. provide valuable products (food, medicines, construction timber, fuel wood etc.) for household consumption and income diversification. !! On-farm trees in Cameroon are not managed by farmers for timber production. !! SSL benefits of a stock of trees that were preserved by farmers for reasons other than timber production
- 25. What are the entry points for AFS? On –farm timber production Towards an assessment of the opportunity to develop management options for the on-farm timber stock Are there significant variations in tree species distribution in the different land use systems? What are the factors influencing trees species distribution? How will the evolution of agricultural land use systems affect future timber production? Can timber production from farmland become a livelihood option for smallholders? 25
- 26. What are the entry points for AFS? On –farm timber production Results: Farmland timber Stock and species About 49 over 51 commercial species inventoried. The most abundant were the Pioneers and Non Pioneer Light Demanding Species; Larger volumes and higher density values were found in the Nkolabang, intensively cultivated, short rotations are dominant, high population fallow units (medium and old) pressure and for secondary species, Trees density varied across sites; Within sites trees density varied across Land Use Units; ANOVA of average density per LUT was significant only for one species in one site (Iroko, F=2.79, Mevo Mevo, medium and long fallow rotations are dominant, low population pressure p=0.026). 26
- 27. What are the entry points for AFS? On –farm timber production Other results P and NPLD species regenerate and grow in fallow based and permanent tree crop systems Density depends on the type of LUT, the length of the fallow rotation and on the species There is a high potential to promote secondary species in particular in the fallow units Agricultural expansion and intensification coupled to logging is rapidly reducing the availability of farmland trees >> need for intervention to avoid timber shortage
- 28. What are the entry points for AFS? On –farm timber production Analysis of barriers Tenure and use right restriction In particular the prohibition to sell, that is the impossibility of fully benefit of their use right on trees growing on their customarily owned land is perceived as a barrier to get involved in planting and better managing timber trees. Tenure insecurity becomes an issue in relation to the time needed by the trees to grow and become exploitable. Low profitability Farmers feel they have a low power of negotiation and get low returns for a valuable product. Not aware of the economical value of the timber they consider the low price justified by the lack of investment in production. Technical restrictions: lack of management skills and information Farmers’ knowledge about managing timber trees regeneration and growth is limited to very basic techniques and fully depend on natural regeneration.
- 29. What are the entry points for AFS? On –farm timber production Opportunities and the way forwards There is potential for indigenous timber species to be associated with smallholder crop production. Natural regeneration should be integrated by domestication and planting with the development of related technical protocols. Farmers’ knowledge about tree management and tree properties should be complemented with technical knowledge on crop-trees complementation. Adapted management units should be identified and inventory and monitoring systems developed. The system has to be integrated in the design of agricultural intensification options considering spatial distribution. Main barriers such as lack of rights and delayed benefits to farmers should be addressed with benefit sharing mechanisms that favor short term payback and market information systems on domestic and international timber prices, to increase farmers’ awareness of timber value. In the long term, reforms to reinforce tree ownership by farmers, and control over timber resources.
- 30. THANK YOU VERY MUCH FOR YOUR ATTENTION !!!! MERCI!!!! GRAZIE!!! ASANTE SANA!!!!
- 31. LULC: DEGRADATION AND AGRICULTURAL INTENSIFICATION Complex mosaics evolve from tree-rich to tree-poor systems vertical: cocoa agroforests horizontal: shortening of fallows and expansion of homogeneous agricultural matrices; Fine grained mosaic dynamics are difficult to monitor... and not considered in general debate about tropical deforestation / degradation and land use change;
- 32. trees species richness and diversity assessment per land use type factors affecting the pattern of abundance of woody species: 1. test of the influence of plot and landscape sets using RDA 2. significant sets arranged in a hierarchy, on the basis of a variance partitioning procedure
- 33. preliminary results 3. Carbon and species diversity indicators • Mature Cocoa farms and Long fallow intercrop stock a high amount of carbon • Cocoa and Long fallow intercrop present high tree species diversity values Land USE Carbon T/ha Diversity cocoa1 55.07 0.23 cocoa2 99.21 0.37 cocoa3 93.63 0.37 cocoa4 115.94 0.36 YF 34.43 0.14 MF 41.57 0.18 OF 101.47 0.41 SF 130.81 0.41 LF 152.91 0.54 DF 204.81 0.57
- 34. ANY ROLE for REDD+ in small-holder farmers context? Depends on what is eligible and on the adopted national forest definition. CARBON ENHANCEMENT (RESTORATION) and AVOIDED DEFORESTATION in identified priority areas Cameroon National forest definition "Forest is a tract of land with a minimal surface of 0.1 hectare, with tree canopy cover of more than 30% (or with an equivalent stand density). The trees or woody vegetation should be able to reach a minimum height of 5 m.”
- 35. methodological challenges for the next steps • Coupled biodiversity inventory and carbon stock measurement • Uncertainty in carbon estimates due to lack of suitable allometric equations • What biodiversity and which indicator or combination of indicators are suitable? • At what spatial scale?
Editor's Notes
- Cameroon lie at the nexus of two of the most pressing concerns for a globally sustainable future. First future food demand is projected to increase by at least 50% by 2050 in response to population growth and increase of consumption level per capita. Improving agricultural productivity in the tropics is critical to meet this demand as well as to alleviate chronic food insecurity currently affecting nearly 1 billion undernourished people. Insert Sustainability - The second pressing concern is the need to reduce atmospheric concentration of greenhouse gases to address climate change (that is progressively affecting agriculture) (De Fries et al. 2010).
- Insert ICRAF logo
- The most updated and authoritative data on land cover in Cameroon are the one of the State of the Forest 2008 (de Wasseige et al. 2009) provided by the OFAC that compared to other data have a better mapped the forest /non forest margin (de Wasseige et al. 2009). The humid forest occupies about 16.5 M hectares of the humid forest eco-zone. In the same zone the rural complex, the fine grained rural mosaic made of fields, fallows, secondary forests plantations agro-forests and remnants of the original forests occupies 4.3 M ha.
- What are the implications of landscape change on the environmental services provided to smallholder farmers?Is landscape change the sign of a real change? (e.g. a change in the social asset, or technology)
- The landscape scale corresponded to functionalterritories of villages (the area utilizable by the village). Spatial information on landcover, path networks, access rights and tenure was collected by integratingParticipatory Mapping with GIS. GIS models of land rights indicated a nestedconfiguration of social accessibility with land endowments by kin-groups presenting ahigh heterogeneity in terms of area and physical accessibility. Even in contextswhere land was abundant spots of high population pressure occured because ofdifferences in land endowments.
- Fallow vegetation within landscapes dominated by shifting cultivation represents a woody species pool of critical importance with considerable potential for biodiversity conservation. Here, through the analysis of factors that influence the early stages of fallow vegetation regrowth in two contrasting forest margin landscapes in Southern Cameroon, we assessed the impact of current trends of land use intensification and expansion of the cultivated areas, upon the conservation potential of shifting cultivation landscapes. We combined the analysis of plot and landscape scale factors and identified a complex set of variables that influence fallow regrowth processes in particular the characteristics of the agricultural matrix and the distance from forest. Overall we observed a decline in the fallow species pool, with composition becoming increasingly dominated by species adapted to recurrent disturbance. It is clear that without intervention and if present intensification trends continue, the potential of fallow vegetation to contribute to biodiversity conservation declines because of a reduced capacity, (1) to recover forest vegetation with anything like its original species composition, (2) to connect less disturbed forest patches for forest dependent organisms. Strategies to combat biodiversity loss, including promotion of agroforestry practices and the increase of old secondary forest cover, will need not only to operate at a landscape scale but also to be spatially explicit, reflecting the spatial pattern of species reservoirs and dispersal strategies and human usage across landscapes.
- quantification of landscape composition and configuration
- Fallow vegetation is increasingly dominated by species adapted to disturbance, forest species richness and abundance are decreasing;
- Non-forest matrix plays a critical role in the recruitment and establishment processes of woody species, providing required conditions in the absence of forest. This implies the need for spatially explicit land use planning, along the hierarchy of systems (farm, household, community) …but we are still very far from achieving this and, at the same time, guarantee to farmers the supply of the products they need.
- The landscape scale corresponded to functional territories of villages (the area utilizable by the village). Spatial information on land cover, path networks, access rights and tenure was collected by integrating Participatory Mapping with GIS. GIS models of land rights indicated a nestedconfiguration of social accessibility with land endowments by kin-groups presenting ahigh heterogeneity in terms of area and physical accessibility. Even in contextswhere land was abundant spots of high population pressure occurred because ofdifferences in land endowments. Interviews with individual farmers were conducted toinvestigate the importance of locational properties for selection of sites for cultivation.Accessibility from residential units, proximity to other fields, and proximity to water,make a site attractive. Ownership strategies of ‘defence’ or ‘expansion’ of landholdingsare crucial. The perception of a plot’s qualities is context dependent andduring the crop-fallow sequence a particular plot can be selected for cultivationbecause it meets various different criteria.
- 5 M ha,N-S/E-W population/infrastructure gradientForest coverDifferent FM schemesDifferent deforestation dynamicsNPDF for Avoided deforestation and for carbon stock enhancementwere evaluated in terms of environmental parameters, agronomic sustainability, and socio-economic performance. The environmental parameters measured were carbon stocks, plant diversity, soil fauna diversity, and greenhouse gas emissions. Agronomic sustainability focused on soil structure, nutrient balances, and crop protection issues. The socio-economic performance included measures of profitability, labor intensity, food security issues, institutional requirements and equity biases.
- However, we decided that the Chave et al. is the most appropriate to use in this study because it is a more recently developed equation, uses a larger dataset (>2,400 individuals), contains a high number of large diameter trees (68 trees > 70 cm diameter of which 8 are > 120cm), and it takes into consideration wood density in additions to DBH.
- In highly dynamic landscapes at the tropical forest margin, aggregate deforestation rates used as reference for REDD do not reflect the ecological effects of deforestation on biodiversity and carbon. Monitoring carbon stocks for REDD+ requires accurate inventories of carbon fluxes within and among different "forest" land cover/uses, and spatially explicit measures are required to ensure biodiversity co-benefits of reducing aggregate deforestation. (influences on the baseline and the MRV)But what types of intervention?
- Land use mosaics is predominantly occupied by natural fallow systems, i.e. young secondary forests.
- If you start from a dense forest you can lose C stocks (large trees) before you loose much biodiversity, and a degradation curve tends to be convex; C stock restoration can occur at low increments of biodiversity, so restoration curves tend to be concave, although they rarely extend to more than half of the original forest C stocks. If we split biodiversity (flora, fauna) in succession groups, the old-growth species have the clearest link with system-level C stock. In testing such ‘null-models’ or hypotheses, the main challenge, of course, still is in the quantification of the biodiversity axis and in the unequal scaling of time for C-stock and biodiversity impacts of any change to be expressed.
- Guillaume, peuttu verifier les donneesofficielles de production dans le tabl.? Je ne les ai pas avec moi !Adding the small-scale production of sawnwood sold on the domestic market to the figure in national statistics results in a total nationalproduction of about 4.3 million m3 per year (in Roundwood Equivalents)—or nearly double the official figureGuillaume here you could orally/or with a slide Introduce the APV and the main content of the agreement to show the importance of regulating SSL and to plan exploitation in the rural land (to avoid ending up like Ghana…)
- Data for our survey, for instance, showthat both sectors target the same species: about60% and 80% of the total volume of ayous andiroko harvested, respectively. These species, whichhave long been the most widely harvested, aresourced mainly from the NPFE, rather than fromthe forest concessions (Figure 11).
- Indigenous multi-purpose trees have been a key element in traditional smallholders’ natural resources management strategies at the tropical forest margins in West and Central Africa. Farmers maintained selected forest species on their farms to: 1. increase crop productivity (e.g. enhancement of soil fertility, of nutrient cycling, management of light and moisture, protection from wind); 2. provide valuable products (food, medicines, construction timber, fuel wood etc.) for household consumption and income diversification. A wealth of local knowledge was developed on the use of trees in the management of the spatio-temporal farm-forest continuum in swidden and agroforest systems. The extension of the timber market to rural areas coupled with agricultural expansion and intensification is progressively eliminating tree resources from the agricultural mosaic (Fig.3 a and b) reducing smallholders’ systems resilience.
- Guillaume you can briefly explain, here or elsewhere, why the central region was choosen.The method used in the inventory was the variable area sampling by Sheil et al. applied to the land use units inventoried in the villages. Only 17 species over the 49 inventoried were present in all the land use units and among these only 5 had distributions that were homogeneous enough to be compared through ANOVA. Only ONE was significant. That does not mean tht there are no differences across land use units but the average density/ presence/absence from a LUT is not a good parameter… I also consider that in this study the separation in class ages is probably not the best suitable (too many fallow classes….we will make only one in the nexxt analysis)
- Guillaume you can briefly explain, here or elsewhere, why the central region was choosen.The method used in the inventory was the variable area sampling by Sheil et al. applied to the land use units inventoried in the villages. Only 17 species over the 49 inventoried were present in all the land use units and among these only 5 had distributions that were homogeneous enough to be compared through ANOVA. Only ONE was significant. That does not mean tht there are no differences across land use units but the average density/ presence/absence from a LUT is not a good parameter… I also consider that in this study the separation in class ages is probably not the best suitable (too many fallow classes….we will make only one in the nexxt analysis)
- Preliminary assessment conducted in 10 villages of the central region. Hypothesis were formulated on the basis of existing literature and on the previous exploratory work on the status of on farm timber in the central region of Cameroon (THE HIDDEN FOREST ITTO/CIFOR) 4HPs were formulated and tested in the villages through focus group meeting and individual interviews. Regulatory restrictions Informal /illegal chain was not perceived as a major constraint to participate to the sector. The harassment by the forest authorities and distrust of sawyers crews are other reasons that prevent them from considering on farm timber production a livelihood option
- Preliminary assessment conducted in 10 villages of the central region. Hypothesis were formulated on the basis of existing literature and on the previous exploratory work on the status of on farm timber in the central region of Cameroon (THE HIDDEN FOREST ITTO/CIFOR) 4HPs were formulated and tested in the villages through focus group meeting and individual interviews. Regulatory restrictions Informal /illegal chain was not perceived as a major constraint to participate to the sector. The harassment by the forest authorities and distrust of sawyers crews are other reasons that prevent them from considering on farm timber production a livelihood option
- We present a single value as average percentage over the maximum of diversity attained in the forest we considered here
- Environmental concerns are not foremost among most small farmers. Increasing income and wellbeing are their primary goals. Conservation and restoration of carbon stocks and consequently biodiversity are only possible to achieve if they are linked to adequate income-generating opportunities and appropriate institutional support. Since farmers’ private costs of using slash-and-burn farming techniques does not include environmental costs, corrective policies including subsidies for the intensification process, may be required. “Forest is a tract of land with a minimal surface of 0.1 hectare, with tree canopy cover of more than 30% (or with an equivalent stand density). The trees or arborescent vegetation should be able to reach a minimum height of 5 m.” Under this definition anything that has a tree cover lower than a minimum 30% is non-forest. However the definition includes also systems that could potentially reach the threshold value. In the UNFCC system the forest use should be the predominant one to identify forest land. Therefore a falls below 30% of tree cover would be deforestation if it is permanent (no potential regrowth of a young stand) and if it includes a change in land use.The decision of adopting the higher threshold of tree canopy cover (selection of thresholds for the countries was between 10-30%) reflects for Cameroon the objective of promoting reforestation projects at the forest/savanna interface and in the northern regions of the country, making trees and woody savannah land eligible for CDM. However in the forest zone that definition would include most of land under fallow where secondary regeneration is occurring creating biases in the understanding and definition of both deforestation and degradation processes in relation to small-scale agriculture and selective logging.
- methods of rapid resource appraisal with respect to biodiversity and to provide a cost-efficient method that can be readily transferred to stakeholders concerned with integrating natural resource management. How can you generalize plot level resultsDevelop scenarios to identify desirable landscape patterns