Farmers' preferences for tree functions and species in the West African Sahel
•
0 likes•229 views

Presentation during ICRAF Science Forum meeting 6-8 September 2010, Nairobi, Kenya, 1p
Recommended

Recommended
More Related Content
What's hot
What's hot (19)
Viewers also liked
Viewers also liked (9)
Similar to Farmers' preferences for tree functions and species in the West African Sahel
Similar to Farmers' preferences for tree functions and species in the West African Sahel (20)
More from World Agroforestry (ICRAF)
More from World Agroforestry (ICRAF) (20)
Recently uploaded
Recently uploaded (20)
Farmers' preferences for tree functions and species in the West African Sahel
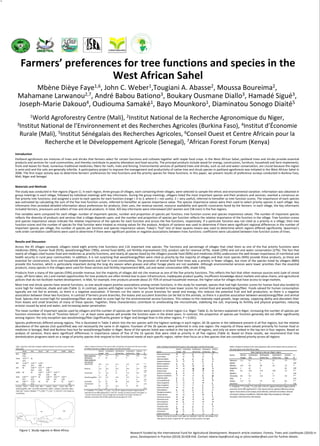
- 1. Farmers’ preferences for tree functions and species in the West African Sahel Mbène Dièye Faye1,6, John C. Weber1,Tougiani A. Abasse2, Moussa Boureima2, Mahamane Larwanou2,7, André Babou Bationo3, Boukary Ousmane Diallo3, Hamadé Sigué3, Joseph‐Marie Dakouo4, Oudiouma Samaké1, Bayo Mounkoro1, Diaminatou Sonogo Diaité5 1World Agroforestry Centre (Mali), 2Institut National de la Recherche Agronomique du Niger, 3Institut National de l’Environnement et des Recherches Agricoles (Burkina Faso), 4Institut d’Économie Rurale (Mali), 5Institut Sénégalais des Recherches Agricoles, 6Conseil Ouest et Centre Africain pour la Recherche et le Développement Agricole (Senegal), 7African Forest Forum (Kenya) Introduction Parkland agroforests are mixtures of trees and shrubs that farmers select for certain functions and cultivate together with staple food crops. In the West African Sahel, parkland trees and shrubs provide essential products and services for rural communities, and thereby contribute to poverty alleviation and food security. The principal products include wood for energy, construction, furniture, household and farm implements; fruits and leaves for food; numerous traditional medicines; fibers for roofs, mats and fencing. Environmental services of parkland trees and shrubs, such as soil and water conservation, are crucial because the region is semi‐arid and the soils are generally infertile. A participatory project to improve the management and productivity of native tree and shrub species in parkland agroforests was initiated in the West African Sahel in 2006. The first major activity was to determine farmers’ preferences for tree functions and the priority species for these functions. In this paper, we present results of preference surveys conducted in Burkina Faso, Mali, Niger and Senegal. Materials and Methods The study was conducted in five regions (Figure 1). In each region, three groups of villages, each containing three villages, were selected to sample the ethnic and environmental variation. Information was obtained in group meetings in each village, followed by individual meetings with key informants. During the group meetings, villagers listed the most important species and their products and services; reached a consensus on five priority tree functions; and assigned a score to each species for each function (range = 0 to 3, where 0 = not useful, 3 = very useful), referred to hereafter as tree function scores. The importance of each species was estimated by calculating the sum of the five tree function scores, referred to hereafter as species importance value. The species importance values were then used to select priority species in each village. Key informants then provided detailed information about preferences for products, their uses, the revenue earned, resource availability and specific constraints faced by the farmers. In each village, the key informants included farmers, processors and sellers of tree and shrub products. In total, 425 key informants were interviewed (267 women and 158 men) in the five regions. Five variables were computed for each village: number of important species, number and proportion of species per function, tree function scores and species importance values. The number of important species reflects the diversity of products and services that a village depends upon, and the number and proportion of species per function reflects the relative importance of the function in the village. Tree function scores and species importance values indicate the relative importance of the species for each function and across the five functions, respectively. If a particular function was not cited as a priority in a village, then tree function scores and the number of species for that function were treated as missing values for the analysis. Analysis of variance was used to determine if there were significant regional differences in the number of important species per village, the number of species per function and species importance values. Tukey’s “hsd” test of least squares means was used to determine which regions differed significantly. Spearman’s rank‐order correlation coefficients were used to determine if there were significant positive or negative associations between trees functions: coefficients were calculated between tree function scores of trees. Results and Discussion Across the 45 villages surveyed, villagers listed eight priority tree functions and 116 important tree species. The functions and percentage of villages that cited them as one of the five priority functions were medicines (96%), human food (91%), wood/energy/fiber (78%), animal food (60%), soil fertility improvement (53), product sale for revenue (47%). shade (29%) and soil and water conservation (27%). The fact that nearly all villages cited human food and medicines as priority functions, and nearly all species listed by the villagers provide food (90%) and medicines (93%) underscores the well‐known importance of nutritional and health security in rural poor communities. In addition, it is not surprising that wood/energy/fiber were cited as priority by the majority of villages and that most species (94%) provide these products, as these are essential for construction, farm and household implements and fuel in rural communities. The provision of animal food from trees was a priority in fewer villages, but most of the species listed by villagers (88%) provide this function, which is particularly important during the long dry season when grasses and other forage plants are not available. Although environmental services were lower priorities than the essential products, many species in the villages were used for these services (soil fertility improvement 86%, soil and water conservation 69%, shade 53%). Products from a many of the species (59%) provide revenue, but the majority of villages did not cite revenue as one of the five priority functions. This reflects the fact that other revenue sources exist (sale of cereal crops, off‐farm labor, etc.) and market opportunities for tree products are often limited due to poor infrastructure, inadequate product quality, insufficient knowledge about markets and value chains, and agricultural policies that do not facilitate market development. In Mali, for example, tree products provide about 25‐75% of annual household revenue, the higher value for villages that have access to large markets. Most tree and shrub species have several functions, so one would expect positive associations among certain functions. In this study for example, species that had high function scores for human food also tended to score high for medicine, shade and sale (Table 1). In contrast, species with higher scores for human food tended to have lower scores for animal food and wood/energy/fiber. Foods valued for human consumption typically are not fed to animals, so there is a negative association. If farmers cut the stems or prune branches for wood and energy, this reduces the potential fruit and leaf production, so there is a negative association between these two functions. In contrast if farmers prune branches, the leaves and succulent branches can be fed to the animals, so there is a positive association between wood/energy/fiber and animal food. Species that scored high for wood/energy/fiber also tended to score high for the environmental service functions. This relates to the relatively rapid growth, large canopy, coppicing ability and abundant litter from leaves and small branches of many of these species. Together, these characteristics contribute to ameliorating the microclimate, stabilizing the soil, improving its fertility and physical properties, reducing erosion caused by wind and water, and increasing water penetration. The mean number of important species used by villagers and the number of species per function were greatest in driest region (i.e. Niger: Table 2). As farmers explained in Niger, increasing the number of species per function minimizes the risk of “function failure”, i.e. at least some species will provide the function even in the driest years. In contrast, the proportion of species per function generally did not differ significantly among regions: the only exception was wood/energy/fiber (significantly greater in Niger and Senegal than in the other regions, P < 0.001). Species preferences differed among regions. This is illustrated in Table 3 which lists the ten species with the highest rankings in each region. All 26 species in the tablewere present in all five regions, but the relative abundance of the species (not quantified) was not necessarily the same in all regions. Fourteen of the 26 species were preferred in only one region: the majority of these were valued primarily for human food or medicine in Senegal, Mali and Burkina Faso but for wood/energy/fodder in Niger. None of the species listed was ranked in the top ten in all regions, and only six were ranked in the top ten in four regions. Based on analysis of variance, there were significant differences in importance values of five of the 16 species that were cited as priority in all five regions (Table 4). Based on these results, we recommend that tree domestication programs work on a range of priority species that respond to the functional needs of each specific region, rather than focus on a few species that are considered priority across all regions Table 1. Spearman’s rank‐order correlation coefficients between tree function scores in the West Table 2. Analysis of variance of the mean number of important tree species and the mean number Table 3. Ranking of the preferred tree species in each study region in the West African Sahel. Table 4. Analysis of variance of the mean importance value of tree species cited as priority in all African Sahel. for different functions in villages in five regions in the West African Sahel. Western Southeastern Northwestern Southeastern Southern five study regions in the West African Sahel. HFood Med AFood WEF SoilF SoilWC Shade Western Southeastern Northwestern Southeastern Southern P / Species Senegal Mali Burkina Faso Burkina Faso Niger Senegal Mali Burkina Faso Burkina Faso Niger Df Mean importance value per village in regions Med 0.086 * . Acacia macrostachya NP NP 8 51 61 Mean number for 13.7 17.1 20.2 20.3 33.8 *** Species Western Southeastern Northwestern Southeastern Southern P / (779) Acacia nilotica 27 15 30 22 7 AFood –0.237 *** NS . all functions a ab b b c 4,30 Senegal Mali Burkina Faso Burkina Faso Niger Df Mean number for Adansonia digitata 1 4 4 6 28 (475) Anogeissus leiocarpus 39 19 35 9 16 Adansonia 11.7 8.4 8.4 6.5 2.9 *** each function WEF –0.138 *** 0.139 *** 0.146 ** . Balanites aegyptiaca 4 5 9 15 6 digitata a a a 4,30 Human food 10.4 11.2 15.2 15.0 20.7 *** (652) (707) (480) a a b b c 4,26 Bauhinia rufescens 32 NP NP NP 9 Balanites 10.7 8.0 6.8 3.6 7.9 ** SoilF NS 0.182 *** 0.311 *** 0.358 *** . Medicine 13.2 16.2 19.2 19.9 31.0 *** Bombax costatum NP 18 10 10 58 aegyptiaca a ab b ab 4,28 (451) (339) (436) a b b b c 4,28 Cordyla pinnata 5 22 NP NP NP Parkia 6.4 10.2 11.9 10.0 3.2 *** SoilWC NS NS 0.297 ** 0.349 *** 0.554 *** . Animal food 7.9 12.2 LP 17.0 29.7 *** Detarium microcarpum 8 20 35 14 30 biglobosa a a a 4,28 (93) (219) (89) a ab bc c 3,15 Diospyros mespiliformis 12 14 16 8 10 Tamarindus 8.6 9.0 11.6 7.7 4.6 *** Shade 0.249 *** 0.220 *** NS 0.366 *** 0.451 *** 0.269 ** . Wood/energy/fiber 13.7 12.7 12.8 15.3 31.1 *** Faidherbia albida 6 7 7 18 5 indica a a a 4,33 (257) (257) (199) (57) (135) a a a a b 4,21 Ficus gnaphalocarpa 9 33 11 NP NP Ziziphus 11.7 9.1 7.9 4.0 8.9 *** Sale 0.493 *** 0.132 * NS NS NS NS 0.339 ** Soil fertility 4.8 8.2 NP 10.9 20.9 *** improvement a ab b c 3,14 Guiera senegalensis 21 24 22 NP 3 mauritiana a a a 4,30 (352) (352) (82) Sale 9.7 13.7 15.5 LP NP * Khaya senegalensis 17 15 17 3 42 Functions: HFood = human food, Med = medicine, AFood = animal food, WEF = Lannea microcarpa NP 11 4 6 18 P = Probability: *** P < 0.001, ** P < 0.01, NS P > 0.05. Df = degrees of freedom. Regions with the wood/energy/fiber, SoilF = soil fertility improvement, SoilWC = soil/water conservation, Shade = a ab b 2,11 Parkia biglobosa 6 6 2 2 25 same letter do not differ significantly (P > 0.05). Species with non‐significant differences among shade, Sale = revenue. Probability: *** P < 0.001, ** P < 0.01, * P < 0.05, NS P > 0.05. Sample size P = Probability: *** P < 0.001, ** P < 0.01, * P < 0.05. Df = degrees of freedom. Regions with the same letter do not differ significantly (P > 0.05). NP = function not cited as priority in the region. LP Piliostigma reticulatum 17 17 13 5 3 regions: Acacia nilotica, Acacia senegal, Cassia sieberiana, Combretum micranthum, Detarium in parentheses. = function cited as priority in only one village and not included in the analysis. Numbers for Prosopis africana NP 28 43 NP 1 microcarpum, Diospyros mespiliformis, Faidherbia albida, Khaya senegalensis, Piliostigma soil/water conservation did not differ significantly among regions (P > 0.05). Pterocarpus erinaceus NP 9 30 21 51 reticulatum, Sclerocarya birrea, Vitex doniana. Pterocarpus lucens NP 8 20 NP NP Saba senegalensis NP 9 14 NP NP Sclerocarya birrea 31 12 15 12 8 Tamarindus indica 3 3 3 4 14 Vitellaria paradoxa NP 1 1 1 21 Mali Niger Vitex doniana 10 25 21 19 17 Ziziphus mauritiana 2 2 6 13 2 1 Senegal KAOLACK Rankings of the top‐ten species in each region are underlined in bold font, and rankings of the SEGOU 2 SAN 3 OUHIGOUHA 5 AGUIE other species are shown in regular font. NP = species not cited as priority in the region. 4 Burkina Faso FADA NGOURMA Figure 1. Study regions in West Africa. Research funded by the International Fund for Agricultural Development. Research article citations: Forests, Trees and Livelihoods (2010) in press, Development in Practice (2010) 20:428‐434. Contact mbene.faye@coraf.org or johncrweber@aol.com for further details.