Downloaded 71 times


![References Campbell-Reece. Biology. Custom Edition. Vol. I. San Francisco: Benjamin Cummings, 2008. II vols. CornellInstitute for Biology Teachers [Internet]. Ithaca (NY): Photosynthesis and Respirationin Elodea [modified 2008 Jun 24; cited 2010 Nov 23]. Available from: http://cibt.bio.cornell.edu/labs/dl/PELO.PDF. Vodopich-Moore. BiologyLaboratory Manual. Ninth Edition. Boston :McGraw Hill Companies, Inc., 2011.](https://image.slidesharecdn.com/fermentationandcellularrespiration-101203121052-phpapp01/85/Fermentation-and-cellular-respiration-21-320.jpg)

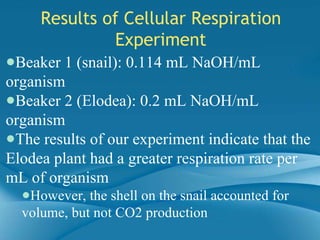
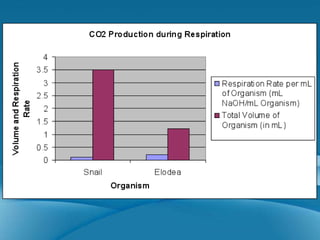
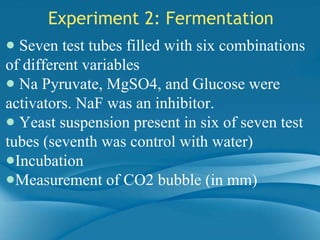
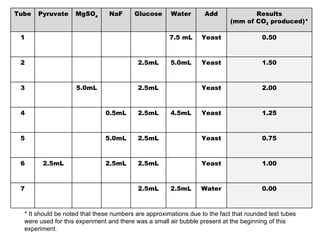
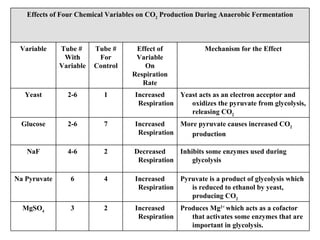
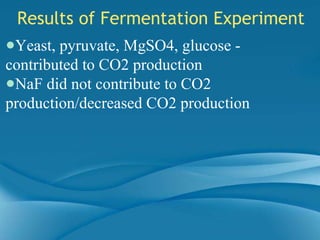
The document summarizes two experiments comparing cellular respiration and fermentation. The first experiment finds that an Elodea plant had a higher cellular respiration rate than a snail per mL. The second experiment tested how different variables like yeast, glucose, and sodium fluoride affected fermentation in yeast, finding that yeast and glucose increased carbon dioxide production while sodium fluoride decreased it. Both experiments demonstrate the differences between cellular respiration and fermentation.


