Financial Forecasting Fortune 500 Stocks Using Statistical Classification Learning Algorithms
•
1 like•298 views

This document describes using statistical classification learning algorithms to forecast the stock price movements of Fortune 500 companies. It applies linear discriminant analysis (LDA), quadratic discriminant analysis (QDA), and K-nearest neighbors (KNN) to historical stock data for Walmart, Exxon, and Alphabet from 2007-2016. LDA and QDA performed reasonably well for Walmart and Alphabet, correctly predicting over 50% of price movements, while none of the models achieved good accuracy for Exxon. KNN achieved the lowest test error rates when choosing an optimal number of neighbors.

Recommended
More Related Content
Viewers also liked
Viewers also liked (6)
Similar to Financial Forecasting Fortune 500 Stocks Using Statistical Classification Learning Algorithms
Similar to Financial Forecasting Fortune 500 Stocks Using Statistical Classification Learning Algorithms (20)
Recently uploaded
Recently uploaded (20)
Financial Forecasting Fortune 500 Stocks Using Statistical Classification Learning Algorithms
- 1. Financial Forecasting Fortune 500 Stocks Using Statistical Classification Learning Algorithms Zack Pollak • Zach Murray • Kyle He ● Department of Statistics, University of Michigan — Stats 415 Data Mining ● Contact information: ○ Z. Pollak — UM ‘16 BS Statistics — zpollak@umich.edu ○ Z. Murray — UM ‘16 BS Informatics — zhmurray@umich.edu ○ K. He — UM ‘17 BS Informatics — kylehe@umich.edu Abstract: A theory laying at the foundations of financial asset pricing, the Efficient Market Hypothesis, claims that the price of an asset reflects the full amount of information available, implying it is not possible to “beat the market”. WeakForm EMH implies the expected value of any stock, given all available security market information, is equal to the current market price of the stock. This paper applies statistical learning methods to historical securities data with the intention of forecasting the stock price movements of Fortune 500 companies from multiple verticals. Keywords: Financial forecast • KNearest neighbors (KNN) • Linear discriminant analysis (LDA) • Quadratic discriminant analysis (QDA) • quantmod • R • Statistical Learning
- 2. Methodology Data Collection We pulled our data from Yahoo! Finance using the getSymbols() function in the R quantmod package to create an xts (eXtensible Time Series) object of stock information which we then transformed into a data frame for use with the statistical learning functions found in the R packages MASS and class. Each stock’s data is indexed by date ranging from 2007 up until today’s date uptodate information is one of the many benefits provided by quantmod. The xts object from getSymbols() consists of the stock’s daily opening price, closing price, trading volume, high price, low price, and adjusted closing price. Of these variables, we would like to use the stock’s closing price and volume of shares traded for each day. Using the getSymbols() data, we would create another data frame taking advantage of the date indexing of xts, containing: the daily volume of shares traded, 10 different lags, and our response variable direction. We focused our analysis on stable, Fortune 500 stocks including Walmart (WMT) representing the retail sector, Exxon (XOM) representing petroleum refining, and Alphabet (GOOGL) representing the tech sector. We are focusing on industry leaders as they tend to represent the full sector well and are not too risky. This allows us to worry more about the strength of each learning method used in determining the best method to forecast a financial time series. Building the Data Frames A vector of returns was calculated using dailyReturn() which computes the closetoclose return as a percentage given a specific stock for each day since 2007. Using returns we created our response variable, direction. Direction is a 2level factor, categorical
- 3. variable consisting of “UP” and “DOWN” depending on the sign of the day’s return. Lags were calculated using a time series lag function included in the quantmod package in order to generate k lagged return vectors (where each vector is the stock’s returns vector shifted k days down). We chose to set k=10 because this allowed us to capture the last two weeks of trading. Filtering the Data The data was split into a training and testing set in order to validate model performance. Each model is fit using the training set, which in this case we define to be all of the stock data from January 2007 through the end of December 2013. The test set for each model is all of the stock data from January 2014 up until April 20, 2016. All observations with an NA coerced due to lagging were omitted from each data frame. In order to implement our statistical learning methods, we partitioned the data into training and testing sets. The training set accounted for about ⅔ of the data, while the test set represented the remaining ⅓ of the data. We split the data before building the direction or any lag vectors to take advantage of xts indexing. We created vectors for each set by extracting the respective training and testing volumes of stocks traded, 10 days of lagged returns, and directions from the train and test xts objects. Then, binding these vectors by column into new training and testing data frames, we were ready to implement Linear Discriminant Analysis, Quadratic Discriminant Analysis, and KNearest Neighbors classification. Statistical Modeling and Analysis Our primary objective was to extrapolate the success rates of predicting a stock’s direction using the different statistical learning methods we explored this semester. Our secondary objective was to use the most successful prediction methods to create our own unique quantitative trading strategies, however, this will be explored in a followup study. All statistical
- 4. analysis was done using the RStudio GUI (Version 0.99.484) with various additional packages: class, ggplot2, MASS, PerformanceAnalytics, quantmod and xts. Our analysis took the form of exploring the effects of past returns and volume on future returns; then, visualizing and interpreting model output lead to proper assessments of statistical learning for financial forecasting. Comparing Learning Methods Statistical Classification — Theoretical Framework As the goal of this study is to successfully predict the direction a stock will move tomorrow given the past 10 days’ returns and the stock’s volume, we look to build a model to classify the stock’s direction as a function of the explanatory variables using the training set. Predictions will be made for the unseen test set in order to validate the accuracy of the model. This study only incorporates binary classification methods since Direction is limited to “UP” and “DOWN” (if it occurs, no change in returns is included in “DOWN”). The mathematical framework behind binary classification includes: ● Twoclass label: ● Input variables: This study will have the response variable labels, c1 and c2, be represented by the stock’s direction. The input variables are the 10 lagged returns and the stock’s volume so p = 11. The goal of statistical classification is to produce a classifier that accurately predicts unseen cases. Using the training classconditional densities and classconditional prior probabilities we can apply Bayes’ Theorem to estimate the posterior probability,
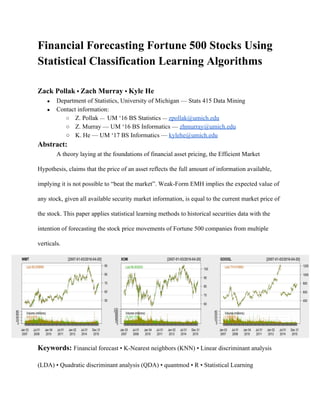
- 5. Linear Discriminant Analysis Linear discriminant analysis (LDA) is a dimensionality reduction learning method that locates a linear combination of continuous predictor variables to predict a categorical response variable. LDA is a discriminative, linear classifier with underlying assumptions that the classconditional density functions, , are gaussian and the classes share a common covariance matrix (homoscedasticity across classes: ∑k = ∑ ∀k). These assumptions lead to a discriminant function for each k, where the decision rule is given by generating the LDA decision boundaries. The MASS package’s lda() function can be leveraged with the training set to facilitate LDA model creation; in this case, Direction is the response variable while the rest of the data frame makes up the explanatory variables. R’s predict() function may be utilized in conjunction with the LDA model and the unseen test set to generate class predictions, “UP” or “DOWN”, for each test day. Figure 1: LDA discriminant density histograms for WMT, XOM, and GOOGL
- 7. and Google due to their misclassification error rates being less than 50%. We expected LDA to be a good forecasting method due to our analysis being run on largecap stocks where the potential percentage increase or decrease is very small and the stocks tend to be rather stable weekbyweek. Quadratic Discriminant Analysis LDA is actually a special case of Quadratic Discriminant Analysis (QDA) is a discriminative learning method similar to LDA in that the classconditional densities, , are modeled as multivariate gaussian. However, the covariance matrices are not assumed to be equal for QDA, resulting in discriminant function for each class k: where the decision rule is once again given by to define the QDA decision boundaries. QDA is preferable to LDA when variances between classes are noticeably different and there are a significant amount of observations. The qda() function in the MASS package can be utilized in an identical manner to building an LDA model and test class prediction. Looking at Figure 2, the QDA test misclassification error straddles 50% for all three equities. As we surely have enough observations, we can attribute the decline in prediction accuracy to similar variances among classes. The error rates for the QDA classification algorithm on the three stocks are all fairly similar. However, in this case both Exxon and Walmart had error rates higher than 50% implying that we were not able to accurately forecast direction using QDA classification with 10 days of