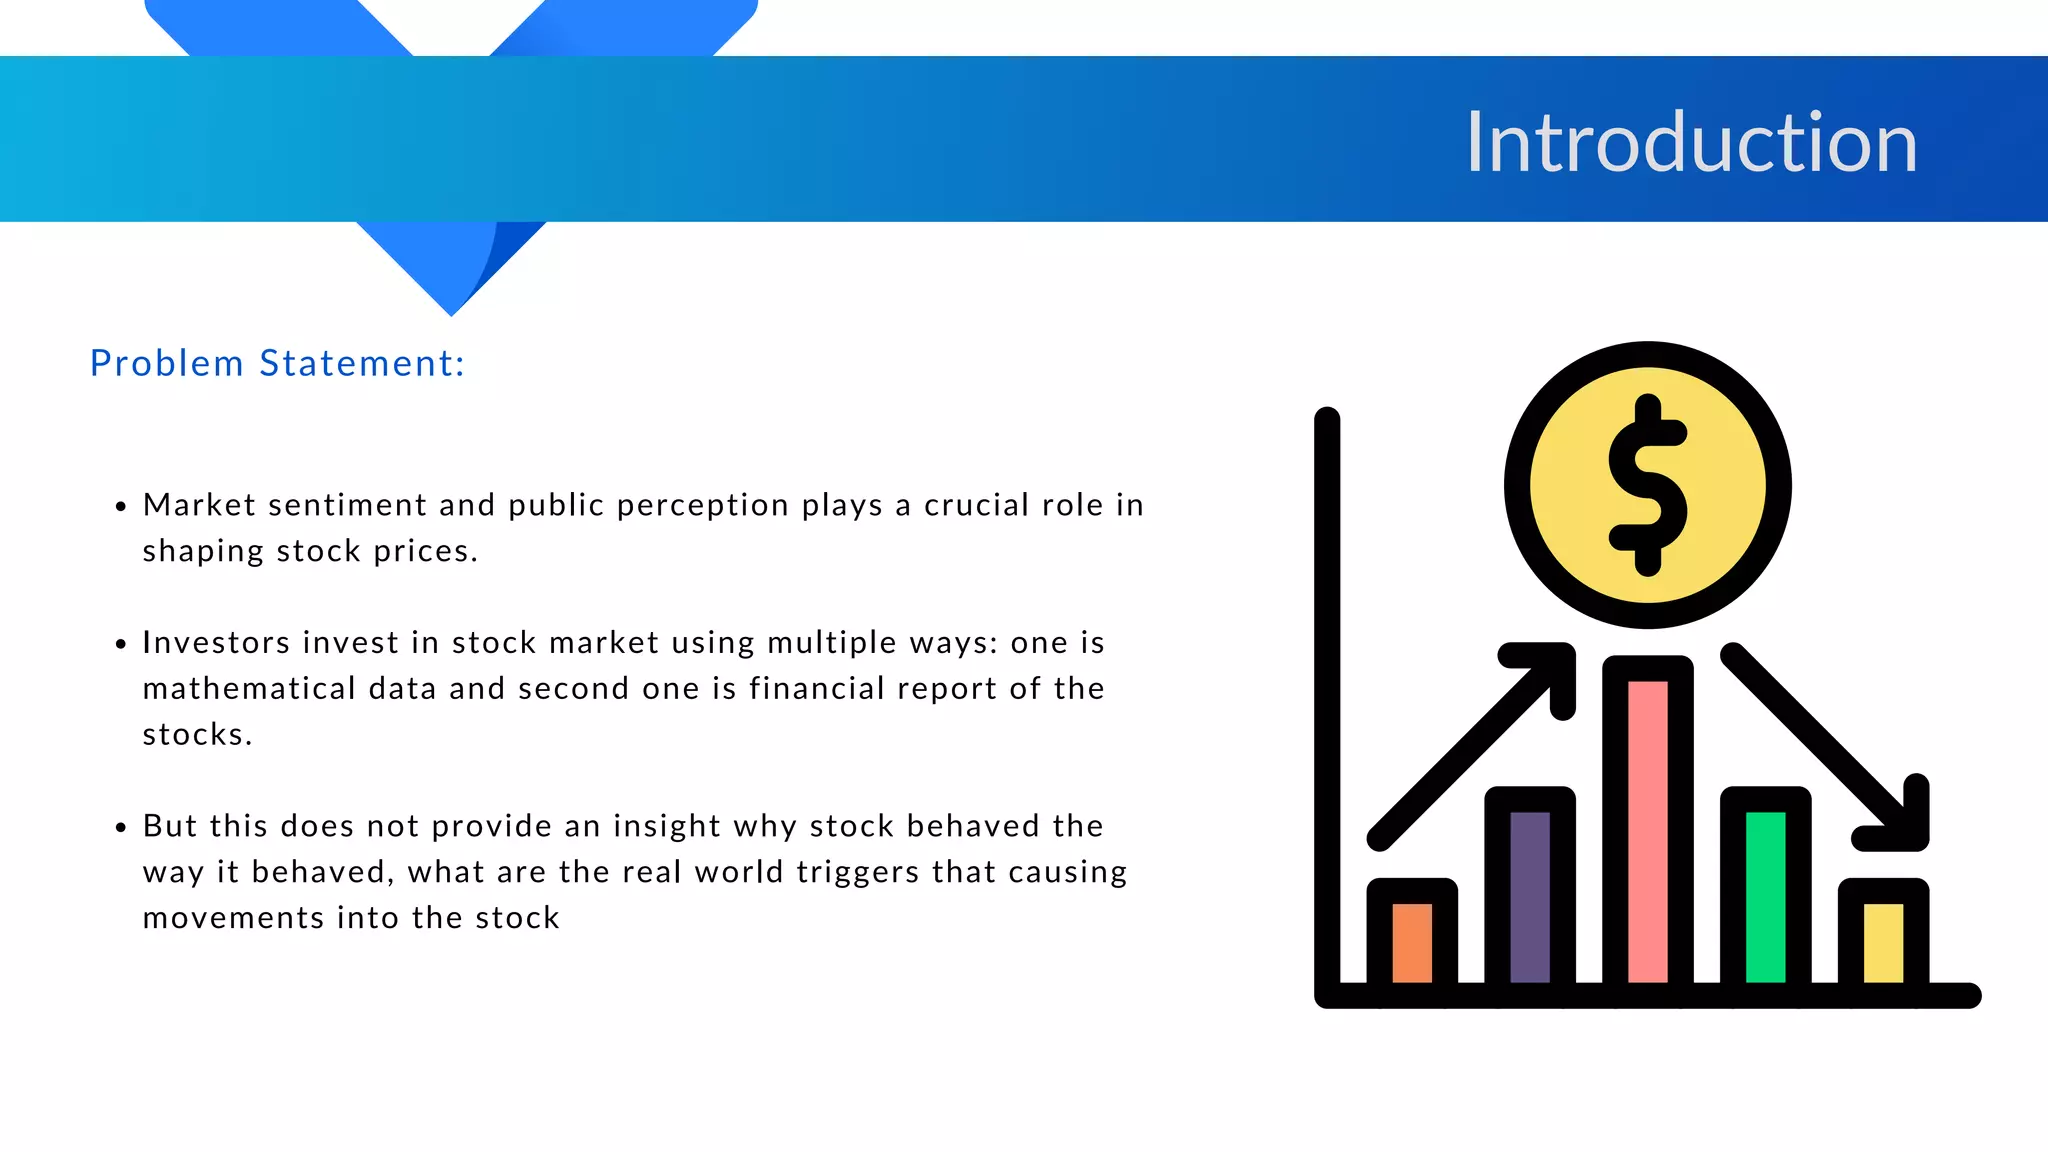
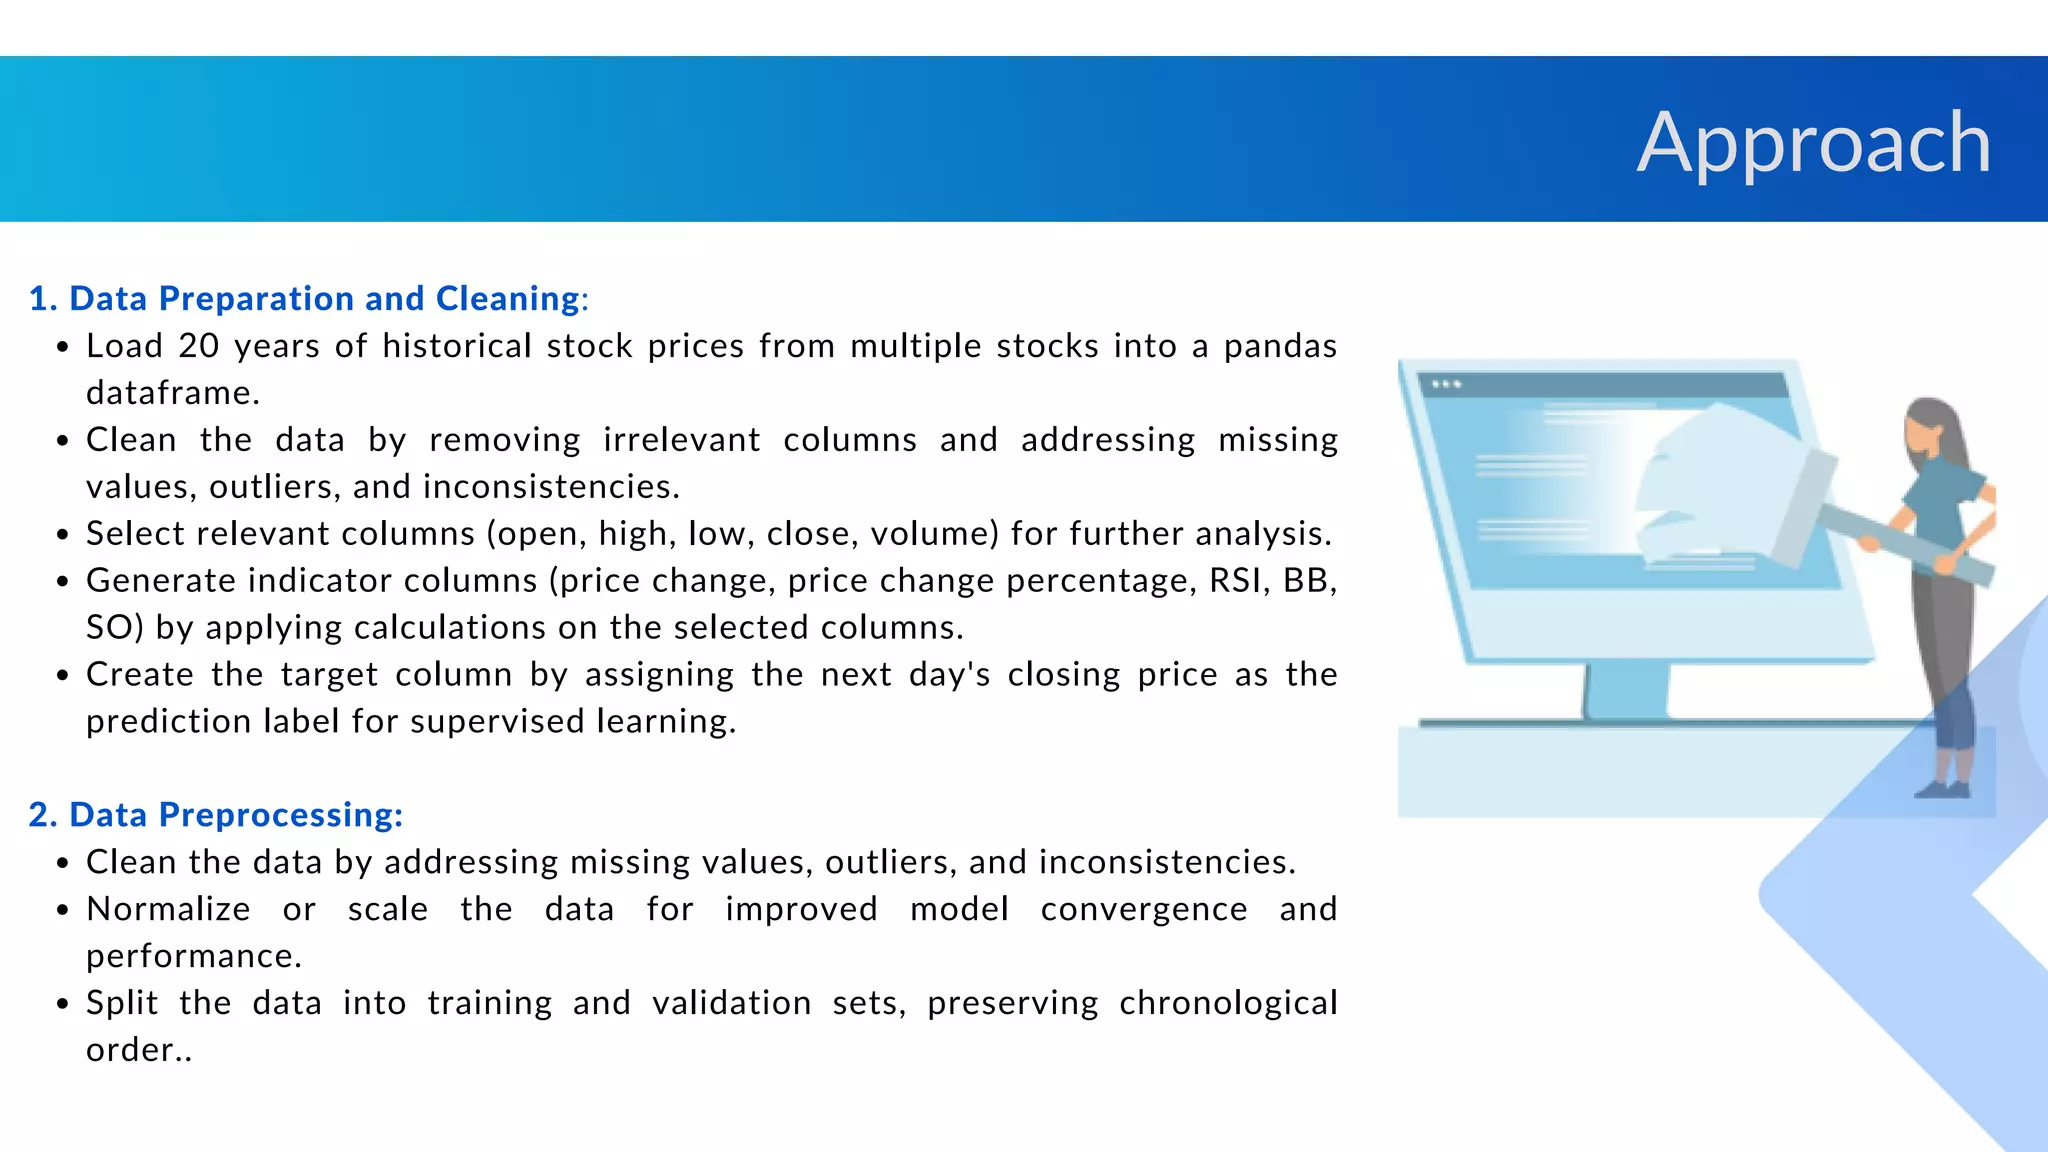
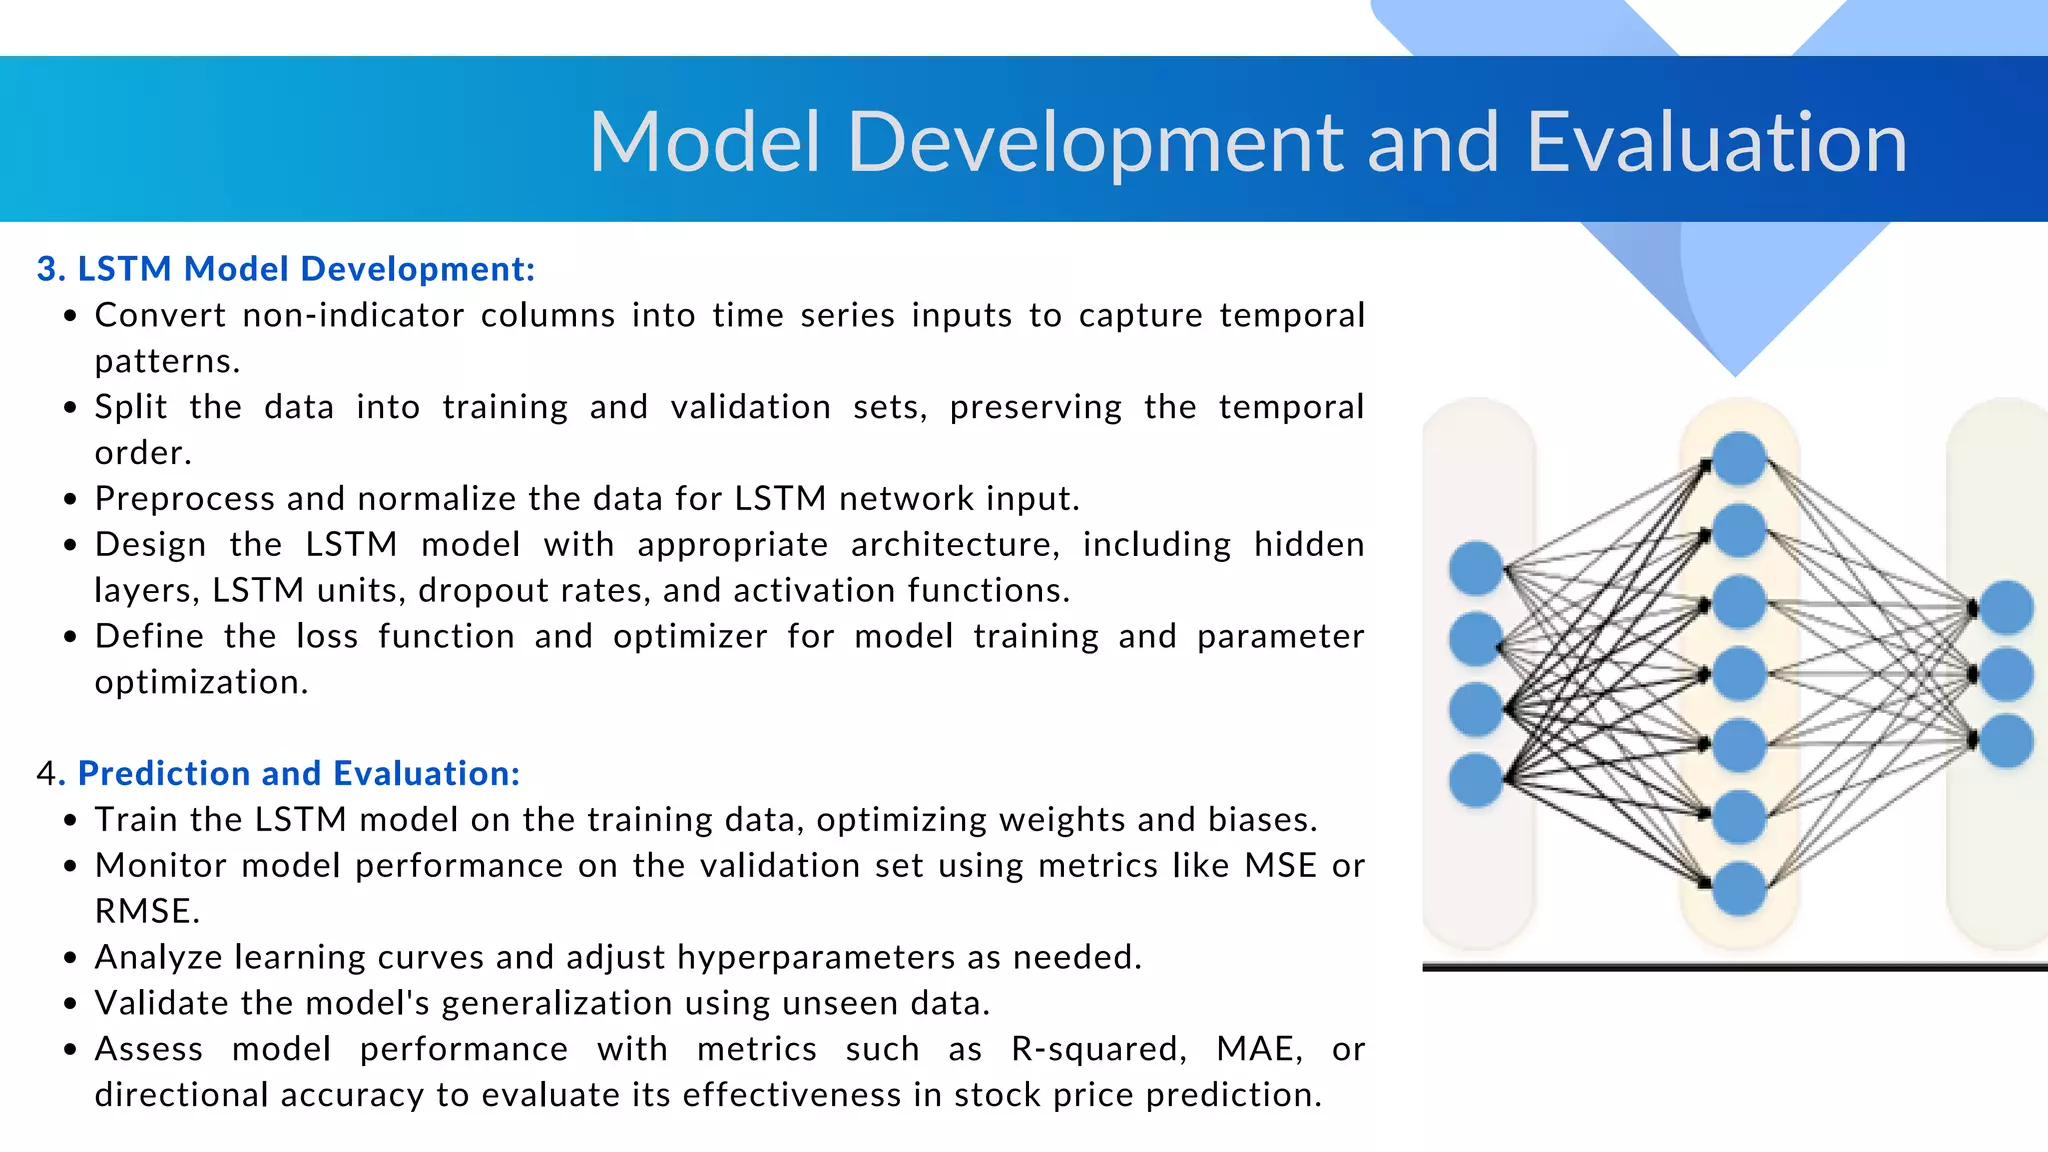
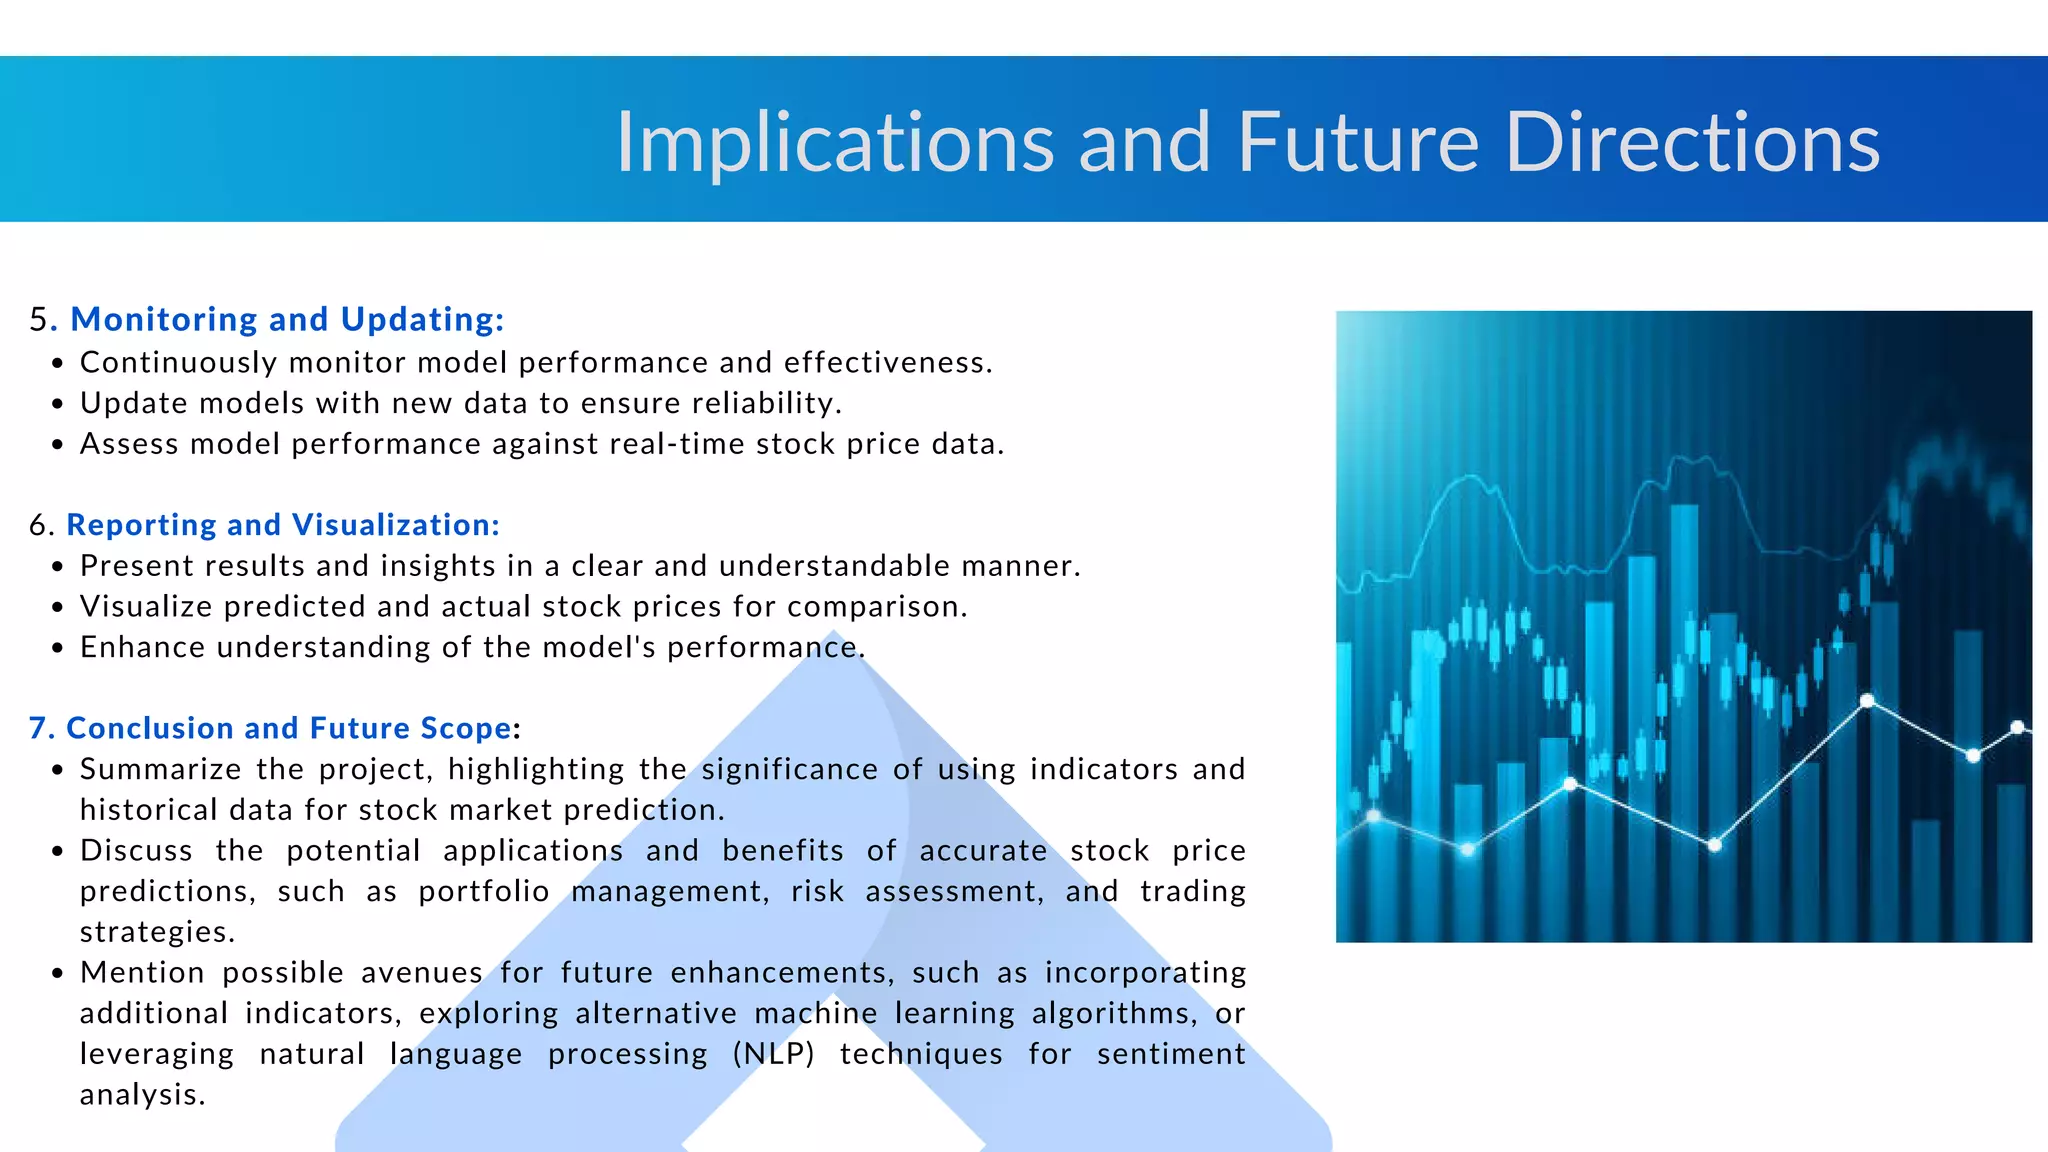
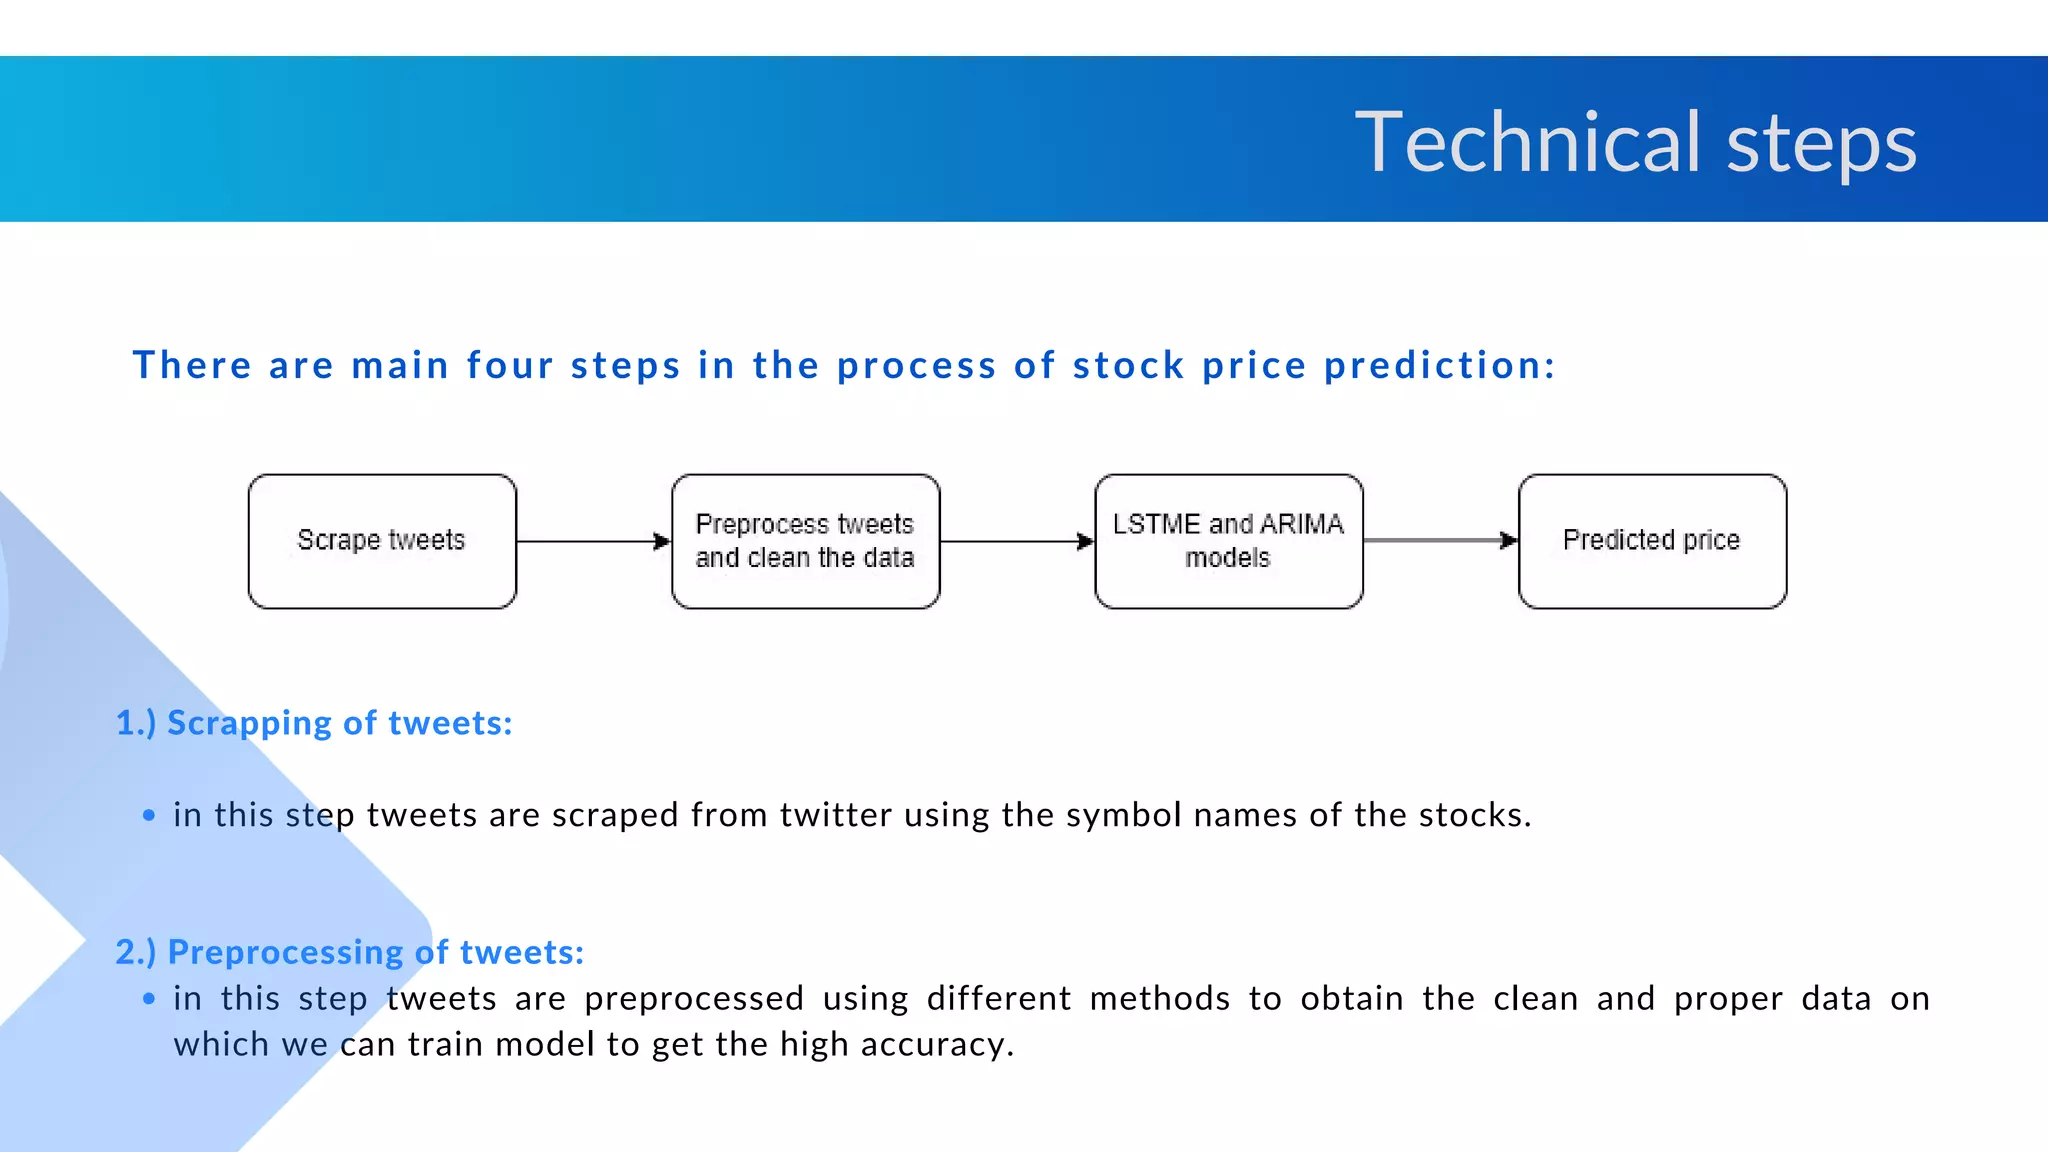
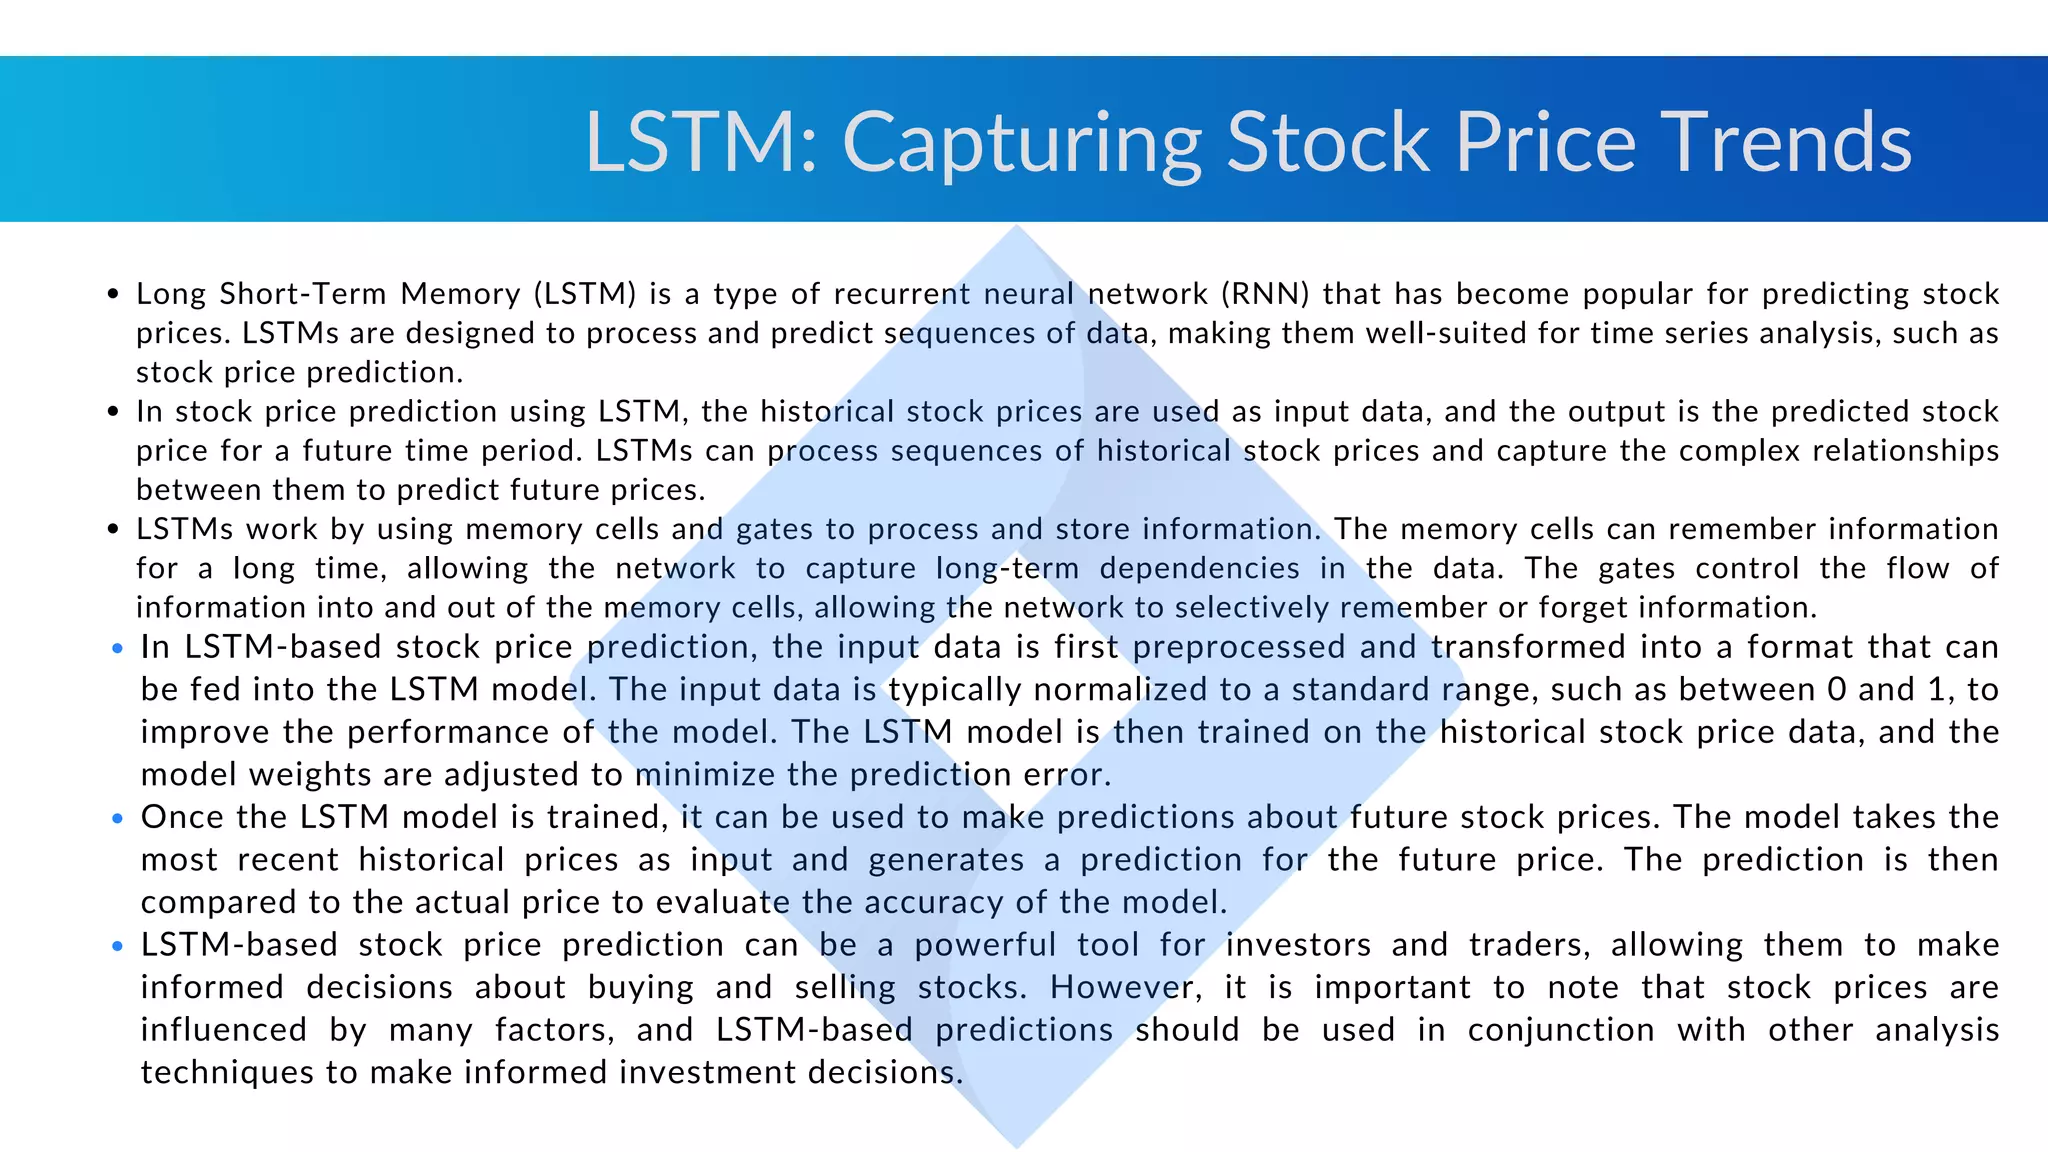
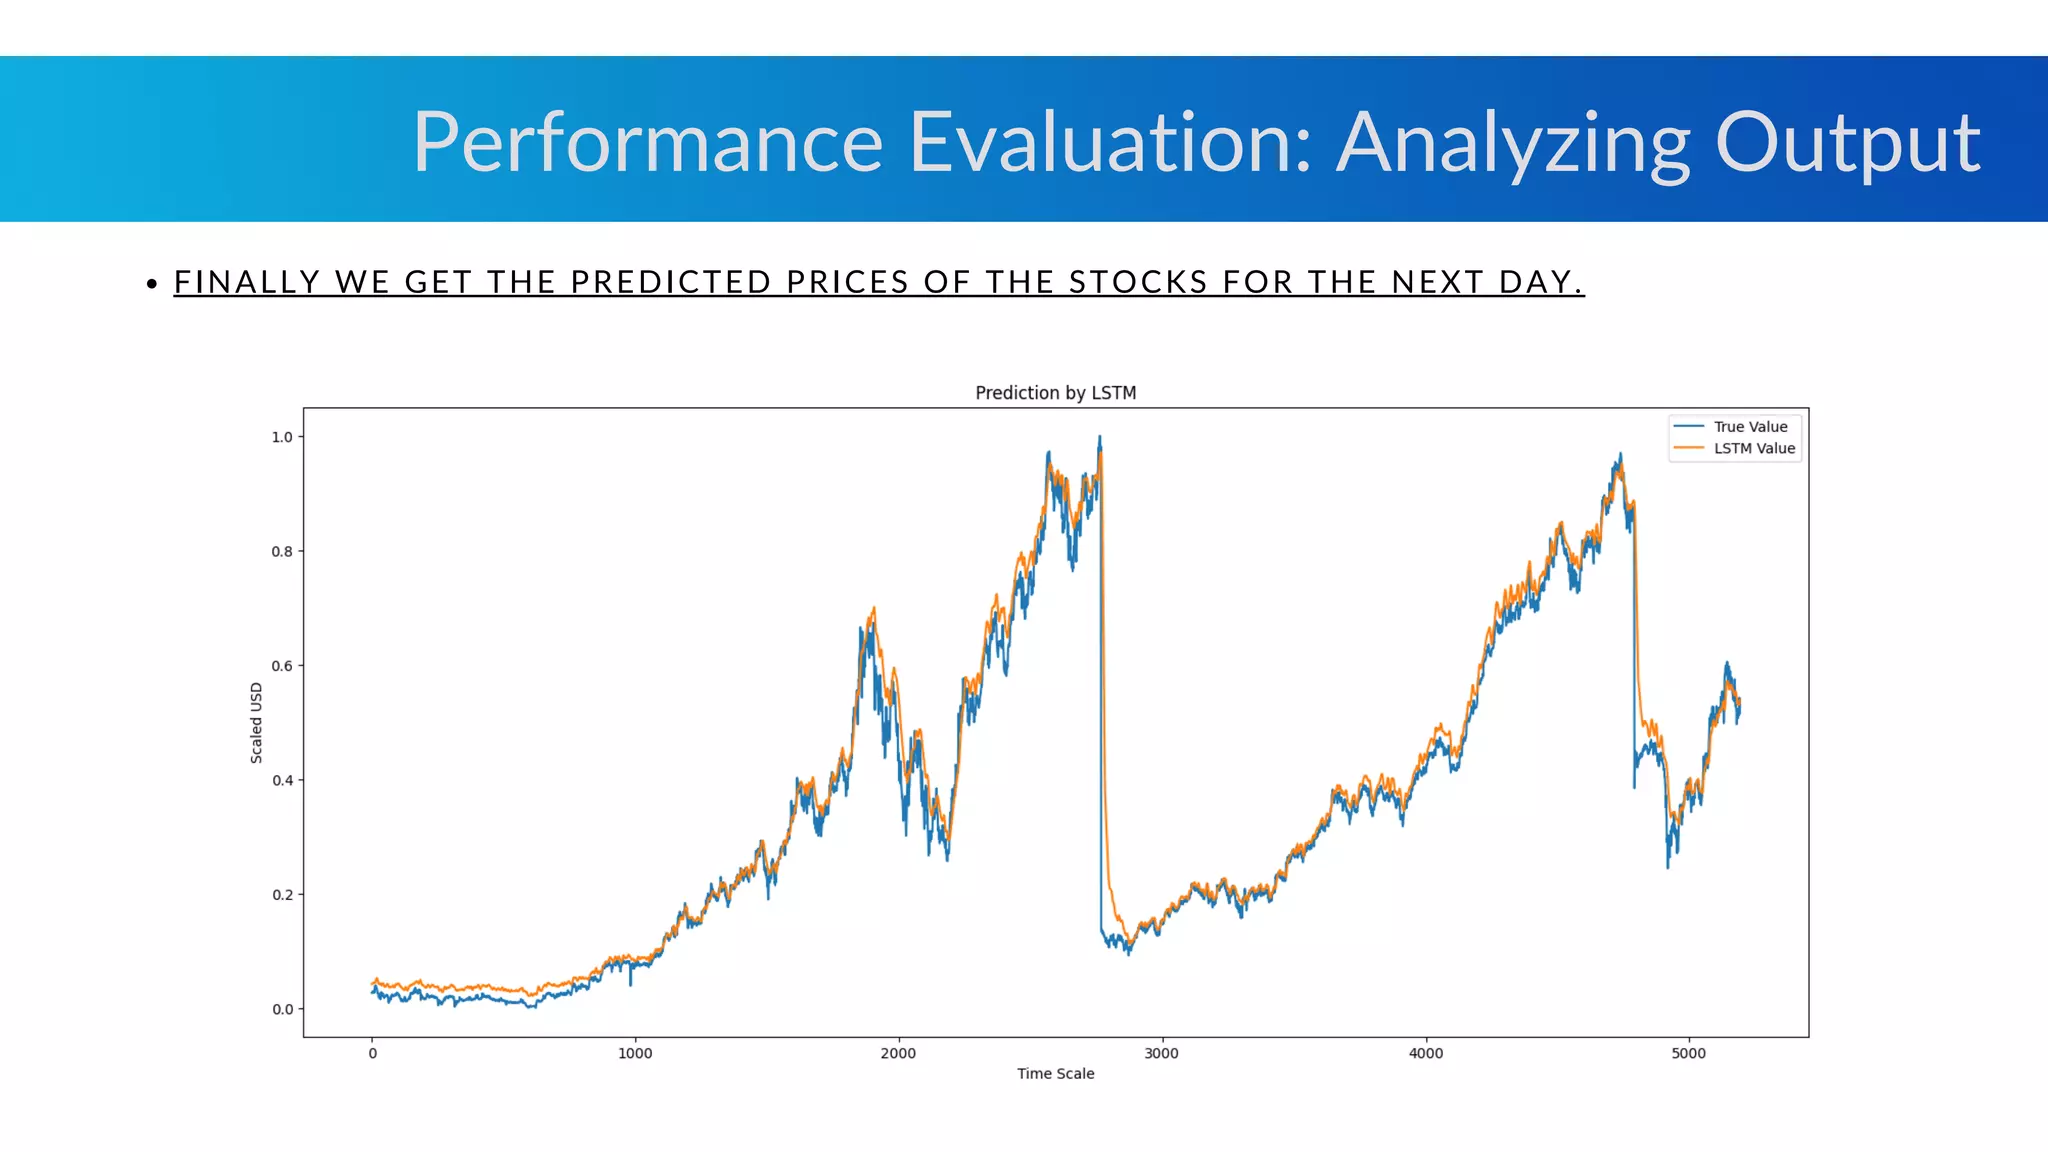
This project aims to provide accurate and reliable predictions for stock prices using the power of LSTM (Long Short-Term Memory) and ARIMA (AutoRegressive Integrated Moving Average) models. By analyzing historical stock data and leveraging the capabilities of these advanced forecasting models, we help investors and traders make informed decisions and optimize their investment strategies.
The project workflow begins with gathering comprehensive historical stock price data, including open, high, low, and closing prices, as well as trading volumes and other relevant features. This data is then preprocessed to handle missing values, outliers, and any other inconsistencies that may impact the accuracy of the predictions.
For time series analysis and forecasting, we employ the LSTM model, a variant of recurrent neural networks (RNNs) known for their ability to capture long-term dependencies in sequential data. LSTM models have proven to be highly effective in capturing the complex patterns and trends present in stock price data. By training the LSTM model on historical stock data, we can predict future stock prices with a high degree of accuracy.
In addition to LSTM, we utilize the ARIMA model, a widely used statistical method for time series forecasting. ARIMA models capture the autoregressive, moving average, and integrated components of a time series, allowing us to capture both short-term and long-term trends in stock prices. By incorporating the ARIMA model into our prediction pipeline, we further enhance the accuracy and reliability of our forecasts.
To evaluate the performance of our models, we use appropriate evaluation metrics such as mean absolute error (MAE), root mean squared error (RMSE), and mean absolute percentage error (MAPE). These metrics provide insights into the effectiveness of our models and help us fine-tune the parameters for optimal performance.
The Stock Price Prediction project using LSTM and ARIMA models represents our commitment to leveraging advanced machine learning and statistical techniques to provide valuable insights in the financial domain. By accurately forecasting stock prices, we empower investors and traders to make data-driven decisions, mitigate risks, and optimize their investment strategies. This project showcases our expertise in time series analysis, deep learning, and statistical modeling, and our dedication to delivering solutions that drive tangible business outcomes in the financial sector.
3. Market sentiment and public perception plays a crucial role in
shaping stock prices.
Investors invest in stock market using multiple ways: one is
mathematical data and second one is financial report of the
stocks.
But this does not provide an insight why stock behaved the
way it behaved, what are the real world triggers that causing
movements into the stock
Problem Statement:
Introduction
4. Load 20 years of historical stock prices from multiple stocks into a pandas
dataframe.
Clean the data by removing irrelevant columns and addressing missing
values, outliers, and inconsistencies.
Select relevant columns (open, high, low, close, volume) for further analysis.
Generate indicator columns (price change, price change percentage, RSI, BB,
SO) by applying calculations on the selected columns.
Create the target column by assigning the next day's closing price as the
prediction label for supervised learning.
Clean the data by addressing missing values, outliers, and inconsistencies.
Normalize or scale the data for improved model convergence and
performance.
Split the data into training and validation sets, preserving chronological
order..
1. Data Preparation and Cleaning:
2. Data Preprocessing:
Approach
5. Convert non-indicator columns into time series inputs to capture temporal
patterns.
Split the data into training and validation sets, preserving the temporal
order.
Preprocess and normalize the data for LSTM network input.
Design the LSTM model with appropriate architecture, including hidden
layers, LSTM units, dropout rates, and activation functions.
Define the loss function and optimizer for model training and parameter
optimization.
Train the LSTM model on the training data, optimizing weights and biases.
Monitor model performance on the validation set using metrics like MSE or
RMSE.
Analyze learning curves and adjust hyperparameters as needed.
Validate the model's generalization using unseen data.
Assess model performance with metrics such as R-squared, MAE, or
directional accuracy to evaluate its effectiveness in stock price prediction.
3. LSTM Model Development:
4. Prediction and Evaluation:
Model Development and Evaluation
6. Continuously monitor model performance and effectiveness.
Update models with new data to ensure reliability.
Assess model performance against real-time stock price data.
Present results and insights in a clear and understandable manner.
Visualize predicted and actual stock prices for comparison.
Enhance understanding of the model's performance.
Summarize the project, highlighting the significance of using indicators and
historical data for stock market prediction.
Discuss the potential applications and benefits of accurate stock price
predictions, such as portfolio management, risk assessment, and trading
strategies.
Mention possible avenues for future enhancements, such as incorporating
additional indicators, exploring alternative machine learning algorithms, or
leveraging natural language processing (NLP) techniques for sentiment
analysis.
5. Monitoring and Updating:
6. Reporting and Visualization:
7. Conclusion and Future Scope:
Implications and Future Directions
7. in this step tweets are scraped from twitter using the symbol names of the stocks.
in this step tweets are preprocessed using different methods to obtain the clean and proper data on
which we can train model to get the high accuracy.
1.) Scrapping of tweets:
2.) Preprocessing of tweets:
There are main four steps in the process of stock price prediction:
Technical steps
8. Long Short-Term Memory (LSTM) is a type of recurrent neural network (RNN) that has become popular for predicting stock
prices. LSTMs are designed to process and predict sequences of data, making them well-suited for time series analysis, such as
stock price prediction.
In stock price prediction using LSTM, the historical stock prices are used as input data, and the output is the predicted stock
price for a future time period. LSTMs can process sequences of historical stock prices and capture the complex relationships
between them to predict future prices.
LSTMs work by using memory cells and gates to process and store information. The memory cells can remember information
for a long time, allowing the network to capture long-term dependencies in the data. The gates control the flow of
information into and out of the memory cells, allowing the network to selectively remember or forget information.
In LSTM-based stock price prediction, the input data is first preprocessed and transformed into a format that can
be fed into the LSTM model. The input data is typically normalized to a standard range, such as between 0 and 1, to
improve the performance of the model. The LSTM model is then trained on the historical stock price data, and the
model weights are adjusted to minimize the prediction error.
Once the LSTM model is trained, it can be used to make predictions about future stock prices. The model takes the
most recent historical prices as input and generates a prediction for the future price. The prediction is then
compared to the actual price to evaluate the accuracy of the model.
LSTM-based stock price prediction can be a powerful tool for investors and traders, allowing them to make
informed decisions about buying and selling stocks. However, it is important to note that stock prices are
influenced by many factors, and LSTM-based predictions should be used in conjunction with other analysis
techniques to make informed investment decisions.
LSTM: Capturing Stock Price Trends
9. FINALLY WE GET THE PREDICTED PRICES OF THE STOCKS FOR THE NEXT DAY.
Performance Evaluation: Analyzing Output