This document summarizes a project that aimed to predict short-term stock market trends after companies release their quarterly earnings reports. The project explored how financial report factors like earnings per share, consensus forecasts, and related news articles might impact stock prices. Models were built using financial data and sentiment analysis of articles, with the best performance being around 70% accuracy predicting stock prices the day after an earnings release. Limitations included a small dataset size and the difficulty of digitizing all factors that influence stock prices. Future work proposed expanding the dataset, improving sentiment analysis, and exploring different SVM kernels.
Forecasting Techniques - Data Science SG Kai Xin Thia
Presentation by Kai Xin on techniques learnt from Forecasting - Principles and Practice book: www.otexts.org/fpp
Cover techniques like Seasonal and Trend decomposition using Loess (STL), Holts-Winters, ARIMA etc. R code adapted from the book is available at:
https://github.com/thiakx/Forecasting_DSSG
Stock Price Trend Forecasting using Supervised LearningSharvil Katariya
The aim of the project is to examine a number of different forecasting techniques to predict future stock returns based on past returns and numerical user-generated content to construct a portfolio of multiple stocks in order to diversify the risk. We do this by applying supervised learning methods for stock price forecasting by interpreting the seemingly chaotic market data.
Bill Carr, Senior Director, Transmission Analysis at Dynegy, uses AURORAxmp for short term, day-ahead forecasting.
In this presentation, he describes how AURORAxmp is front-loaded with transmission data from OASIS sites, with load, outage, fuel pricing and weather data from third-party vendors, and with load and fuel pricing and weather data from internal resources. The model is updated manually and automatically via linked data tables.
The updated model runs using AURORAxmp’s output templates. AURORAxmp gathers day-ahead and realtime numbers from the major trading hubs, and Carr reviews the numbers to make sure they make sense for the modeled time period.
In Stock Market Prediction, the aim is to predict the future value of the financial stocks of a company. The recent trend in stock market prediction technologies is the use of machine learning which makes predictions based on the values of current stock market indices by training on their previous values. Machine learning itself employs different models to make prediction easier and authentic.
The aim of the project is to determine the forecasting techniques to determine future stock prices of IT stocks using time series analysis & determining the maximum risk involved using Monte Carlo techniques
This lesson begin with explaining the simple exponential smoothing method characteristics, and uses. Simple exponential smoothing method attempts to best fit a smoothing constant to past data. Using an example and the forecasting process, we apply the simple exponential smoothing method to create a model and forecast based upon it.
This lesson begins with background information about forecasting and continues discussing the forecasting process. We concentrate on four main steps: set an objective, build model, evaluate model, and use model.
This project aims to provide accurate and reliable predictions for stock prices using the power of LSTM (Long Short-Term Memory) and ARIMA (AutoRegressive Integrated Moving Average) models. By analyzing historical stock data and leveraging the capabilities of these advanced forecasting models, we help investors and traders make informed decisions and optimize their investment strategies.
The project workflow begins with gathering comprehensive historical stock price data, including open, high, low, and closing prices, as well as trading volumes and other relevant features. This data is then preprocessed to handle missing values, outliers, and any other inconsistencies that may impact the accuracy of the predictions.
For time series analysis and forecasting, we employ the LSTM model, a variant of recurrent neural networks (RNNs) known for their ability to capture long-term dependencies in sequential data. LSTM models have proven to be highly effective in capturing the complex patterns and trends present in stock price data. By training the LSTM model on historical stock data, we can predict future stock prices with a high degree of accuracy.
In addition to LSTM, we utilize the ARIMA model, a widely used statistical method for time series forecasting. ARIMA models capture the autoregressive, moving average, and integrated components of a time series, allowing us to capture both short-term and long-term trends in stock prices. By incorporating the ARIMA model into our prediction pipeline, we further enhance the accuracy and reliability of our forecasts.
To evaluate the performance of our models, we use appropriate evaluation metrics such as mean absolute error (MAE), root mean squared error (RMSE), and mean absolute percentage error (MAPE). These metrics provide insights into the effectiveness of our models and help us fine-tune the parameters for optimal performance.
The Stock Price Prediction project using LSTM and ARIMA models represents our commitment to leveraging advanced machine learning and statistical techniques to provide valuable insights in the financial domain. By accurately forecasting stock prices, we empower investors and traders to make data-driven decisions, mitigate risks, and optimize their investment strategies. This project showcases our expertise in time series analysis, deep learning, and statistical modeling, and our dedication to delivering solutions that drive tangible business outcomes in the financial sector.
Prediction of customer propensity to churn - Telecom IndustryPranov Mishra
The aim of this project is to help a telecom company with insights on customer behavior that would be useful for retention of customers. The specific goals expected to be achieved are given below
1. Identification of the top variables driving likelihood of churn
2. Build a predictive model to identify customers who have highest probability to terminate services with the company.
3. Build a lift chart for optimization of efforts by targeting most of the potential churns with least contact efforts. Here with 30% of the total customer pool, the model accurately provides 33% of total potential churn candidates.
Models tried to arrive at the best are
1. Simple Models like Logistic Regression & Discriminant Analysis with different thresholds for classification
2. Random Forest after balancing the dataset using Synthetic Minority Oversampling Technique (SMOTE)
3. Ensemble of five individual models and predicting the output by averaging the individual output probabilities
4. Xgboost algorithm
What we do; predictive and prescriptive analyticsWeibull AS
Prescriptive Analytics goes beyond descriptive, diagnostic and predictive analytics; by being able to recommend specific courses of action and show the likely outcome of each decision.
Predictive analytics will tell what probably will happen, but will leave it up to the client to figure out what to do with it.
Prescriptive analytics will also tell what probably will happen, but in addition: when it probably will happen and why it likely will happen, thus how to take advantage of this predictive future. Since there are always more than one course of action prescriptive analytics have to include: predicted consequences of actions, assessment of the value of the consequences and suggestions of the actions giving highest equity value for the company.
EAD Parameter : A stochastic way to model the Credit Conversion FactorGenest Benoit
This white paper aims at estimating credit risk by modelling the Credit Conversion Factor (CCF) parameter related to the Exposure-at-Default (EAD). It has been decided to perform the estimation thanks to stochastic processes instead of usual statistical methodologies (such as classification tree or GLM).
Our paper will focus on two types of model: the Ornstein Uhlenbeck (OU) model – part of ARMA model types – and the Geometric Brownian Movement (GBM) model. First, we will describe, then implement and calibrate each model to ensure relevance and robustness of our results. Then, we will focus on GBM model to model CCF.
everis Marcus Evans FRTB Conference 23Feb17Jonathan Philp
everis was Gold Sponsor of the Marcus Evans Conference ‘4th Edition: Impact of the Fundamental Review of the Trading Book’ at Canary Wharf, London on 23-24th February 2017.
This was a timely opportunity to catch up with banks and solution partners as we move into the implementation phase of Fundamental Review of the Trading Book (FRTB) programmes. We heard views and case studies across a range of topics including market risk methodology, operating model definition and data and systems architecture design.
Our presentation at the conference focused on the architectural challenges posed by FRTB.
Similar to Stock Market Trends Prediction after Earning Release.pptx (20)
Stock Market Trends Prediction after Earning Release.pptx
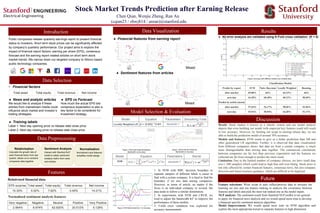
1. Figure. SVM Kernel Gamma Γ vs Accuracy
Stock Market Trends Prediction after Earning Release
Chen Qian, Wenjie Zheng, Ran An
(cqian23 / zhwj814 / anran)@stanford.edu
Public companies release quarterly earnings report to present financial
status to investors. Short term stock prices can be significantly affected
by company’s quarterly performance. Our project aims to explore the
impact of financial report factors, earning per share (EPS), consensus
forecast and the earning report related articles on short term stock
market trends. We narrow down our targeted company to Silicon based
public technology companies.
Features
Relativized financial data
Data Selection
• Financial factors
Discussion
Future
Result: Stock market is known as a chaotic system and our model analysis
depicts that even building our model with empirical key features could still result
in low accuracy. However, by limiting our scope to earning release day, we are
able to build the prediction model of around 70% accuracy.
Total asset Total equity Total revenue Net income
EPS surprise Total asset Total equity Total revenue Net income
15.30% 5.52% 7.82% -3.45% 14.21%
Very negative Negative Neutral Positive Very Positive
2.564% 8.974% 62.820% 20.512% 5.128%
Normalized sentiment analysis features
Data Preprocessing
Relativisation
Calculate the growth rate of
each financial factor from last
quarter, allows us to combine
companies data together.
Sentiment Analysis
Interact with Stanford NLP
toolkit to obtain sentiment
analysis matrix from news
and articles.
Normalization
Normalized input features
simplifies model design.
● EPS vs Forecast
How much the actual EPS bits
consensus expectation is also a
key factor to be considered for
investment strategy.
● News and analytic articles
We would like to analyze if these
articles from mainstream media could
influence stock market and investor’s
trading strategies.
● Financial features from earning report
Mixed
● Sentiment features from articles
Mixed
Model Selection & Evaluation
Introduction Results
Model Equation Parameters Smoothing Tools
Locally Weighted LR Bandwidth Ƭ
Model Equation Parameters Kernel
SVM Bandwidth Γ
Figure. LWLR with financial features:
Bandwidth vs Accuracy
Figure. LWLR with NLP features:
Bandwidth vs Accuracy
● Training labels
Label 1: Next day opening price vs release date close price
Label 2: Next day closing price vs release date close price
● All error analysis are validated using K-Fold cross validation (K = 5)
Data Visualization
Models and features: SVM seems to give us a better prediction than NB and
other generalized LR algorithms. Further, it is observed that data visualization
from different companies shows that data set from a certain company is much
more distinguishable than mixing data together. The commercial correlations
between companies are far less than previous expectation and the features we
collected are far from enough to predict the stock trend.
Limitation: Due to the limited number of company choices, we have small data
size (~300 samples) which could lead to high bias and over-fitting. Stock price is
not only affected by certain financial features, consensus news, but also company
direction and future business guidance, which are difficult to be digitized.
Figure. Accuracy with different models over multiple tests
Feature selections: Write script to auto collect/process data to increase the
learning set size and use feature ranking to analysis the covariance between
features and labels and pick the most top ranked one as the model inputs.
NLP analysis: The sentiment result from Stanford NLP toolkit is too general
to apply for financial news analysis and we would spend more time to develop
a financial specific sentiment analysis algorithm.
Model Improvement: We would spend more time on SVM algorithm and
explore the most appropriate kernel to separate features in high dimension.
Classification Models
Predict by report SVM Naïve Bayesian Locally Weighted Boosting
after-market 69.80% 66% 64.15% 66%
next-day 64.20% 60.30% 68.12% 58.30%
Predict by article (norm)
after-market 57.64% 52.17% 58.96% 53.96%
next-day 54.91% 50.94% 64.38% 52.17%
1. In SVM with RBF, decision boundary to
separate samples of different labels is easier to
find with a certain company. It is hard to find the
boundary if we mix data among companies.
However, in terms of article, no matter if the
focus is on individual company or several, the
data tends to follow a similar distribution.
2. In experiments with SVM and LWLR, we
tried to adjust the bandwidth 𝛕/Γ to improve the
performance of these models.
3. 5-fold cross validation was exploited for
accuracy measurement