Recommended

Recommended
More Related Content
Recently uploaded
Recently uploaded (20)
Featured
Featured (20)
Facts and Figures from the Bar Examiner Winter 2018
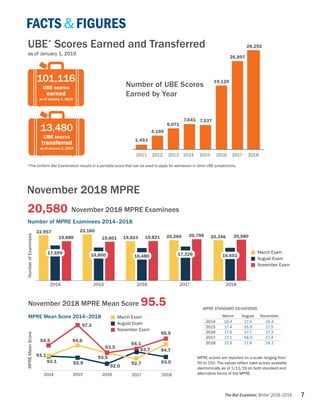
- 1. FACTS&FIGURES UBE* Scores Earned and Transferred as of January 1, 2019 101,116 UBE scores earned as of January 1, 2019 13,480 UBE scores transferred as of January 1, 2019 Number of UBE Scores Earned by Year 28,292 26,897 19,120 7,641 7,537 6,071 4,105 1,453 2011 2012 2013 2014 2015 2016 2017 2018 *The Uniform Bar Examination results in a portable score that can be used to apply for admission in other UBE jurisdictions. November 2018 MPRE 20,580 November 2018 MPRE Examinees Number of MPRE Examinees 2014–2018 22,957 23,160 2017 20,260 20,798 20,580 17,326 2018 20,346 16,651 2016 19,823 16,480 19,821 2015 16,800 19,601 2014 17,699 19,888 NumberofExaminees n March Exam n August Exam n November Exam November 2018 MPRE Mean Score 95.5 MPRE Mean Score 2014–2018 n March Exam n August Exam n November Exam 93.5 93.5 92.0 93.1 92.9 93.1 94.694.5 97.3 94.1 94.7 95.5 93.0 93.7 92.7 MPREMeanScore 2014 2015 2016 2017 2018 MPRE STANDARD DEVIATIONS March August November 2014 16.4 17.0 16.4 2015 17.4 16.9 17.5 2016 17.6 17.7 17.3 2017 17.1 18.0 17.4 2018 17.9 17.8 18.2 MPRE scores are reported on a scale ranging from 50 to 150. The values reflect valid scores available electronically as of 1/11/19 on both standard and alternative forms of the MPRE. The Bar Examiner, Winter 2018–2019 7