Download as PDF, PPTX


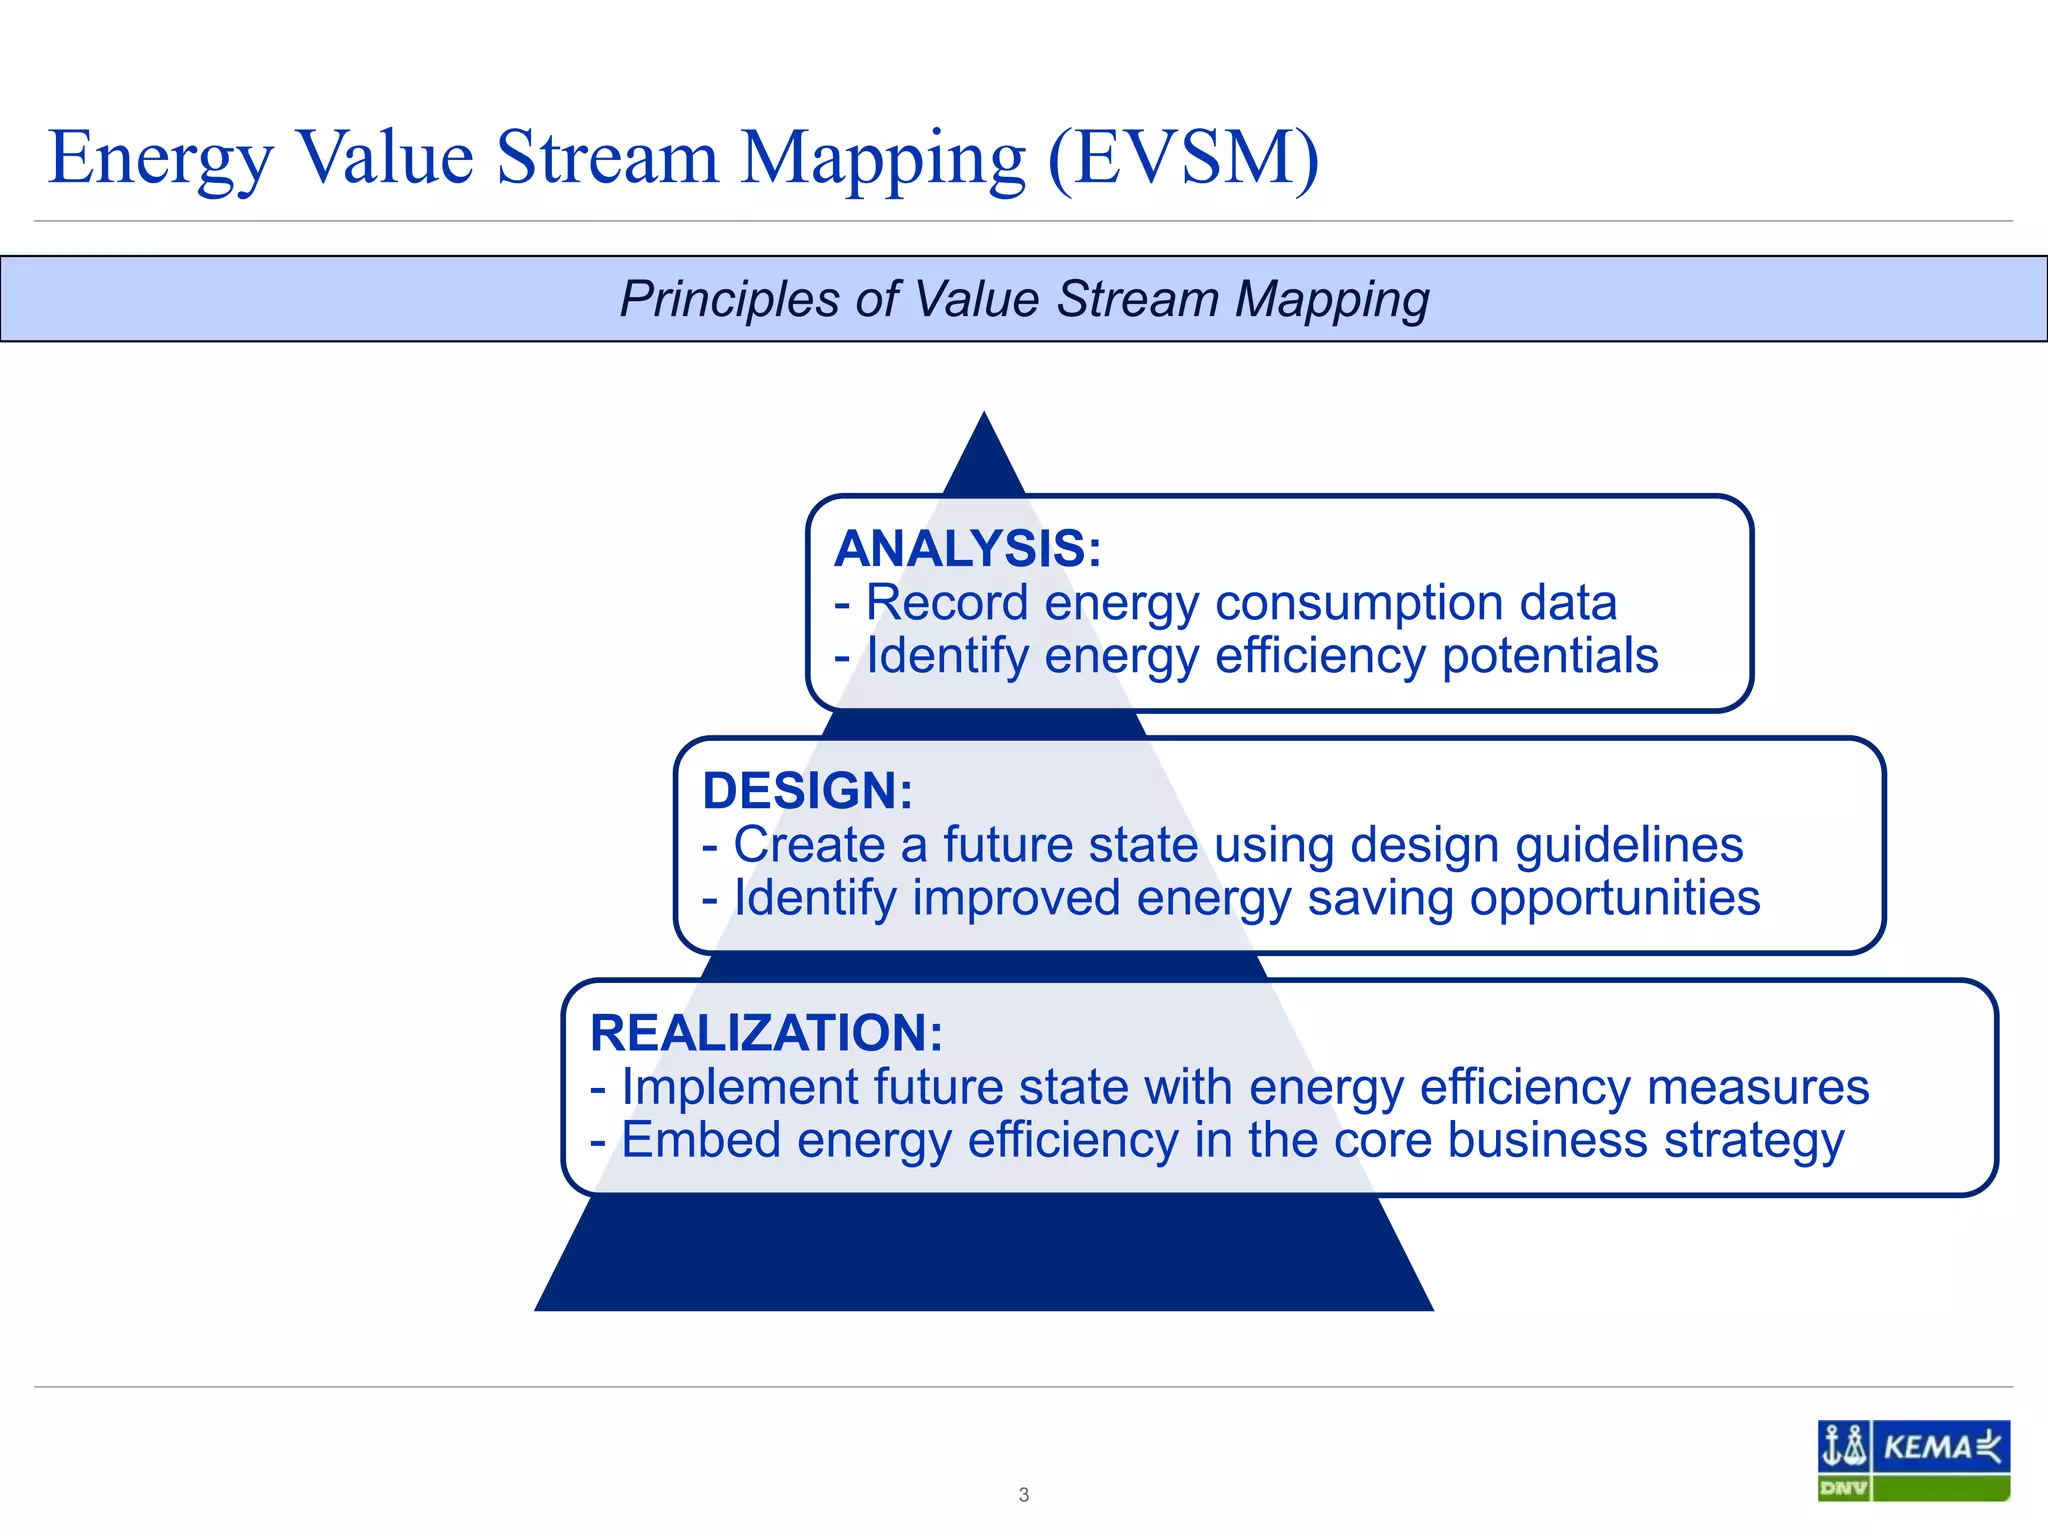

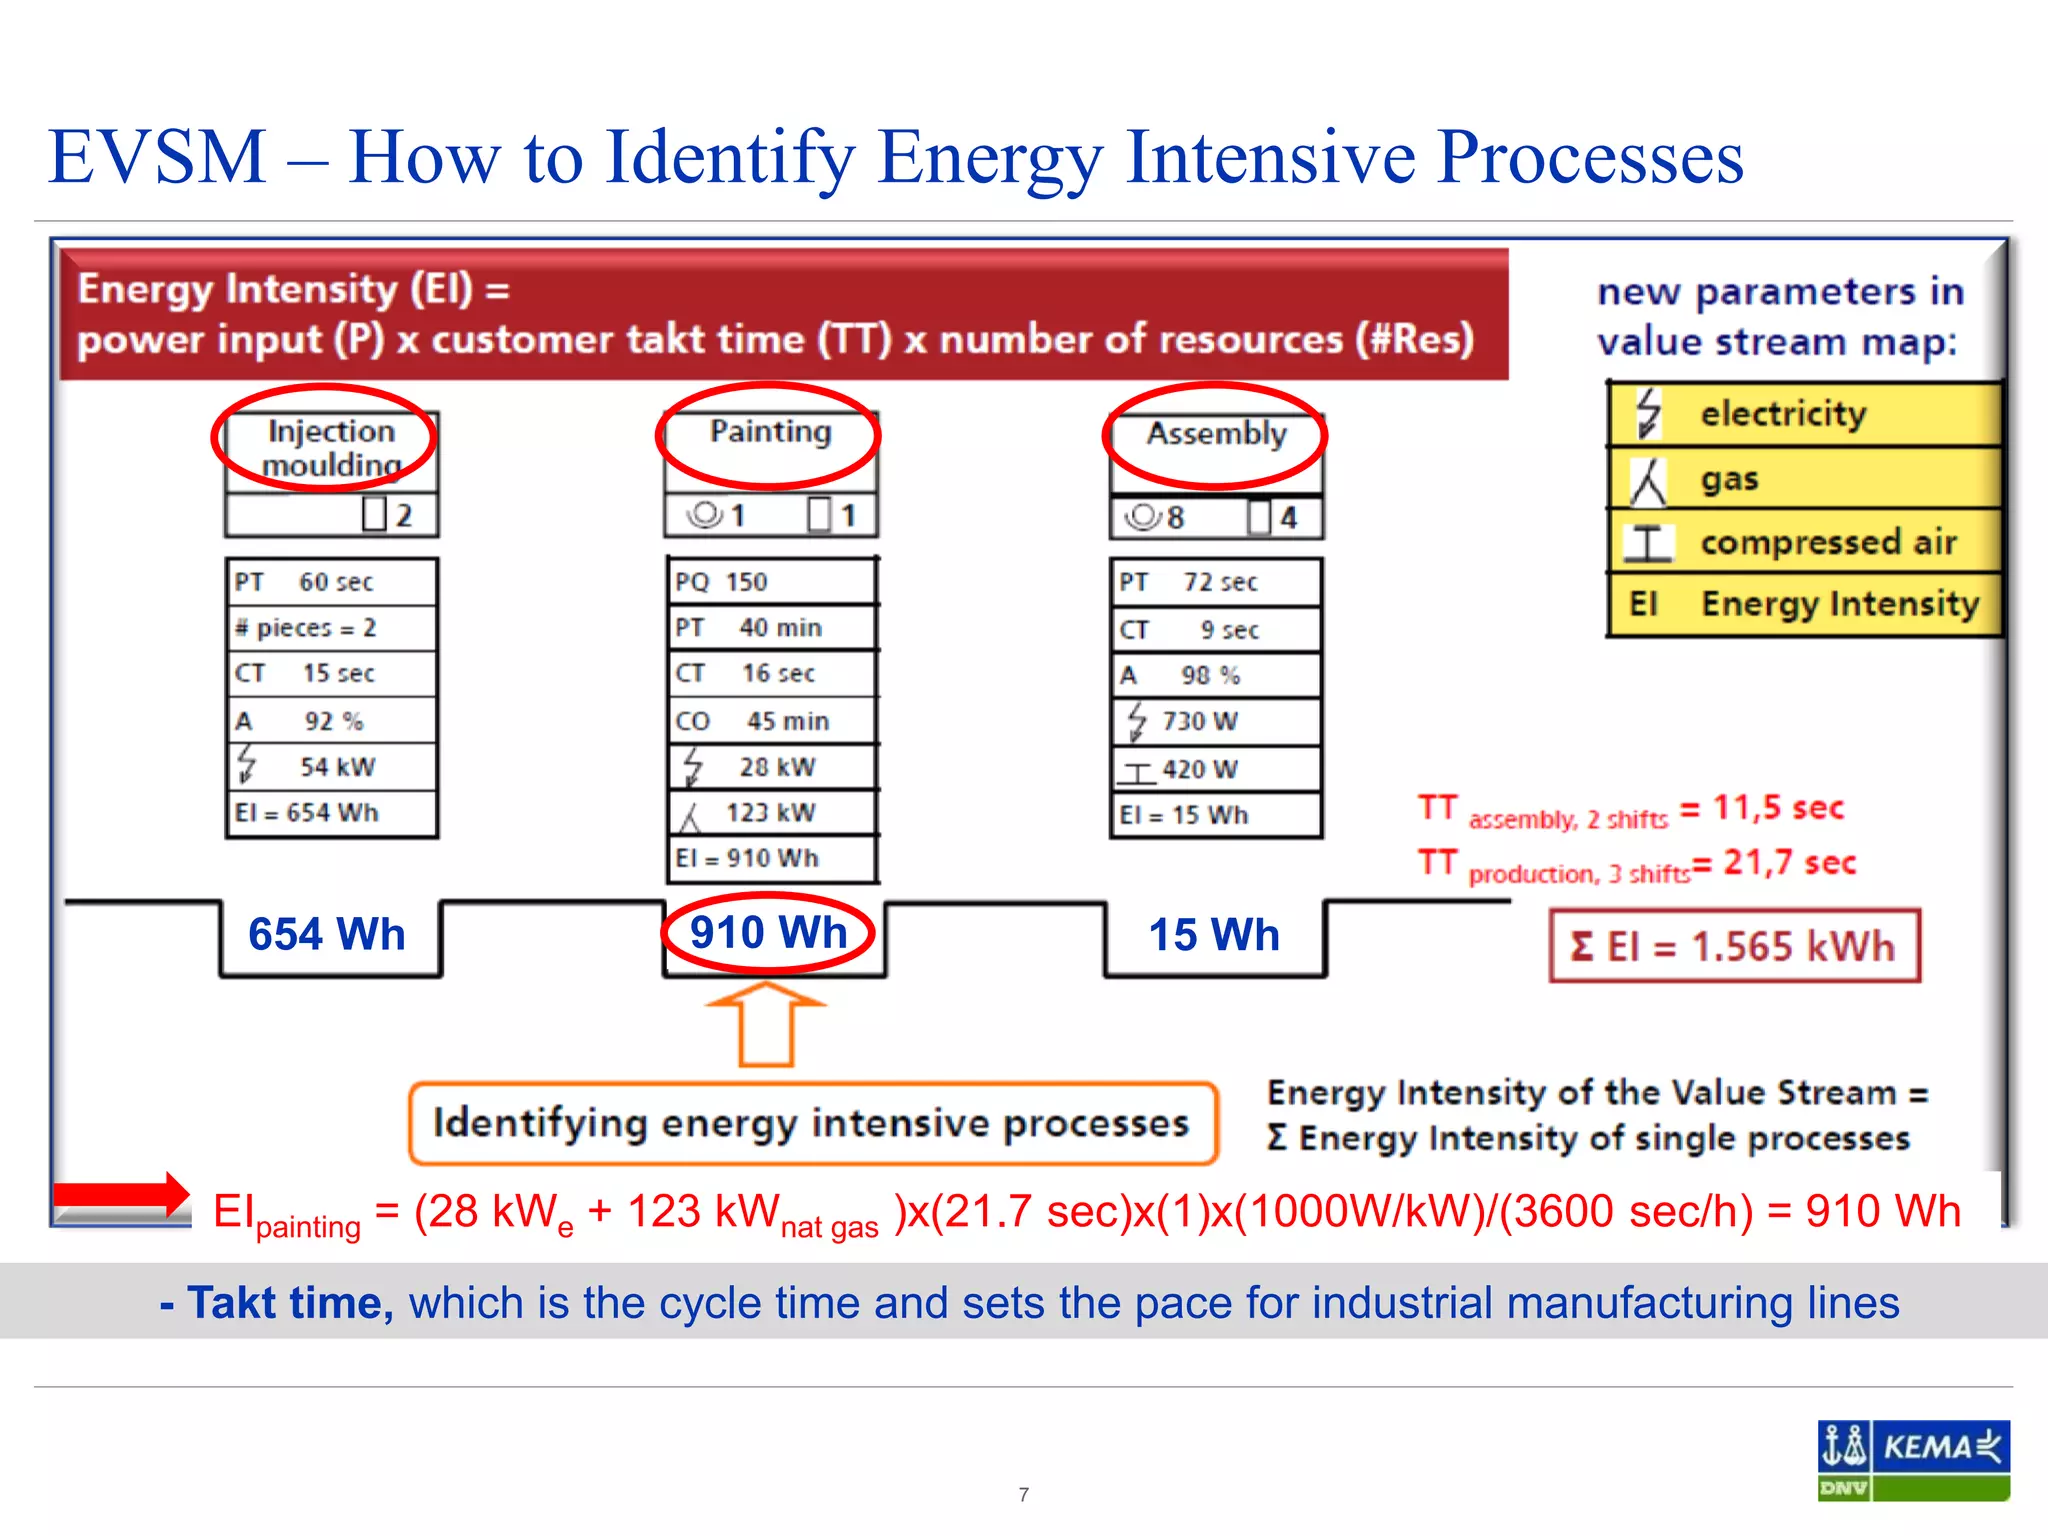
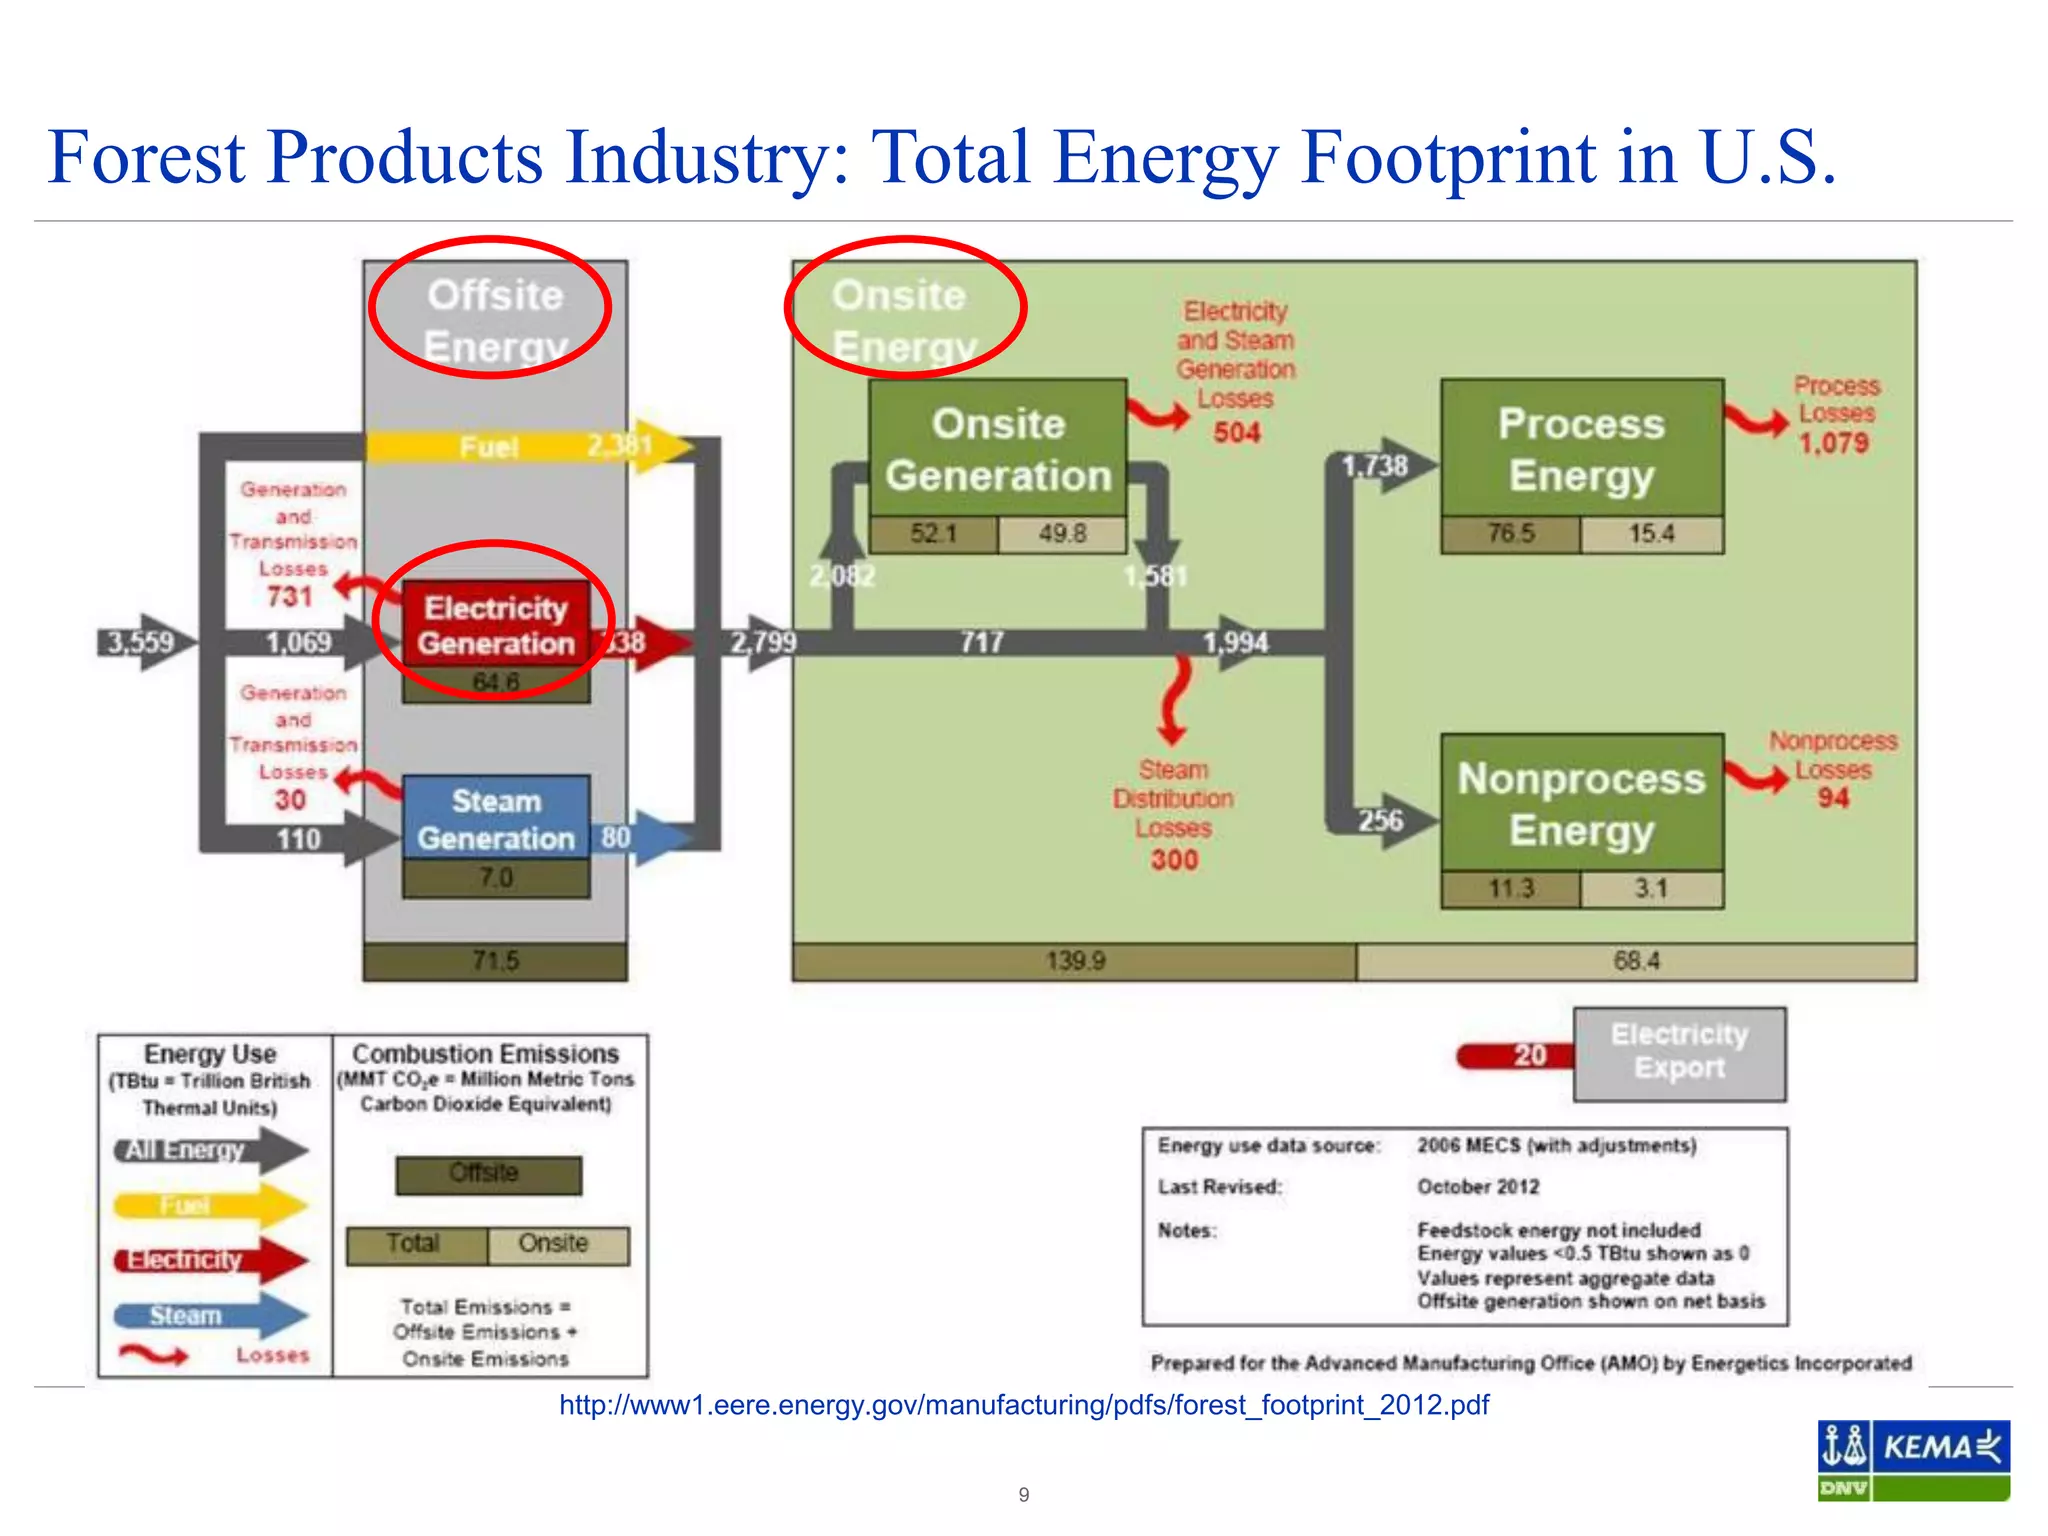


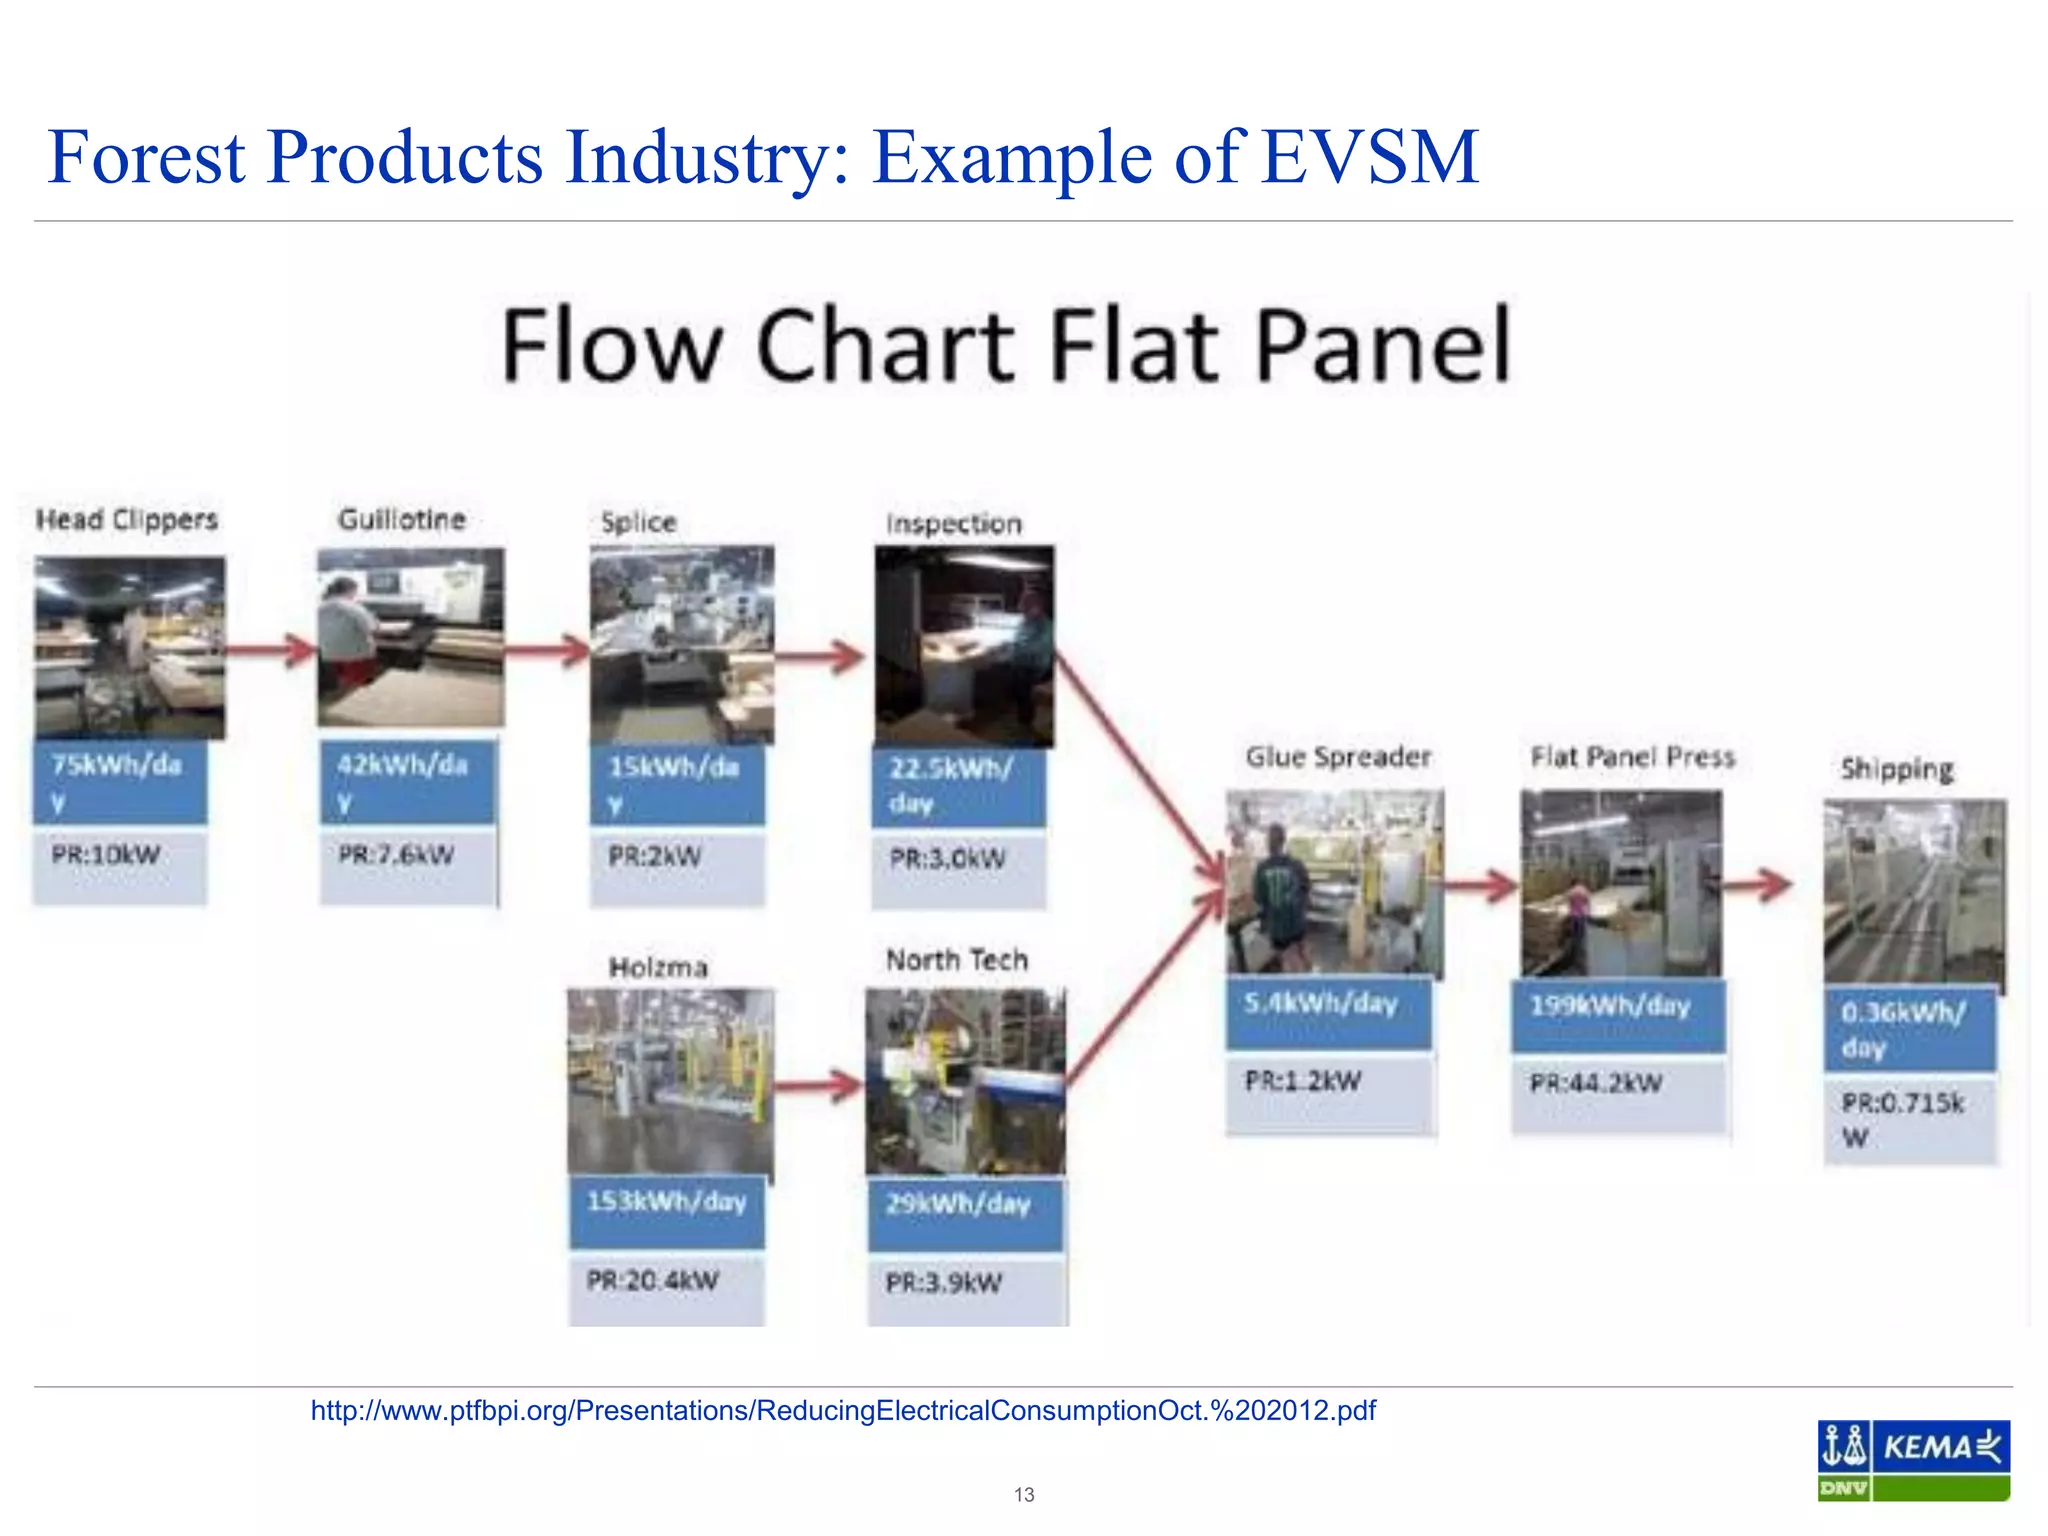
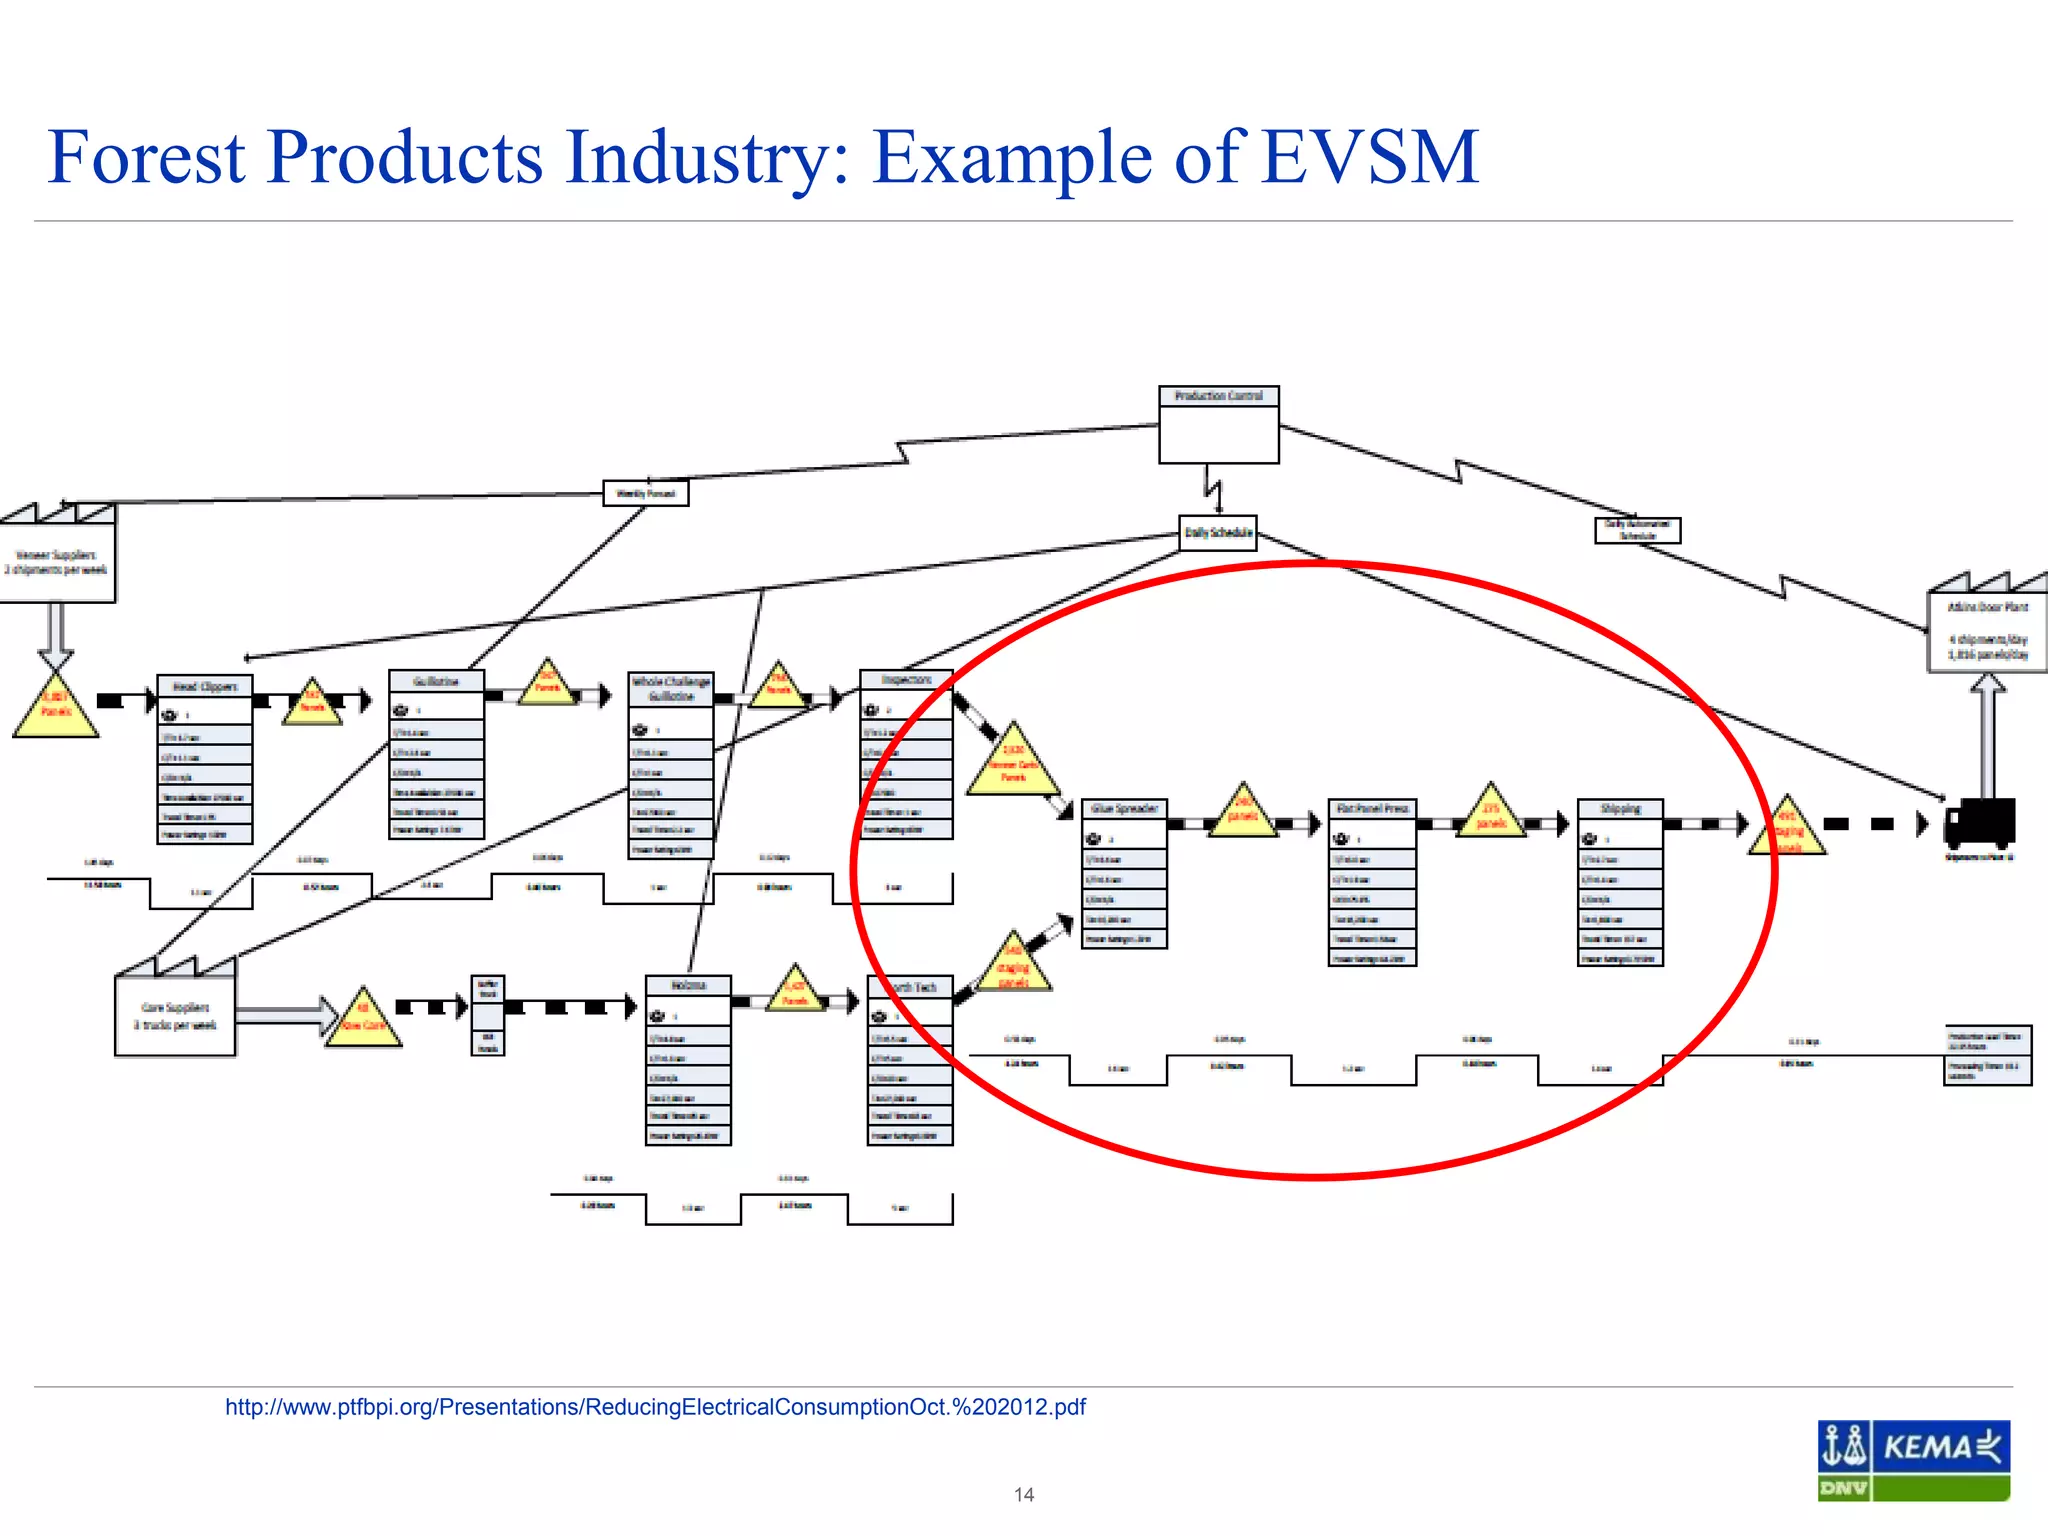


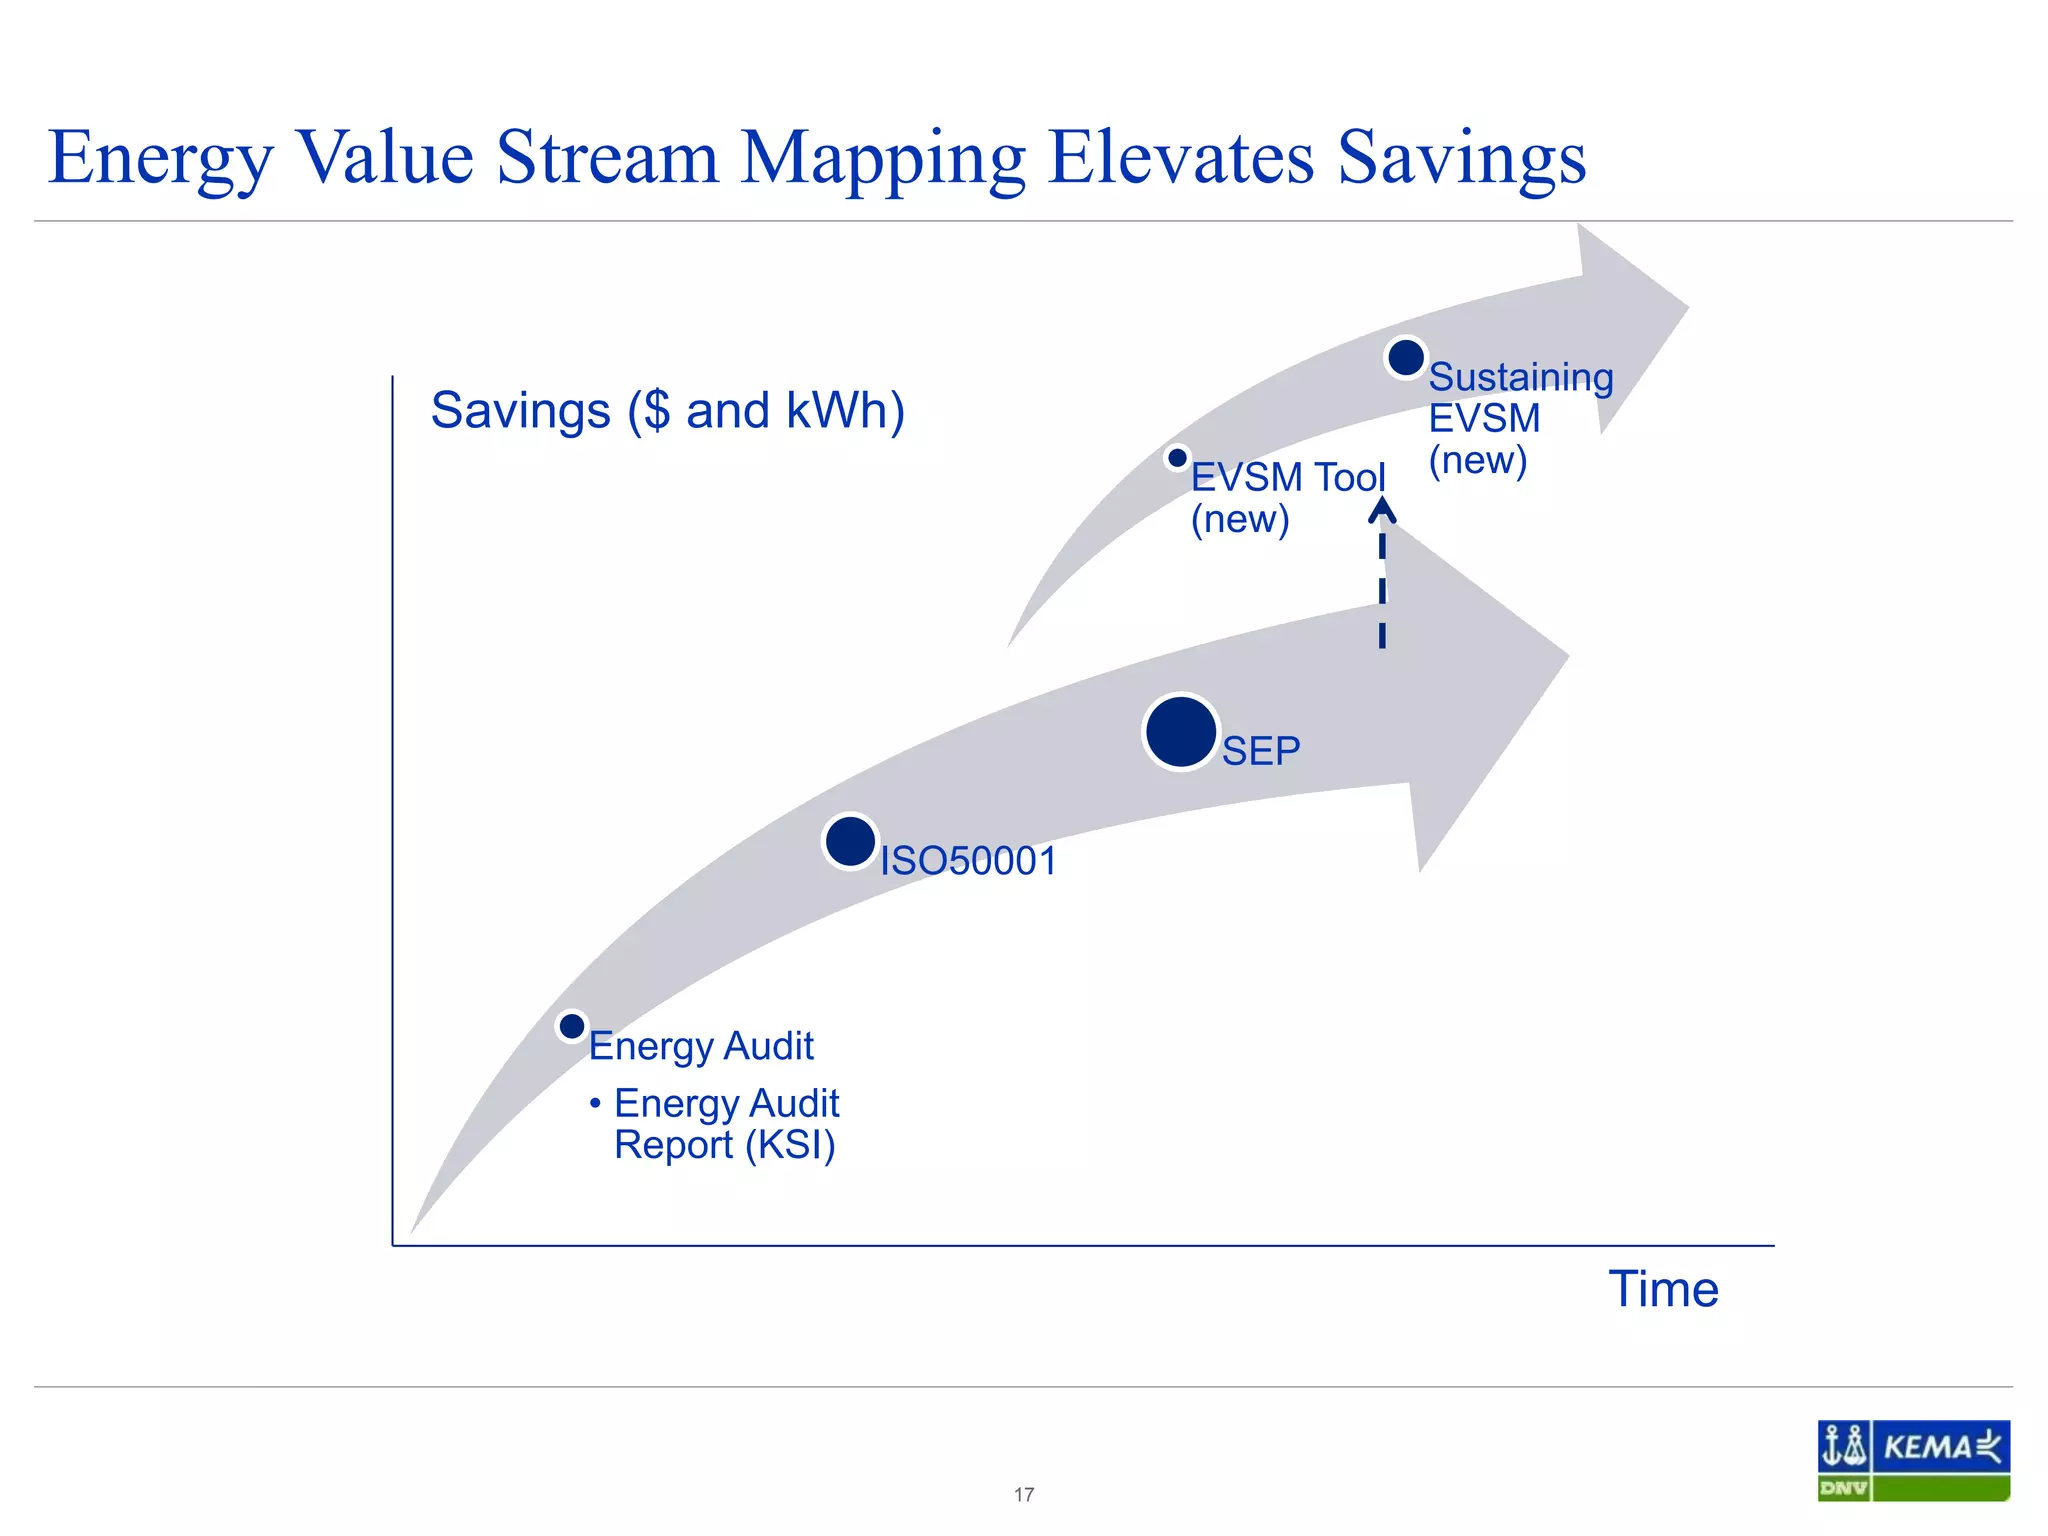


This document discusses energy value stream mapping (EVSM) as an application of lean manufacturing principles to identify energy efficiency opportunities in energy-intensive industries. It provides an overview of EVSM, including its three main steps: analysis of current energy consumption data, design of an improved future state, and realization through implementation of energy efficiency measures. The document also provides examples of how EVSM has been used in forest product industries to reduce electrical consumption and two case studies calculating energy intensity in industrial processes.


