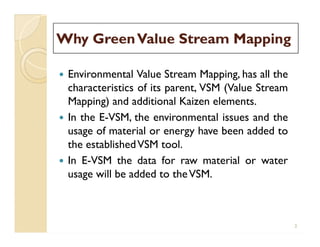
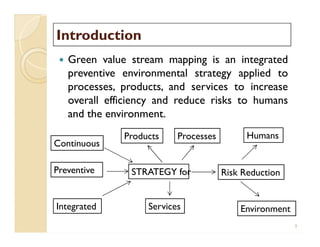
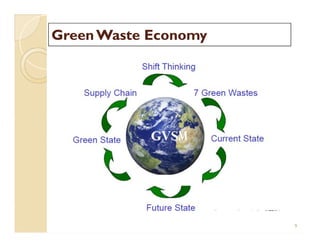
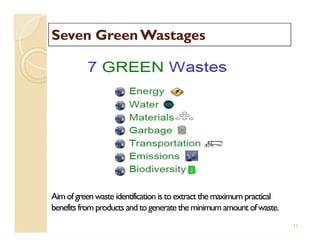
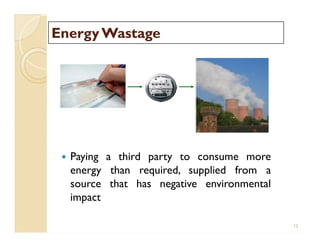
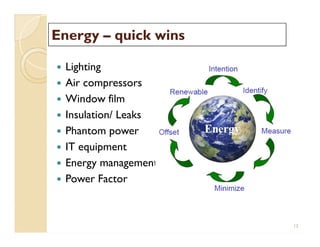
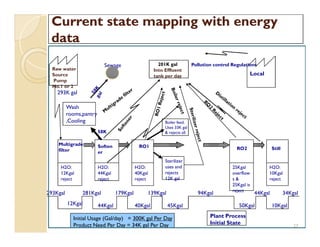
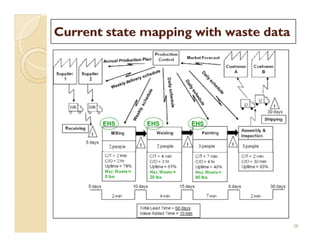
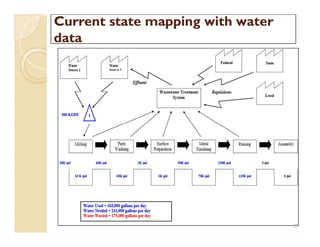
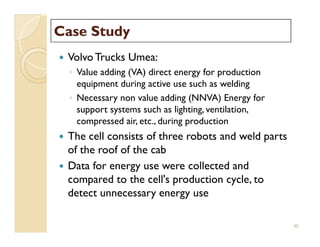
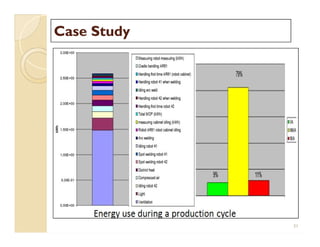
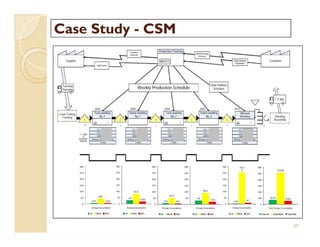
Green Value Stream
Mapping
Green Value Stream
Mapping
Presented by:
Manish KUMAR
Why GreenValue Stream MappingWhy GreenValue Stream Mapping
 Environmental Value Stream Mapping, has all the
characteristics of its parent, VSM (Value Stream
Mapping) and additional Kaizen elements.
 In the E-VSM, the environmental issues and the
usage of material or energy have been added to
the establishedVSM tool.
 In E-VSM the data for raw material or water
usage will be added to theVSM.
2
IntroductionIntroduction
 Green value stream mapping is an integrated
preventive environmental strategy applied to
processes, products, and services to increase
overall efficiency and reduce risks to humans
and the environment.
 Green value stream mapping is an integrated
preventive environmental strategy applied to
processes, products, and services to increase
overall efficiency and reduce risks to humans
and the environment.
3
Continuous
Preventive
Integrated
STRATEGY for
Products Processes
Services
Risk Reduction
Humans
Environment
IntroductionIntroduction
 Green VSM means designing and managing
products and processes to reduce the volume
and toxicity of waste and materials, conserve
and recover all resources, and not burn or
bury them.
 Green production systems requires efficient
production and low use of resources such as
energy, material etc. To achieve this, there is a
need for further development of continuous
improvement tools in the “lean and green”
area. This work deals with environmental value
stream mapping.
4
Passive Environmental strategies
Dilute & disperse
Reactive Environmental StrategiesReactive Environmental Strategies
End-of-pipe approaches
6
Proactive environmental strategiesProactive environmental strategies
Prevention ofWaste
generation:
- Good housekeeping
- Input substitution
- Better process control
- Equipment modification
-Technology change
- On-site recovery/reuse
- Production of a useful by-
product
- Product modification
Reduce, Reuse, Recycle= Green Waste Identification
GOING BEYOND RECYCLING
7
Prevention ofWaste
generation:
- Good housekeeping
- Input substitution
- Better process control
- Equipment modification
-Technology change
- On-site recovery/reuse
- Production of a useful by-
product
- Product modification
BackgroundBackground
Municipal
Waste
tip of the
“waste
berg”
Waste berg
8
Municipal
Waste
tip of the
“waste
berg” Upstream
manufactur
ing waste is
70 times
greater
Source; Kevin Drew, San Francisco
GreenWaste EconomyGreenWaste Economy
9
M
What is GreenValue Stream MappingWhat is GreenValue Stream Mapping
• Value stream mapping is assumed to be a
potentially effective tool to be developed for
visualizing environmental wastes produced by
production processes. Thereby, the focus of VSM
into EVSM (EnvironmentalValue Stream Mapping)
• The two strategies (green & vsm) can be
integrated and offered simultaneously in the
operation management to reduce both waste and
pollution.
• The mass & energy analysis of a vsm will not be
divided by product families, it will be focused in
the overall impact to the end customer i.e.
environment 10
• Value stream mapping is assumed to be a
potentially effective tool to be developed for
visualizing environmental wastes produced by
production processes. Thereby, the focus of VSM
into EVSM (EnvironmentalValue Stream Mapping)
• The two strategies (green & vsm) can be
integrated and offered simultaneously in the
operation management to reduce both waste and
pollution.
• The mass & energy analysis of a vsm will not be
divided by product families, it will be focused in
the overall impact to the end customer i.e.
environment
Seven GreenWastagesSeven GreenWastages
11
Aimof green waste identification isto extract themaximum practical
benefits from products and to generate the minimum amount of waste.
EnergyWastageEnergyWastage
 Paying a third party to consume more
energy than required, supplied from a
source that has negative environmental
impact
12
EnergyEnergy –– quick winsquick wins
 Lighting
 Air compressors
 Window film
 Insulation/ Leaks
 Phantom power
 IT equipment
 Energy management
 Power Factor
 Lighting
 Air compressors
 Window film
 Insulation/ Leaks
 Phantom power
 IT equipment
 Energy management
 Power Factor
13
WaterWasteWaterWaste
Paying a third party to consume more water than
required, then paying them again to take away
contaminated water and clean it
14
WaterWater-- quick winsquick wins
 Low flow
aerators/Toilets
 Irrigation system
 Leaks
 Jackets for tanks/ pipes
 Bottled vs Filtered
water
 Low flow
aerators/Toilets
 Irrigation system
 Leaks
 Jackets for tanks/ pipes
 Bottled vs Filtered
water
15
Material wasteMaterial waste
 Result of a global design flaw-designing virgin
raw materials for obsolescence and to end up
in landfill
16
Material wasteMaterial waste-- quick winsquick wins
 BOM vs actual
 Recycled vs virgin
 Re use hydraulic
fluids
 Materials exchange
programs
 BOM vs actual
 Recycled vs virgin
 Re use hydraulic
fluids
 Materials exchange
programs
17
Garbage wasteGarbage waste
Paying for something you will only throw away,
something that caused negative environmental
impact to create and then paying again to have it
taken away to a landfill
18
GarbageGarbage-- quick winsquick wins
 Packaging
 Zero waste program
 Re-use
 Material exchange
program
 Re-usable packaging
 Packaging
 Zero waste program
 Re-use
 Material exchange
program
 Re-usable packaging
19
Emissions WasteEmissions Waste
 Paying to create and discharge excessive
amounts of toxic pollutants into the atmosphere
20
Emissions wasteEmissions waste-- quick winsquick wins
 Greener substitutes
 Material minimization
 Indoor plants
21
Bio diversity wasteBio diversity waste
Incurring costs to destroy biodiversity that
result in large negative impacts on the
environment
22
BiodiversityBiodiversity-- quick winsquick wins
 Tree Planting
 Green walls
 Native plants
 Organic landscaping
 Indoor plants
 Tree Planting
 Green walls
 Native plants
 Organic landscaping
 Indoor plants
23
Tools &TechniquesTools &Techniques
Energy
VSM &
ENVSM
24
Energy
VSM &
ENVSM
EnergyVSM (EnEnergyVSM (En--VSM)VSM)
 En-VSM as a tool which has the information and
data about energy usage of each process item
as well as its regular lean data in the value
stream mapping.
 Energy VSM contains the information of the
process and the energy usage of each element
of the process to the developer of the process.
 En-VSM as a tool which has the information and
data about energy usage of each process item
as well as its regular lean data in the value
stream mapping.
 Energy VSM contains the information of the
process and the energy usage of each element
of the process to the developer of the process.
25
EnvironmentVSM(EEnvironmentVSM(E--VSM)VSM)
 Environmental Value Stream Mapping, has all the
characteristics of its parent, VSM (Value Stream
Mapping) and additional Kaizen elements.
 In the E-VSM, the environmental issues and the
usage of material or energy have been added to
the establishedVSM tool.
 In E-VSM the data for raw material or water
usage will be added to theVSM.
26
Current state mapping with energyCurrent state mapping with energy
datadata
Raw water
Source
Pump
No.1 or 2
201K gal
Into Effluent
tank per day
Pollution control Regulations
Local
Boiler feed.
Uses 33K gal
& rejects all.
293K gal
Wash
rooms,pantry
,Cooling
Sewage
27
Plant Process
Initial State
Initial Usage (Gal/day) = 300K gal Per Day
Product Need Per Day = 34K gal Per Day
44Kgal 50Kgal40Kgal
179Kgal 44Kgal
H2O:
12Kgal
reject
Multigrade
filter
H2O:
44Kgal
reject
Soften
er
RO1 RO2
Sterilizer
uses and
rejects
12K gal
Still
H2O:
40Kgal
reject
25Kgal
overflow
s &
25Kgal is
reject
281Kgal293Kgal 94Kgal
12Kgal 10Kgal
58K
L
H2O:
10Kgal
reject
Boiler feed.
Uses 33K gal
& rejects all.
Wash
rooms,pantry
,Cooling
139Kgal
45Kgal
34Kgal
Current state mapping with waste dataCurrent state mapping with waste data
28
Current state mapping with waterCurrent state mapping with water
datadata
29
Case StudyCase Study
 VolvoTrucks Umea:
◦ Value adding (VA) direct energy for production
equipment during active use such as welding
◦ Necessary non value adding (NNVA) Energy for
support systems such as lighting, ventilation,
compressed air, etc., during production
 The cell consists of three robots and weld parts
of the roof of the cab
 Data for energy use were collected and
compared to the cell's production cycle, to
detect unnecessary energy use
30
Case StudyCase Study
31
Case StudyCase Study
 The figure at left shows the energy consumed in a
production cycle for Umea robotic welding, including
energy for production equipment, support systems
(eg. compressed air), and building support systems
(lighting, ventilation).To the right, energy use is
classified asVA, NVA, NNVA.
 The following activities were identified to have
significant improvement potential
 Idling on production equipment (11% NVA)
 Evaluation of the lighting and ventilation(long term
perspective), which accounts for 57% of total energy
use
32
Case StudyCase Study
 A practical method for GreenVSM has been
developed, with a proposal to work in teams with
a three step model
◦ Start of work and data collection
◦ Compilation and analysis- GreenVSM is compiled &
compiled asVA, NNVA, NVA
◦ General conclusions-It provides a holistic view and a
reduced risk of sub-optimization of
environment/production improvement
 Collecting both the data simultaneously is easier rather taking
differently at different time
33
Case StudyCase Study
Local environmental parameters with different production processes
34
Case StudyCase Study
 Surface treatment
◦ Local environmental parameters essential for a work
station for surface treatment are energy use, powder
consumption, paint, re-circulated powder, cassation,
efficiency, conveyer-capacity, cost and also the amount of
carbon dioxide.
 Heat treatment
◦ Environmental parameters essential for a work station for
heat treatment are energy consumption (electric energy,
gas, other), protective gas, chemicals (detergents, heat
treatment liquids)
35
Case StudyCase Study
 Machining
◦ Parameters essential for a work station for machining are
utilization of process liquids, energy consumption during
production and during down-time (stand by-losses), waste
water and other waste
 Assembly
◦ Parameters essential for a work station for assembly are
handling waste, energy consumption in tools and supporting
processes (e.g. pneumatic), reduction of spill and leakage,
energy consumption during down time are parameters that
are possible to influence within a team area.
36
Case StudyCase Study -- CSMCSM
37
Case StudyCase Study-- ConclusionConclusion
 Conclusion-
◦ It is important to identify local environmental
parameters also from the production personnel’s
perspective and then link them to the company’s
overall environmental work and parameters within the
plant/company. Cross functional collaboration also with
suppliers is important both for the results and to
increase participation in the improvement and
development work.
38
Where to useWhere to use
 Manufacturing
 Energy efficiency
 Non manufacturing
◦ Health care & other services
◦ Administrative
◦ Government
 Supply chain
 Design of products & processes
 Manufacturing
 Energy efficiency
 Non manufacturing
◦ Health care & other services
◦ Administrative
◦ Government
 Supply chain
 Design of products & processes
39
BenefitsBenefits
 Reduce Energy-Related Costs
◦ Energy and water costs are a prime concern for
manufacturers.
 Environmental Benefits
◦ The goal of green & lean manufacturing is to reduce
wastage nearly to zero, helping ecology and reduce
pollution.
 Boost Workforce Morale and Innovations
◦ Sustainability improvements are a collaborative
effort. When employees work together to identify
and implement green and sustainable initiatives, it
fosters a culture of teamwork and continuous
improvement.
40
BenefitsBenefits
 More useful in the bigger companies because
the process is harder to see in its totality
 Supports “whole-system thinking” rather than
sub-optimisation
 What gets measured, gets done
 Promotes “why-why-why” analysis
 Reduce total cost within supply chain.
 Improves disaster recovery protection.
 Cost savings for business and consumers as a
reusable product/s.
 Improve competitiveness in the industry
41
“To repeat what others have said, requires“To repeat what others have said, requires
education; to challenge it requires brain”education; to challenge it requires brain”

Green Value Stream Mapping

  • 1.
    Green Value Stream Mapping GreenValue Stream Mapping Presented by: Manish KUMAR
  • 2.
    Why GreenValue StreamMappingWhy GreenValue Stream Mapping  Environmental Value Stream Mapping, has all the characteristics of its parent, VSM (Value Stream Mapping) and additional Kaizen elements.  In the E-VSM, the environmental issues and the usage of material or energy have been added to the establishedVSM tool.  In E-VSM the data for raw material or water usage will be added to theVSM.  Environmental Value Stream Mapping, has all the characteristics of its parent, VSM (Value Stream Mapping) and additional Kaizen elements.  In the E-VSM, the environmental issues and the usage of material or energy have been added to the establishedVSM tool.  In E-VSM the data for raw material or water usage will be added to theVSM. 2
  • 3.
    IntroductionIntroduction  Green valuestream mapping is an integrated preventive environmental strategy applied to processes, products, and services to increase overall efficiency and reduce risks to humans and the environment.  Green value stream mapping is an integrated preventive environmental strategy applied to processes, products, and services to increase overall efficiency and reduce risks to humans and the environment. 3 Continuous Preventive Integrated STRATEGY for Products Processes Services Risk Reduction Humans Environment
  • 4.
    IntroductionIntroduction  Green VSMmeans designing and managing products and processes to reduce the volume and toxicity of waste and materials, conserve and recover all resources, and not burn or bury them.  Green production systems requires efficient production and low use of resources such as energy, material etc. To achieve this, there is a need for further development of continuous improvement tools in the “lean and green” area. This work deals with environmental value stream mapping.  Green VSM means designing and managing products and processes to reduce the volume and toxicity of waste and materials, conserve and recover all resources, and not burn or bury them.  Green production systems requires efficient production and low use of resources such as energy, material etc. To achieve this, there is a need for further development of continuous improvement tools in the “lean and green” area. This work deals with environmental value stream mapping. 4
  • 5.
  • 6.
    Reactive Environmental StrategiesReactiveEnvironmental Strategies End-of-pipe approaches 6
  • 7.
    Proactive environmental strategiesProactiveenvironmental strategies Prevention ofWaste generation: - Good housekeeping - Input substitution - Better process control - Equipment modification -Technology change - On-site recovery/reuse - Production of a useful by- product - Product modification Reduce, Reuse, Recycle= Green Waste Identification GOING BEYOND RECYCLING 7 Prevention ofWaste generation: - Good housekeeping - Input substitution - Better process control - Equipment modification -Technology change - On-site recovery/reuse - Production of a useful by- product - Product modification
  • 8.
    BackgroundBackground Municipal Waste tip of the “waste berg” Wasteberg 8 Municipal Waste tip of the “waste berg” Upstream manufactur ing waste is 70 times greater Source; Kevin Drew, San Francisco
  • 9.
  • 10.
    What is GreenValueStream MappingWhat is GreenValue Stream Mapping • Value stream mapping is assumed to be a potentially effective tool to be developed for visualizing environmental wastes produced by production processes. Thereby, the focus of VSM into EVSM (EnvironmentalValue Stream Mapping) • The two strategies (green & vsm) can be integrated and offered simultaneously in the operation management to reduce both waste and pollution. • The mass & energy analysis of a vsm will not be divided by product families, it will be focused in the overall impact to the end customer i.e. environment 10 • Value stream mapping is assumed to be a potentially effective tool to be developed for visualizing environmental wastes produced by production processes. Thereby, the focus of VSM into EVSM (EnvironmentalValue Stream Mapping) • The two strategies (green & vsm) can be integrated and offered simultaneously in the operation management to reduce both waste and pollution. • The mass & energy analysis of a vsm will not be divided by product families, it will be focused in the overall impact to the end customer i.e. environment
  • 11.
    Seven GreenWastagesSeven GreenWastages 11 Aimofgreen waste identification isto extract themaximum practical benefits from products and to generate the minimum amount of waste.
  • 12.
    EnergyWastageEnergyWastage  Paying athird party to consume more energy than required, supplied from a source that has negative environmental impact 12
  • 13.
    EnergyEnergy –– quickwinsquick wins  Lighting  Air compressors  Window film  Insulation/ Leaks  Phantom power  IT equipment  Energy management  Power Factor  Lighting  Air compressors  Window film  Insulation/ Leaks  Phantom power  IT equipment  Energy management  Power Factor 13
  • 14.
    WaterWasteWaterWaste Paying a thirdparty to consume more water than required, then paying them again to take away contaminated water and clean it 14
  • 15.
    WaterWater-- quick winsquickwins  Low flow aerators/Toilets  Irrigation system  Leaks  Jackets for tanks/ pipes  Bottled vs Filtered water  Low flow aerators/Toilets  Irrigation system  Leaks  Jackets for tanks/ pipes  Bottled vs Filtered water 15
  • 16.
    Material wasteMaterial waste Result of a global design flaw-designing virgin raw materials for obsolescence and to end up in landfill 16
  • 17.
    Material wasteMaterial waste--quick winsquick wins  BOM vs actual  Recycled vs virgin  Re use hydraulic fluids  Materials exchange programs  BOM vs actual  Recycled vs virgin  Re use hydraulic fluids  Materials exchange programs 17
  • 18.
    Garbage wasteGarbage waste Payingfor something you will only throw away, something that caused negative environmental impact to create and then paying again to have it taken away to a landfill 18
  • 19.
    GarbageGarbage-- quick winsquickwins  Packaging  Zero waste program  Re-use  Material exchange program  Re-usable packaging  Packaging  Zero waste program  Re-use  Material exchange program  Re-usable packaging 19
  • 20.
    Emissions WasteEmissions Waste Paying to create and discharge excessive amounts of toxic pollutants into the atmosphere 20
  • 21.
    Emissions wasteEmissions waste--quick winsquick wins  Greener substitutes  Material minimization  Indoor plants 21
  • 22.
    Bio diversity wasteBiodiversity waste Incurring costs to destroy biodiversity that result in large negative impacts on the environment 22
  • 23.
    BiodiversityBiodiversity-- quick winsquickwins  Tree Planting  Green walls  Native plants  Organic landscaping  Indoor plants  Tree Planting  Green walls  Native plants  Organic landscaping  Indoor plants 23
  • 24.
    Tools &TechniquesTools &Techniques Energy VSM& ENVSM 24 Energy VSM & ENVSM
  • 25.
    EnergyVSM (EnEnergyVSM (En--VSM)VSM) En-VSM as a tool which has the information and data about energy usage of each process item as well as its regular lean data in the value stream mapping.  Energy VSM contains the information of the process and the energy usage of each element of the process to the developer of the process.  En-VSM as a tool which has the information and data about energy usage of each process item as well as its regular lean data in the value stream mapping.  Energy VSM contains the information of the process and the energy usage of each element of the process to the developer of the process. 25
  • 26.
    EnvironmentVSM(EEnvironmentVSM(E--VSM)VSM)  Environmental ValueStream Mapping, has all the characteristics of its parent, VSM (Value Stream Mapping) and additional Kaizen elements.  In the E-VSM, the environmental issues and the usage of material or energy have been added to the establishedVSM tool.  In E-VSM the data for raw material or water usage will be added to theVSM.  Environmental Value Stream Mapping, has all the characteristics of its parent, VSM (Value Stream Mapping) and additional Kaizen elements.  In the E-VSM, the environmental issues and the usage of material or energy have been added to the establishedVSM tool.  In E-VSM the data for raw material or water usage will be added to theVSM. 26
  • 27.
    Current state mappingwith energyCurrent state mapping with energy datadata Raw water Source Pump No.1 or 2 201K gal Into Effluent tank per day Pollution control Regulations Local Boiler feed. Uses 33K gal & rejects all. 293K gal Wash rooms,pantry ,Cooling Sewage 27 Plant Process Initial State Initial Usage (Gal/day) = 300K gal Per Day Product Need Per Day = 34K gal Per Day 44Kgal 50Kgal40Kgal 179Kgal 44Kgal H2O: 12Kgal reject Multigrade filter H2O: 44Kgal reject Soften er RO1 RO2 Sterilizer uses and rejects 12K gal Still H2O: 40Kgal reject 25Kgal overflow s & 25Kgal is reject 281Kgal293Kgal 94Kgal 12Kgal 10Kgal 58K L H2O: 10Kgal reject Boiler feed. Uses 33K gal & rejects all. Wash rooms,pantry ,Cooling 139Kgal 45Kgal 34Kgal
  • 28.
    Current state mappingwith waste dataCurrent state mapping with waste data 28
  • 29.
    Current state mappingwith waterCurrent state mapping with water datadata 29
  • 30.
    Case StudyCase Study VolvoTrucks Umea: ◦ Value adding (VA) direct energy for production equipment during active use such as welding ◦ Necessary non value adding (NNVA) Energy for support systems such as lighting, ventilation, compressed air, etc., during production  The cell consists of three robots and weld parts of the roof of the cab  Data for energy use were collected and compared to the cell's production cycle, to detect unnecessary energy use  VolvoTrucks Umea: ◦ Value adding (VA) direct energy for production equipment during active use such as welding ◦ Necessary non value adding (NNVA) Energy for support systems such as lighting, ventilation, compressed air, etc., during production  The cell consists of three robots and weld parts of the roof of the cab  Data for energy use were collected and compared to the cell's production cycle, to detect unnecessary energy use 30
  • 31.
  • 32.
    Case StudyCase Study The figure at left shows the energy consumed in a production cycle for Umea robotic welding, including energy for production equipment, support systems (eg. compressed air), and building support systems (lighting, ventilation).To the right, energy use is classified asVA, NVA, NNVA.  The following activities were identified to have significant improvement potential  Idling on production equipment (11% NVA)  Evaluation of the lighting and ventilation(long term perspective), which accounts for 57% of total energy use  The figure at left shows the energy consumed in a production cycle for Umea robotic welding, including energy for production equipment, support systems (eg. compressed air), and building support systems (lighting, ventilation).To the right, energy use is classified asVA, NVA, NNVA.  The following activities were identified to have significant improvement potential  Idling on production equipment (11% NVA)  Evaluation of the lighting and ventilation(long term perspective), which accounts for 57% of total energy use 32
  • 33.
    Case StudyCase Study A practical method for GreenVSM has been developed, with a proposal to work in teams with a three step model ◦ Start of work and data collection ◦ Compilation and analysis- GreenVSM is compiled & compiled asVA, NNVA, NVA ◦ General conclusions-It provides a holistic view and a reduced risk of sub-optimization of environment/production improvement  Collecting both the data simultaneously is easier rather taking differently at different time  A practical method for GreenVSM has been developed, with a proposal to work in teams with a three step model ◦ Start of work and data collection ◦ Compilation and analysis- GreenVSM is compiled & compiled asVA, NNVA, NVA ◦ General conclusions-It provides a holistic view and a reduced risk of sub-optimization of environment/production improvement  Collecting both the data simultaneously is easier rather taking differently at different time 33
  • 34.
    Case StudyCase Study Localenvironmental parameters with different production processes 34
  • 35.
    Case StudyCase Study Surface treatment ◦ Local environmental parameters essential for a work station for surface treatment are energy use, powder consumption, paint, re-circulated powder, cassation, efficiency, conveyer-capacity, cost and also the amount of carbon dioxide.  Heat treatment ◦ Environmental parameters essential for a work station for heat treatment are energy consumption (electric energy, gas, other), protective gas, chemicals (detergents, heat treatment liquids)  Surface treatment ◦ Local environmental parameters essential for a work station for surface treatment are energy use, powder consumption, paint, re-circulated powder, cassation, efficiency, conveyer-capacity, cost and also the amount of carbon dioxide.  Heat treatment ◦ Environmental parameters essential for a work station for heat treatment are energy consumption (electric energy, gas, other), protective gas, chemicals (detergents, heat treatment liquids) 35
  • 36.
    Case StudyCase Study Machining ◦ Parameters essential for a work station for machining are utilization of process liquids, energy consumption during production and during down-time (stand by-losses), waste water and other waste  Assembly ◦ Parameters essential for a work station for assembly are handling waste, energy consumption in tools and supporting processes (e.g. pneumatic), reduction of spill and leakage, energy consumption during down time are parameters that are possible to influence within a team area.  Machining ◦ Parameters essential for a work station for machining are utilization of process liquids, energy consumption during production and during down-time (stand by-losses), waste water and other waste  Assembly ◦ Parameters essential for a work station for assembly are handling waste, energy consumption in tools and supporting processes (e.g. pneumatic), reduction of spill and leakage, energy consumption during down time are parameters that are possible to influence within a team area. 36
  • 37.
  • 38.
    Case StudyCase Study--ConclusionConclusion  Conclusion- ◦ It is important to identify local environmental parameters also from the production personnel’s perspective and then link them to the company’s overall environmental work and parameters within the plant/company. Cross functional collaboration also with suppliers is important both for the results and to increase participation in the improvement and development work.  Conclusion- ◦ It is important to identify local environmental parameters also from the production personnel’s perspective and then link them to the company’s overall environmental work and parameters within the plant/company. Cross functional collaboration also with suppliers is important both for the results and to increase participation in the improvement and development work. 38
  • 39.
    Where to useWhereto use  Manufacturing  Energy efficiency  Non manufacturing ◦ Health care & other services ◦ Administrative ◦ Government  Supply chain  Design of products & processes  Manufacturing  Energy efficiency  Non manufacturing ◦ Health care & other services ◦ Administrative ◦ Government  Supply chain  Design of products & processes 39
  • 40.
    BenefitsBenefits  Reduce Energy-RelatedCosts ◦ Energy and water costs are a prime concern for manufacturers.  Environmental Benefits ◦ The goal of green & lean manufacturing is to reduce wastage nearly to zero, helping ecology and reduce pollution.  Boost Workforce Morale and Innovations ◦ Sustainability improvements are a collaborative effort. When employees work together to identify and implement green and sustainable initiatives, it fosters a culture of teamwork and continuous improvement.  Reduce Energy-Related Costs ◦ Energy and water costs are a prime concern for manufacturers.  Environmental Benefits ◦ The goal of green & lean manufacturing is to reduce wastage nearly to zero, helping ecology and reduce pollution.  Boost Workforce Morale and Innovations ◦ Sustainability improvements are a collaborative effort. When employees work together to identify and implement green and sustainable initiatives, it fosters a culture of teamwork and continuous improvement. 40
  • 41.
    BenefitsBenefits  More usefulin the bigger companies because the process is harder to see in its totality  Supports “whole-system thinking” rather than sub-optimisation  What gets measured, gets done  Promotes “why-why-why” analysis  Reduce total cost within supply chain.  Improves disaster recovery protection.  Cost savings for business and consumers as a reusable product/s.  Improve competitiveness in the industry  More useful in the bigger companies because the process is harder to see in its totality  Supports “whole-system thinking” rather than sub-optimisation  What gets measured, gets done  Promotes “why-why-why” analysis  Reduce total cost within supply chain.  Improves disaster recovery protection.  Cost savings for business and consumers as a reusable product/s.  Improve competitiveness in the industry 41
  • 42.
    “To repeat whatothers have said, requires“To repeat what others have said, requires education; to challenge it requires brain”education; to challenge it requires brain”