Download as PDF, PPTX

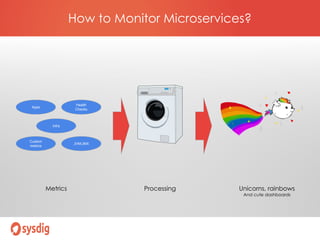

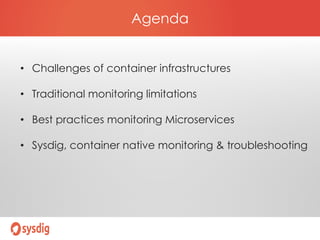
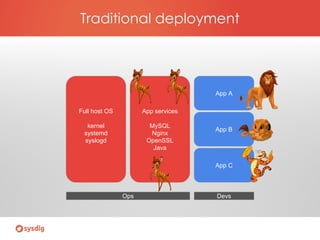
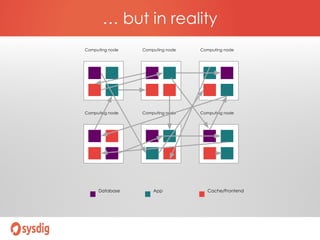

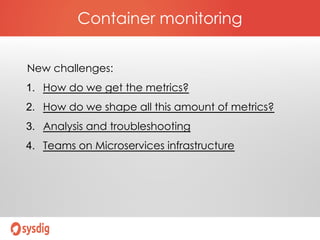
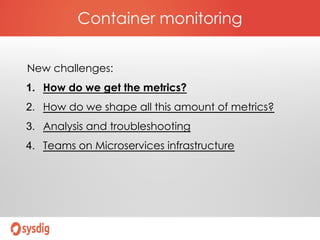
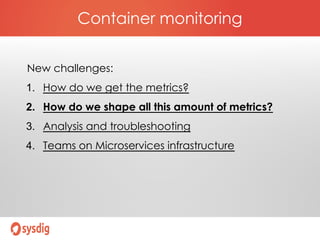
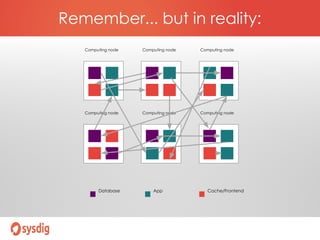
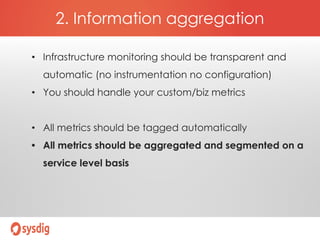
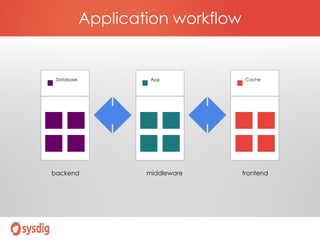


The document discusses the challenges and best practices for monitoring microservices in containerized environments. It highlights the limitations of traditional monitoring models and presents Sysdig as a solution that provides automatic metrics collection and analysis without extensive instrumentation. Key areas addressed include metric collection, information aggregation, troubleshooting, and team organization in microservices infrastructure.