Downloaded 12 times
![Format
Simple format:
<dir>:<ID>:<tag1>.<tag2>...:<arg1>=<val1>,<arg2>=<val2>...
JSON Format:
["<direction>", <ID>, ["tag1", "tag2"...],
[{"arg1":"val1"}, {"arg2":"val2"}...]]](https://image.slidesharecdn.com/traceeverythingwhenapmmeetssysadmins-170208113242/75/Trace-everything-when-APM-meets-SysAdmins-21-2048.jpg)


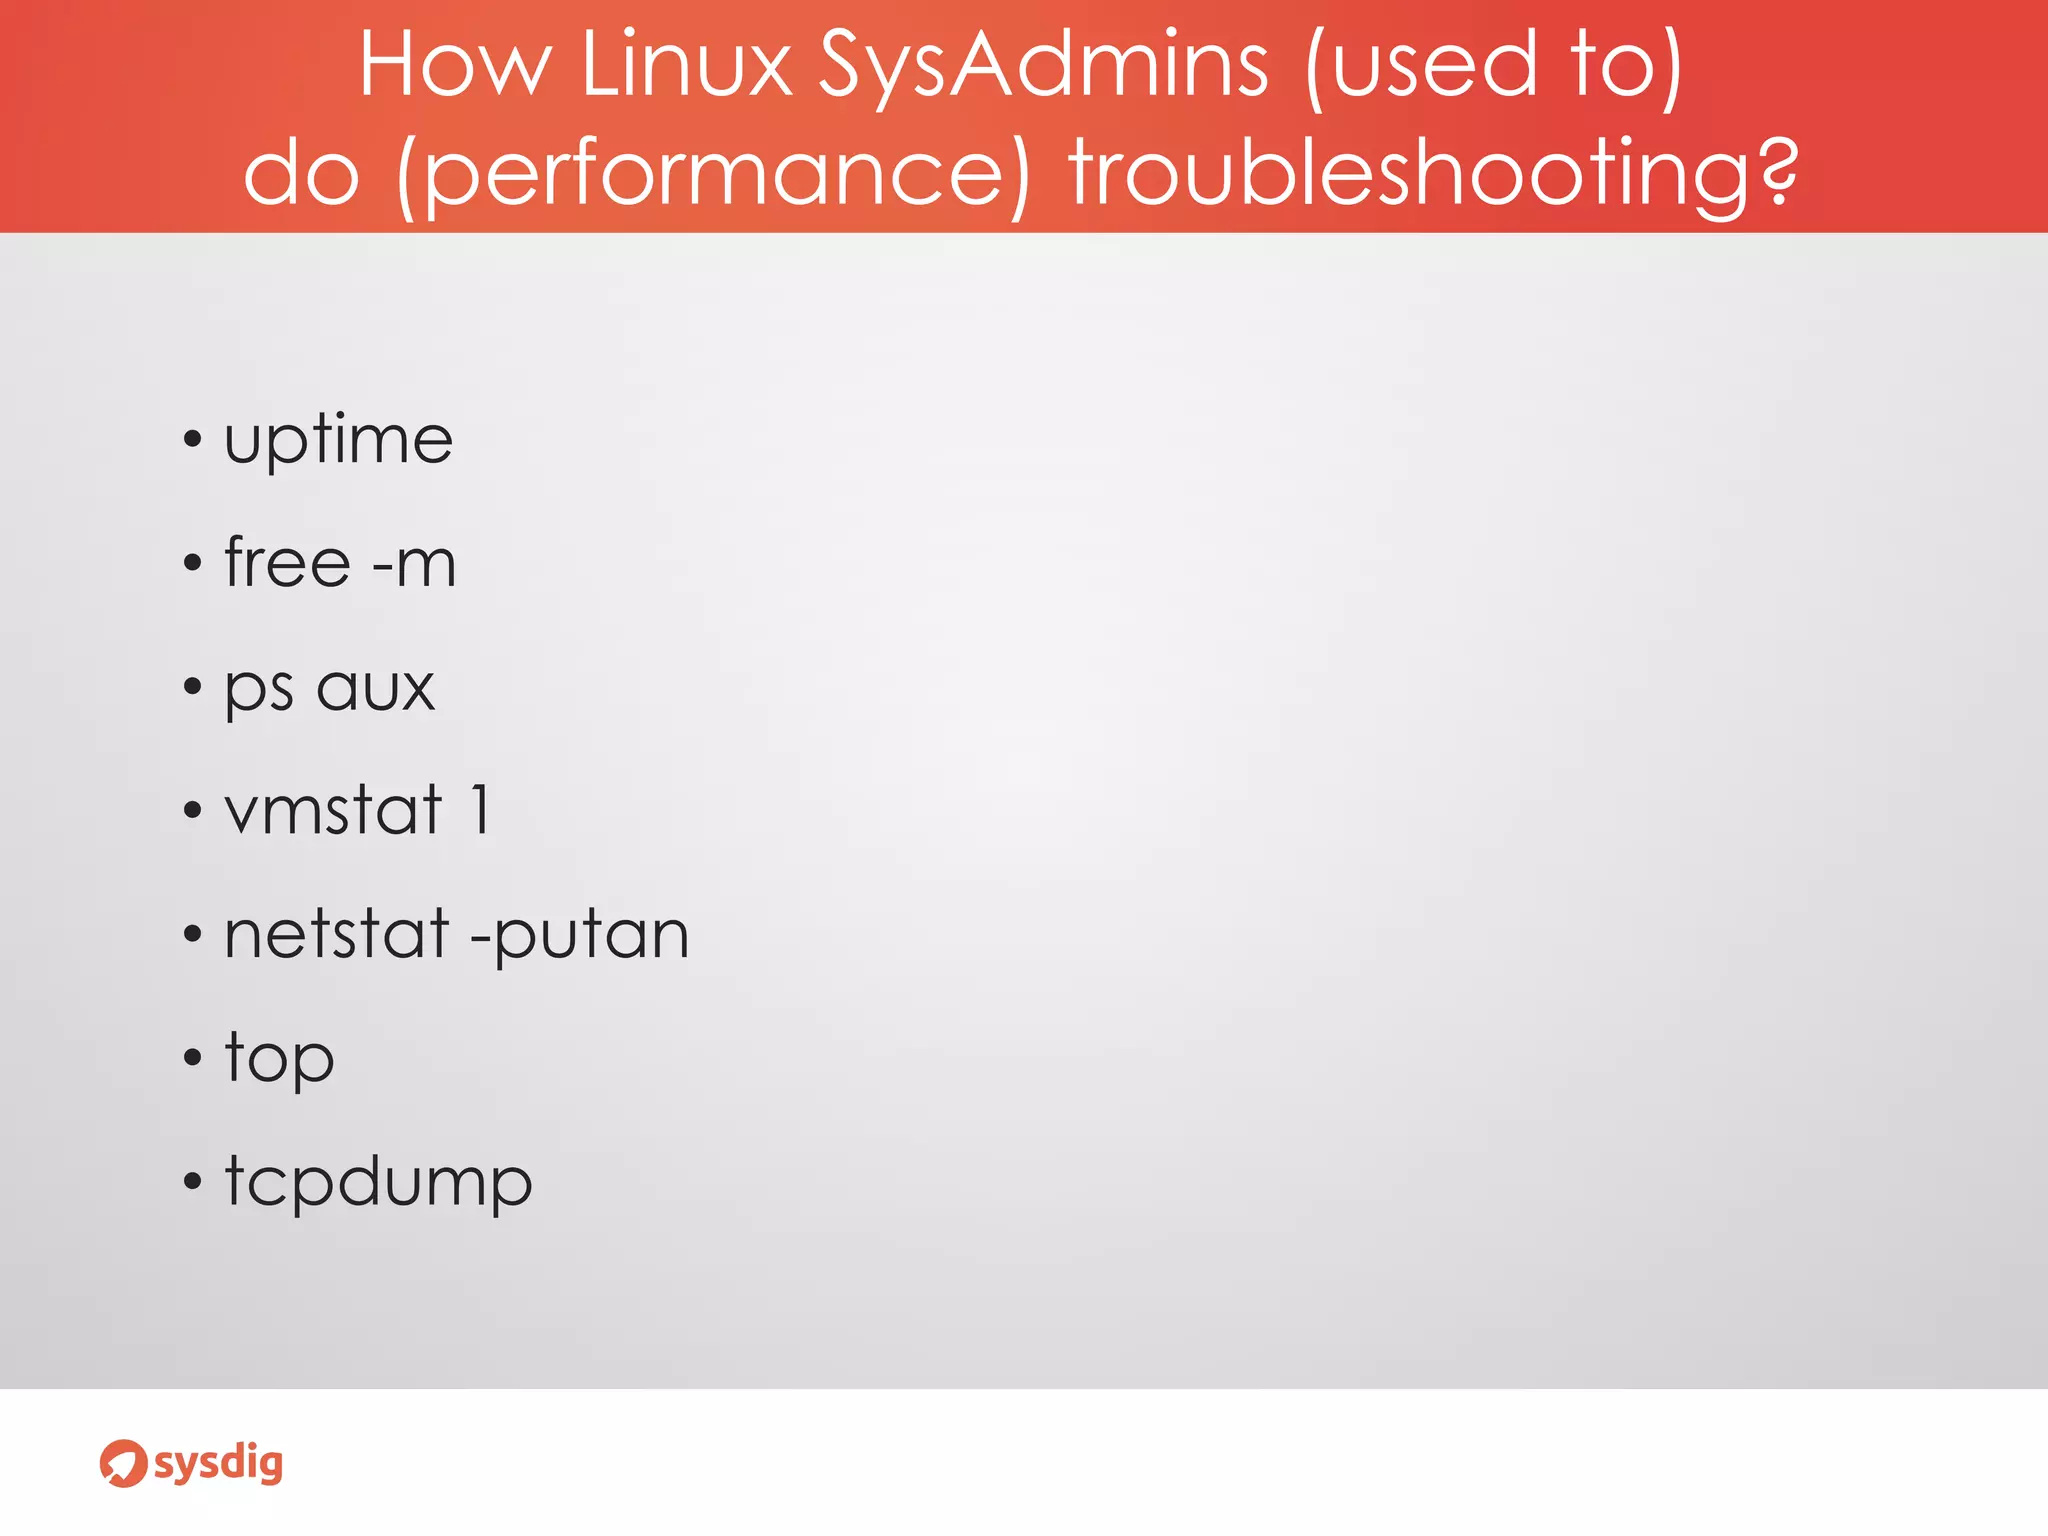
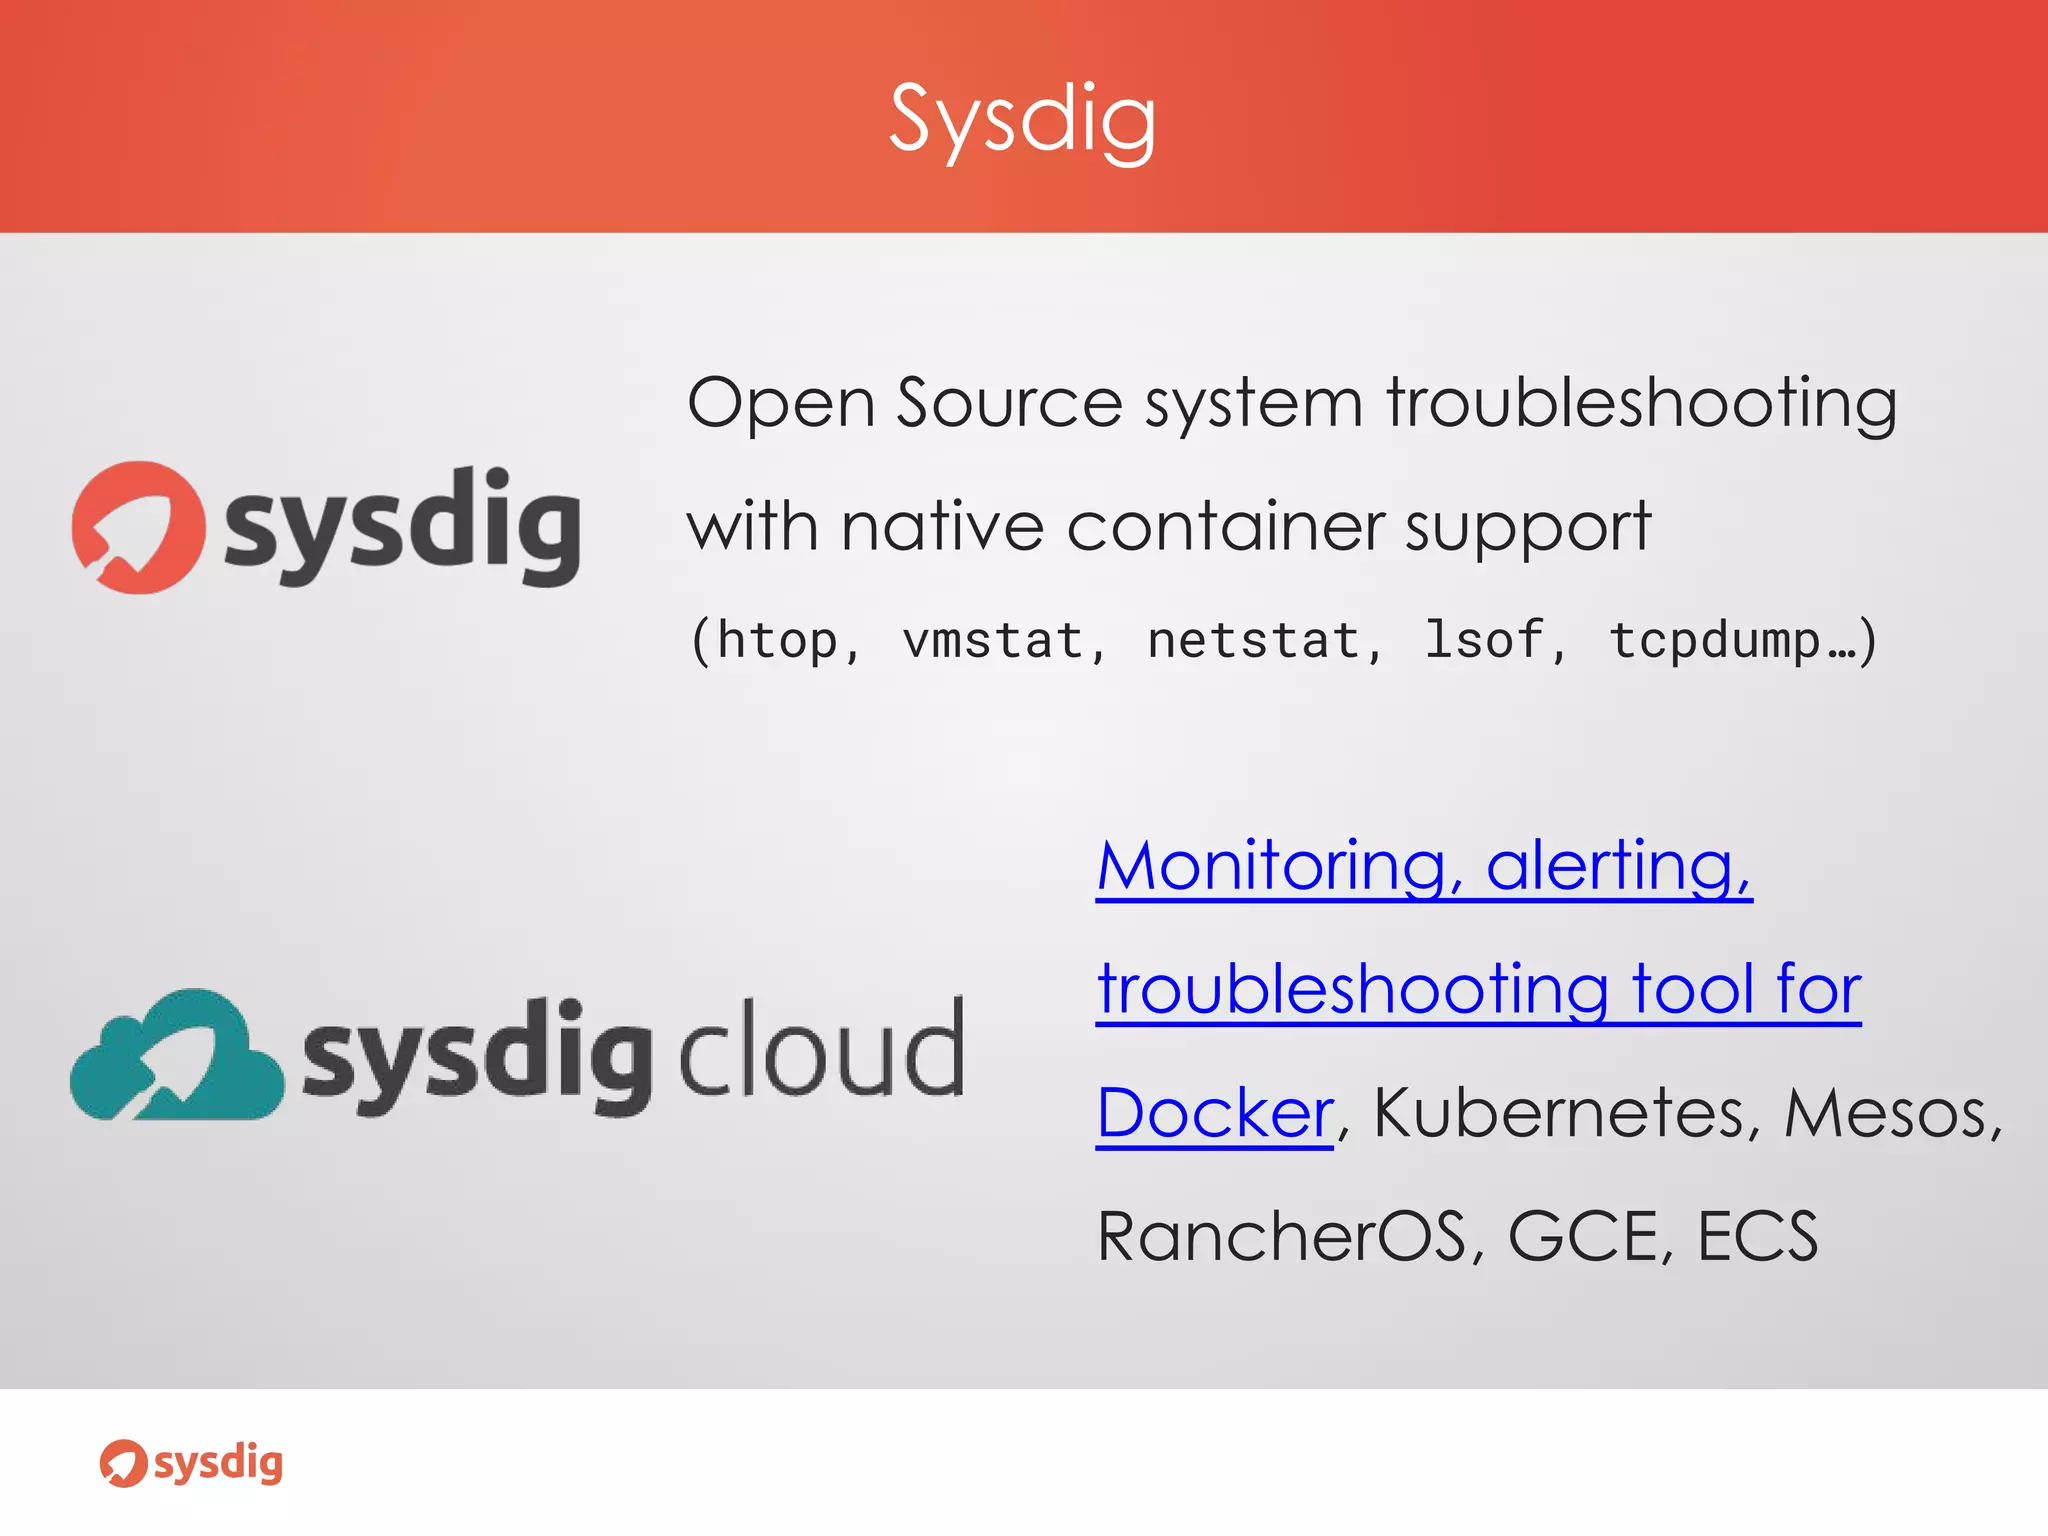
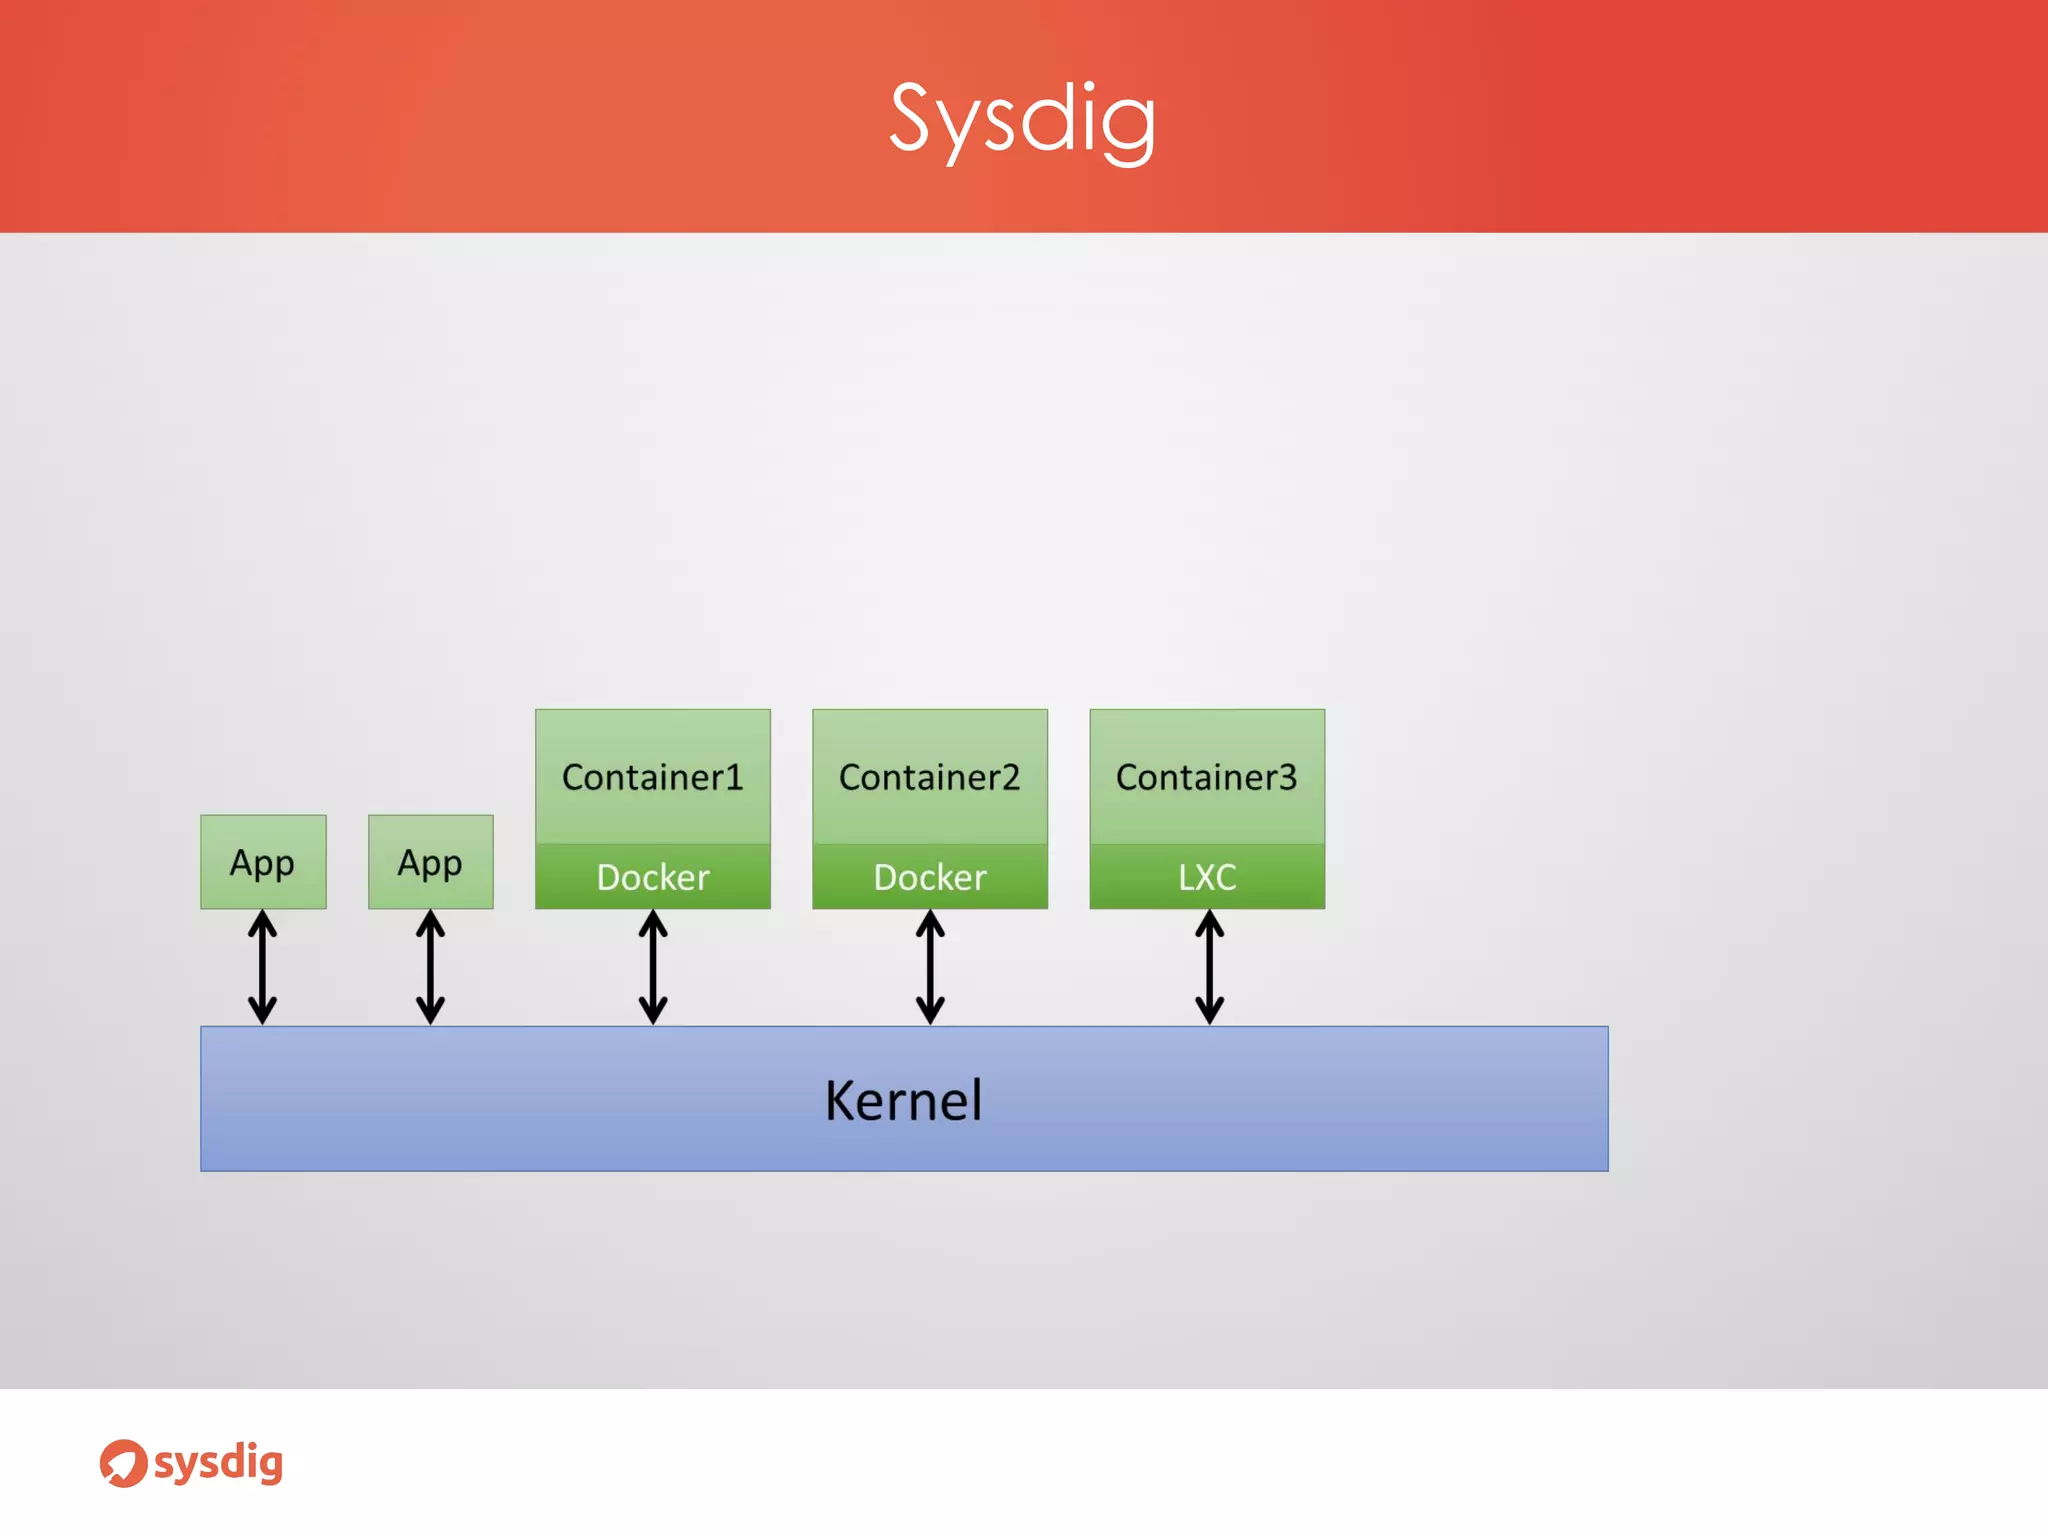
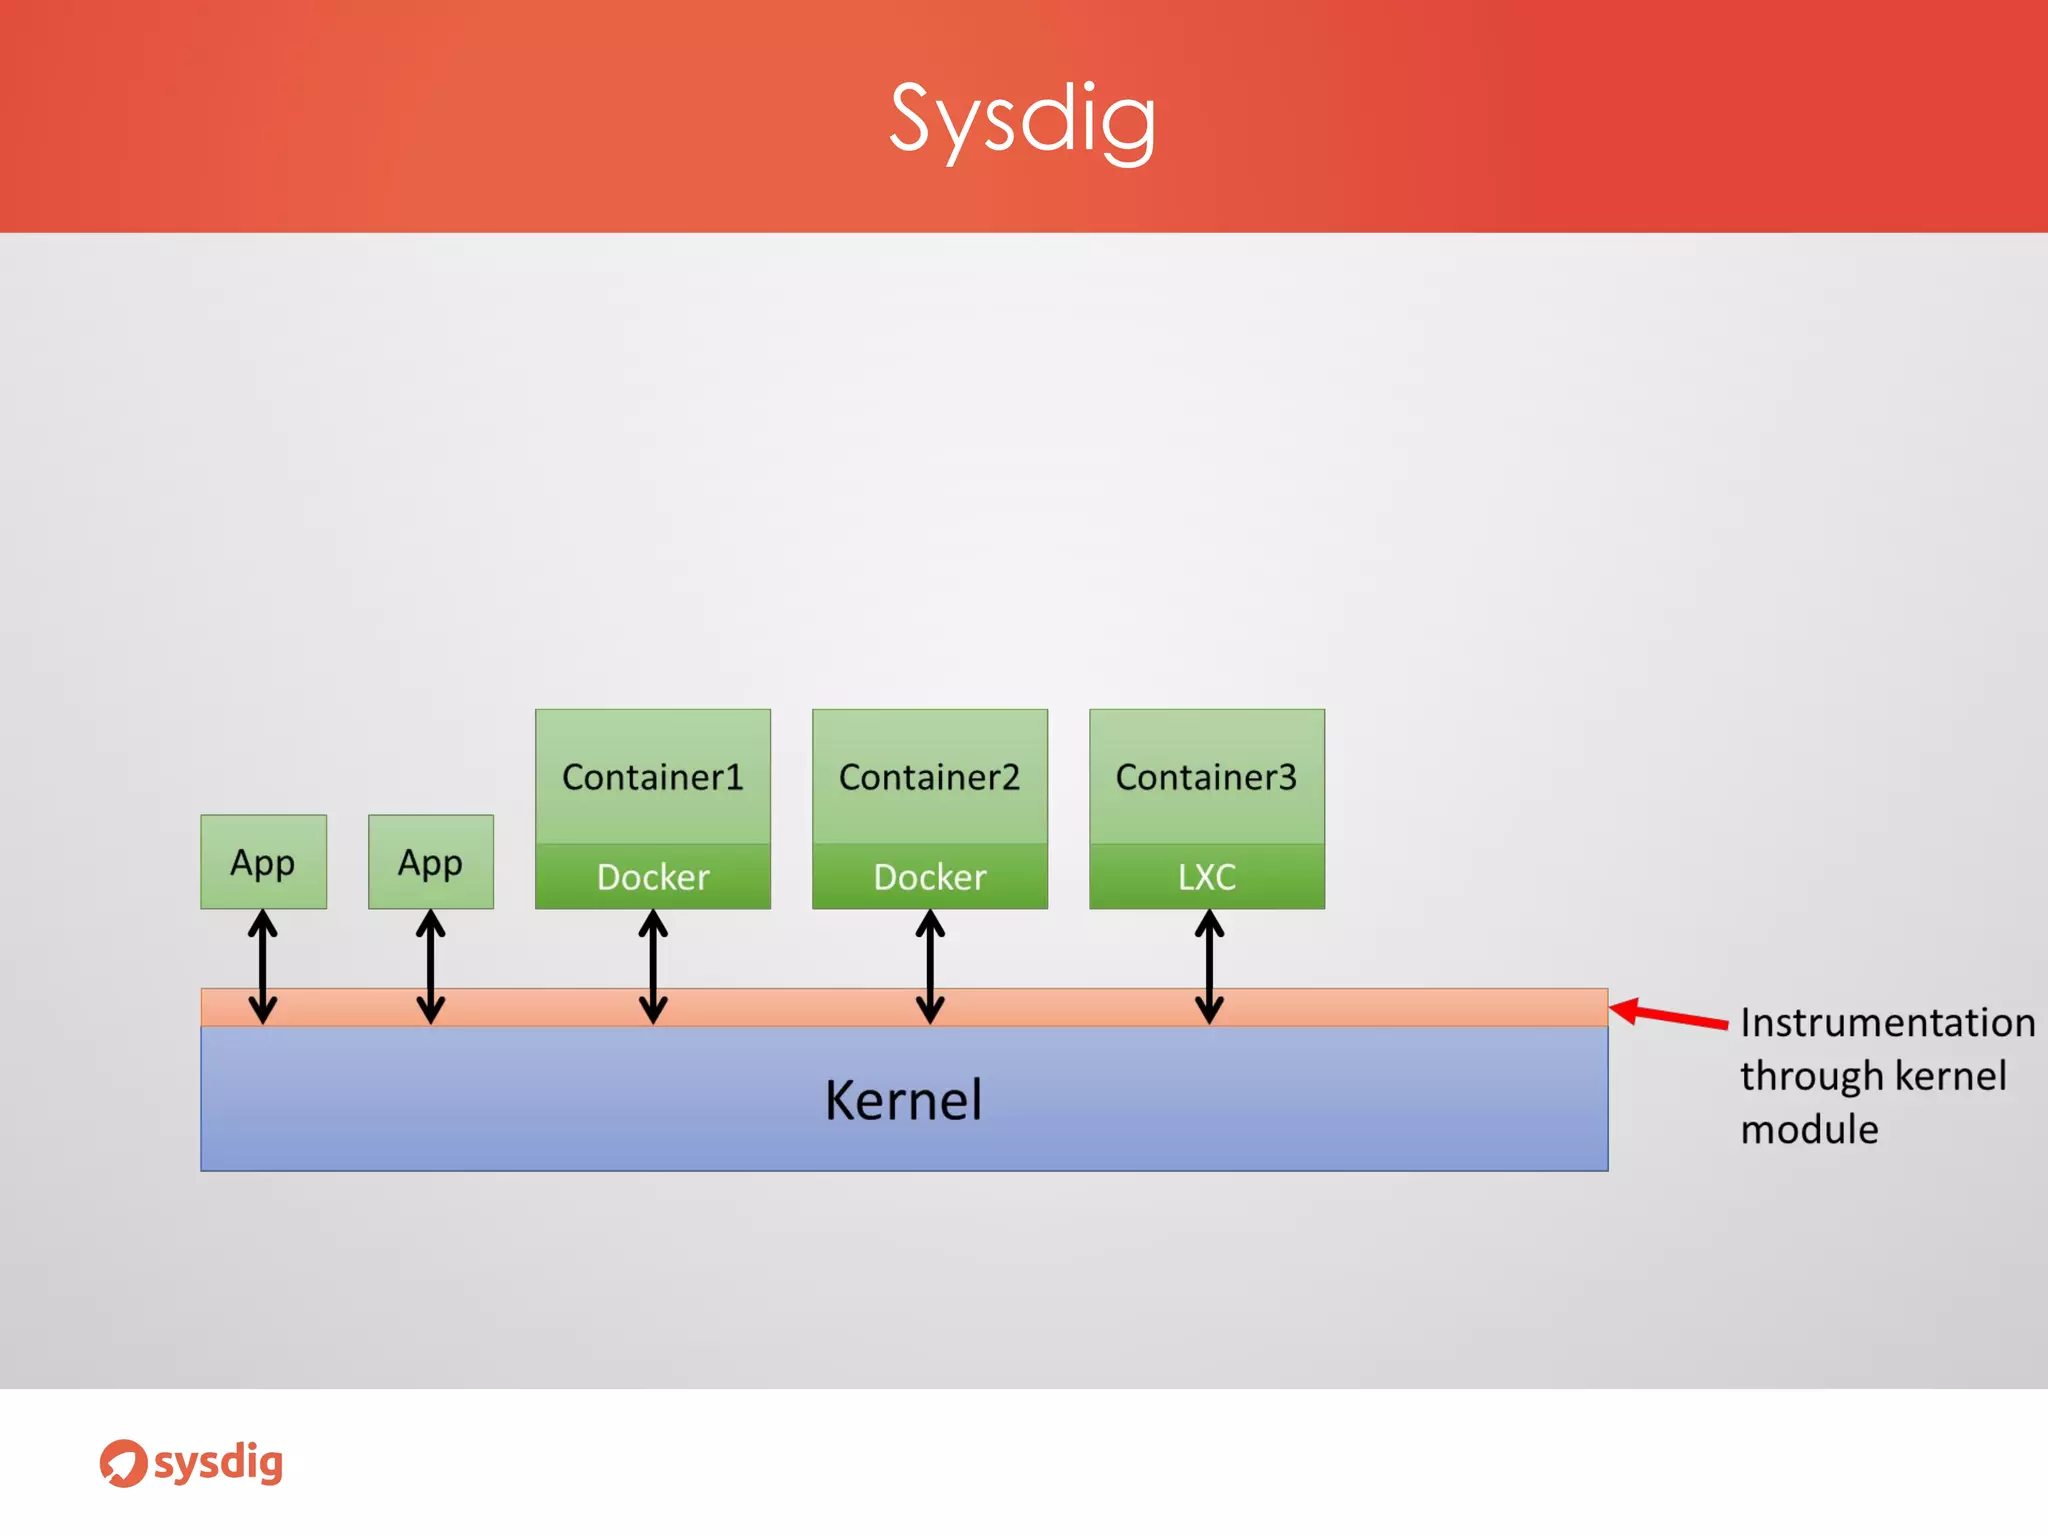
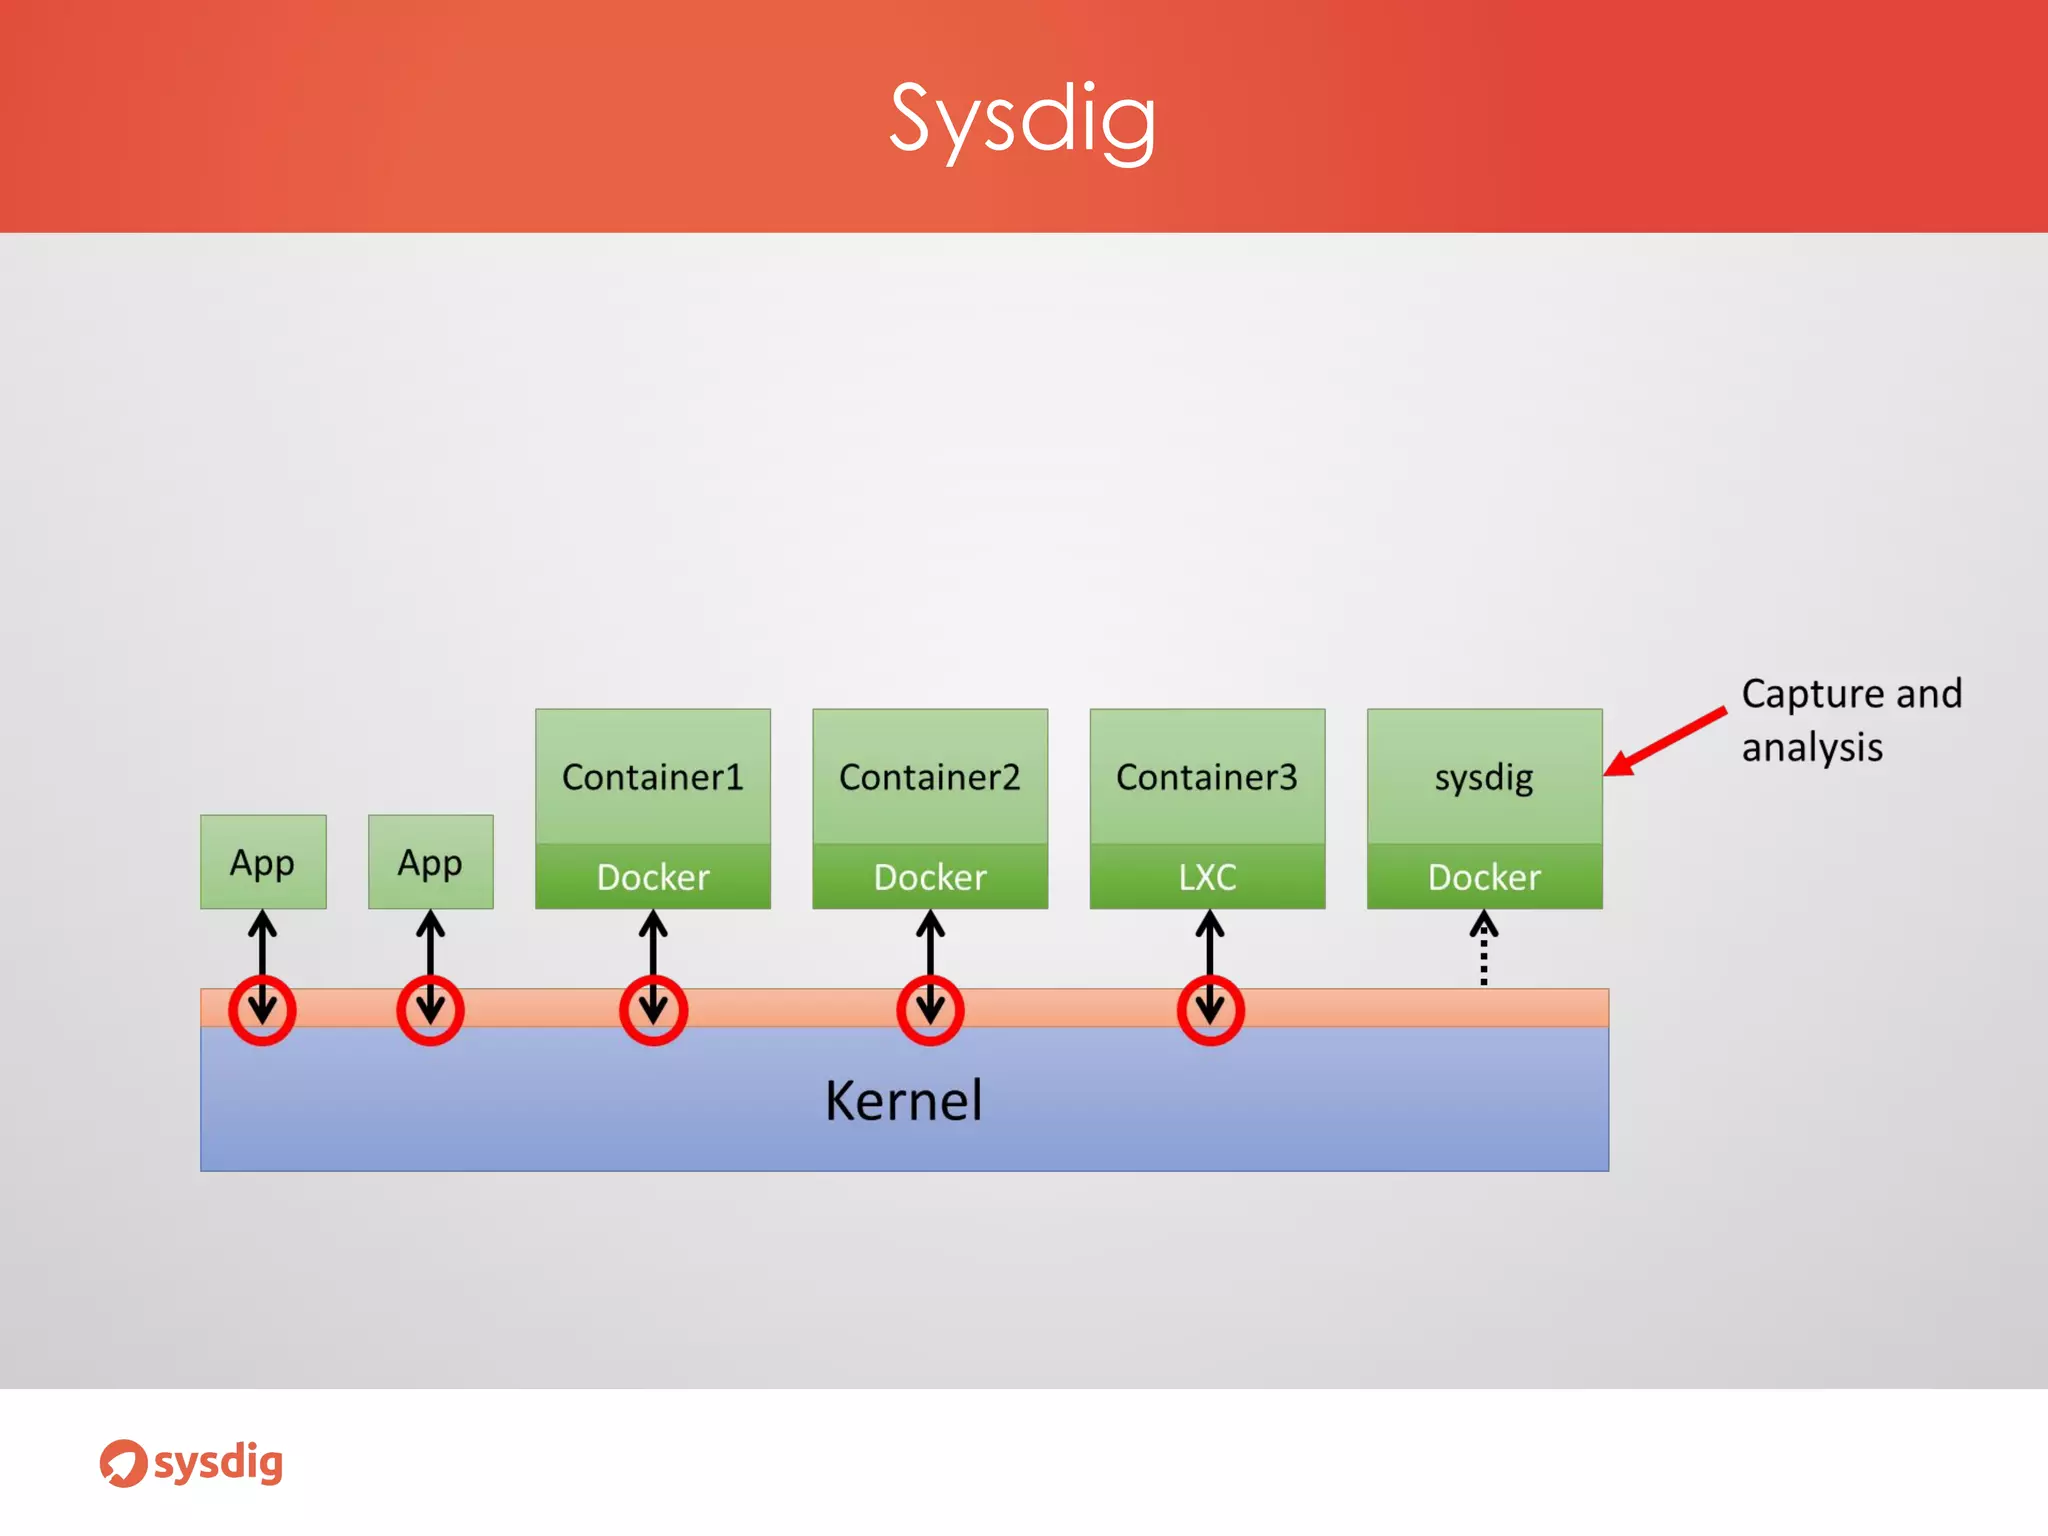
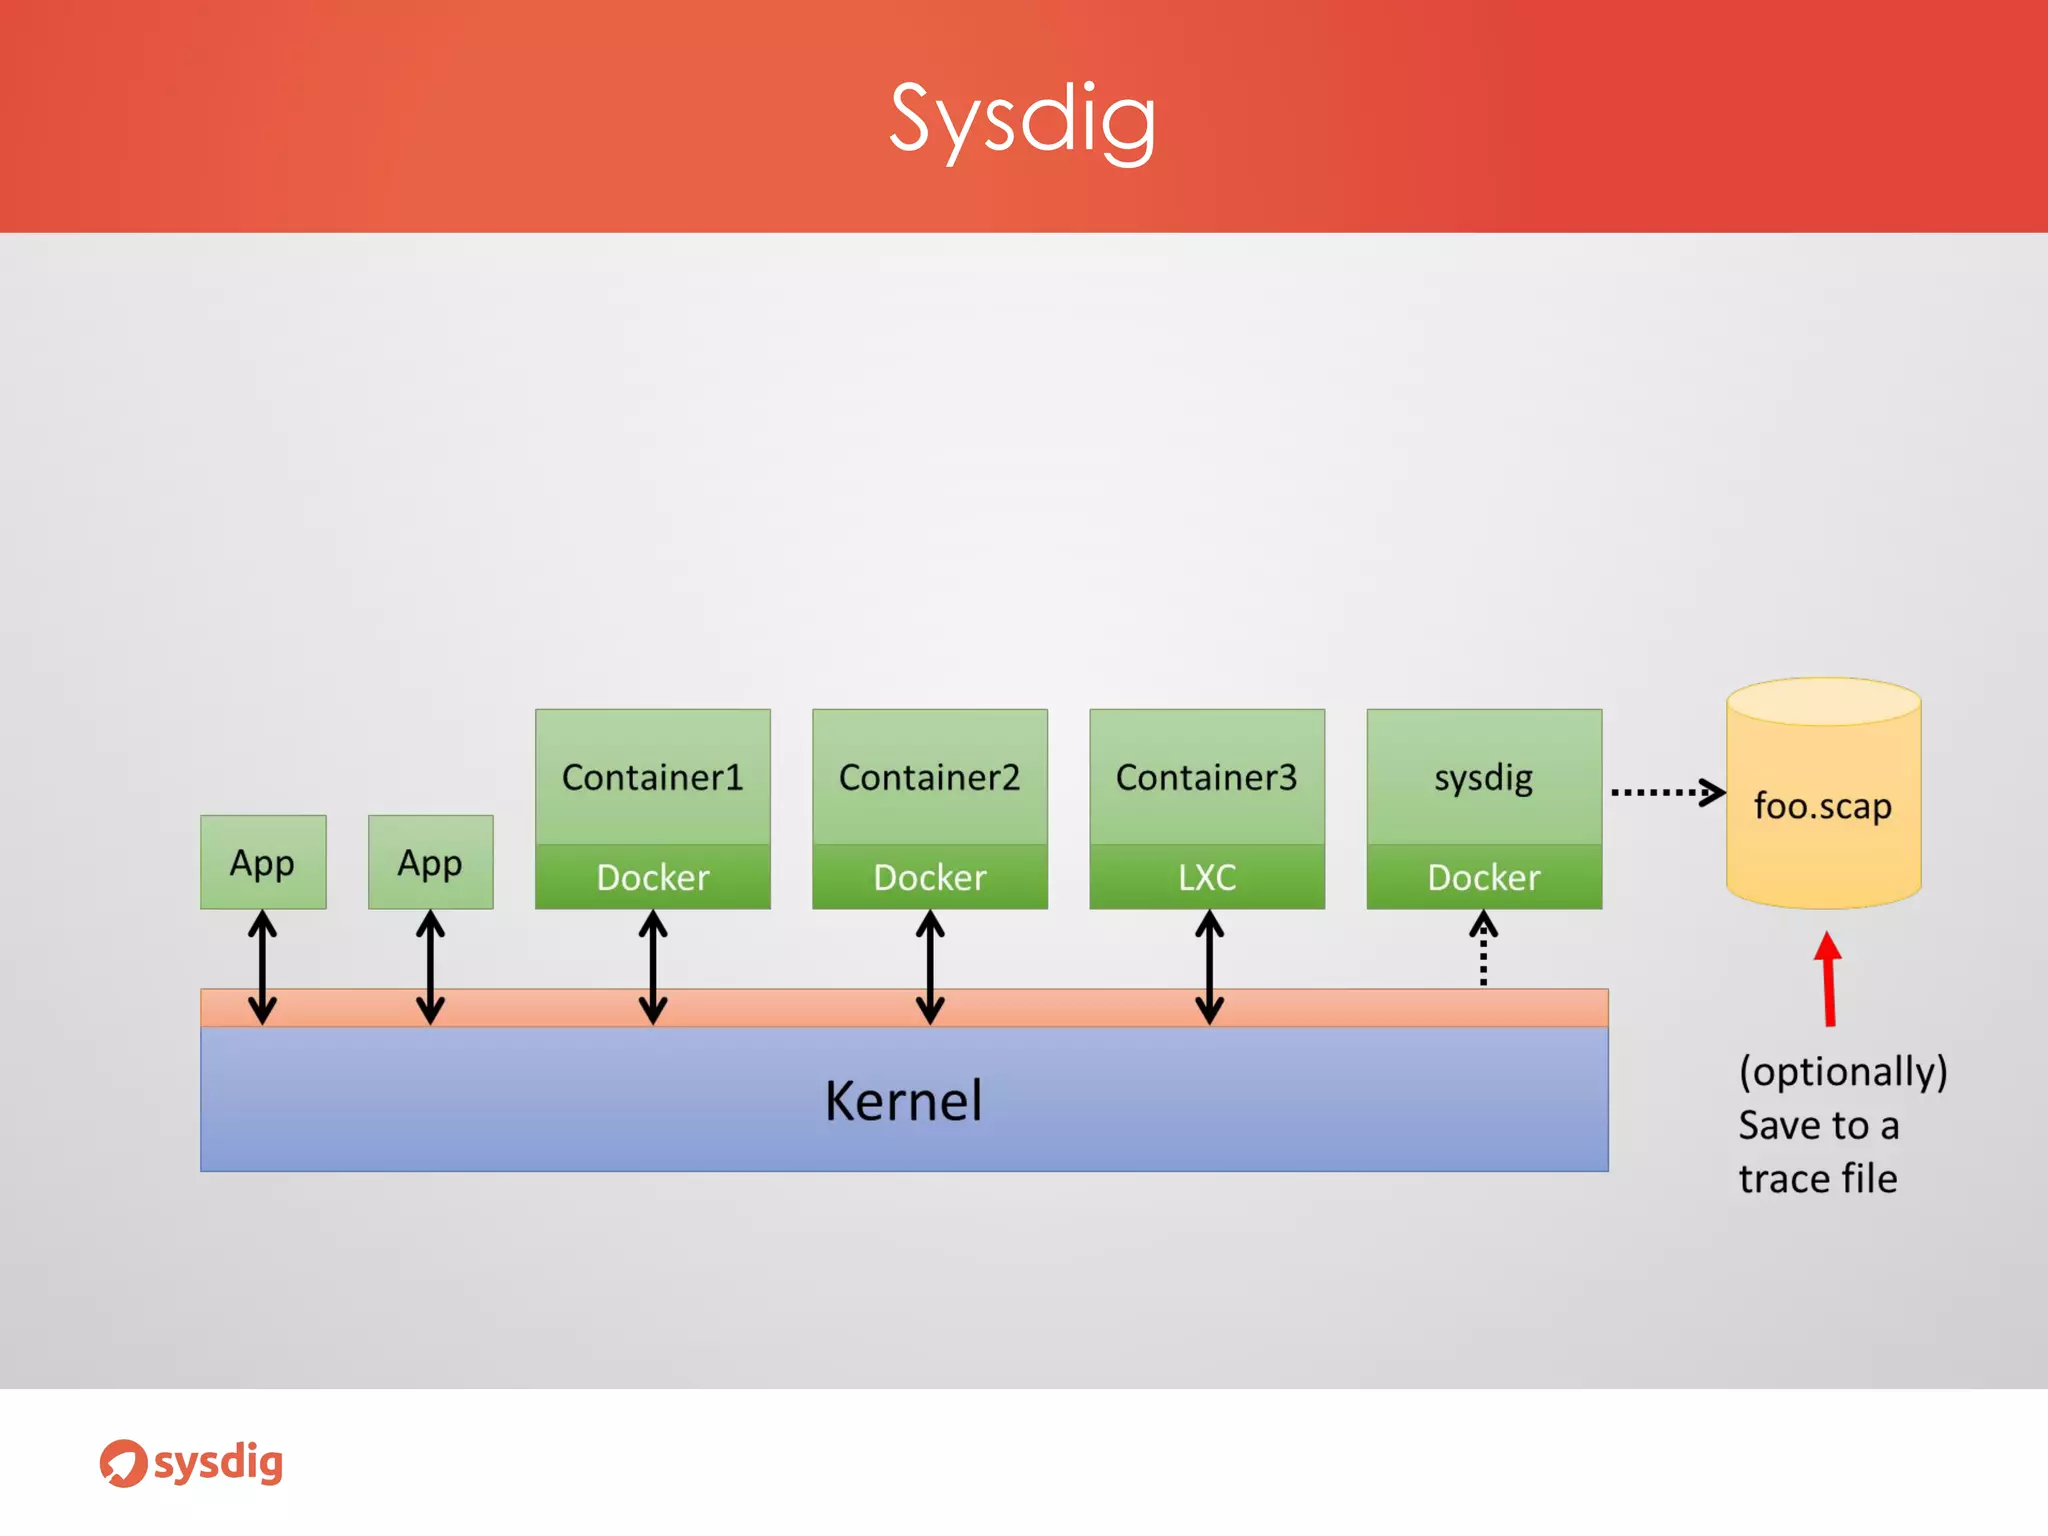
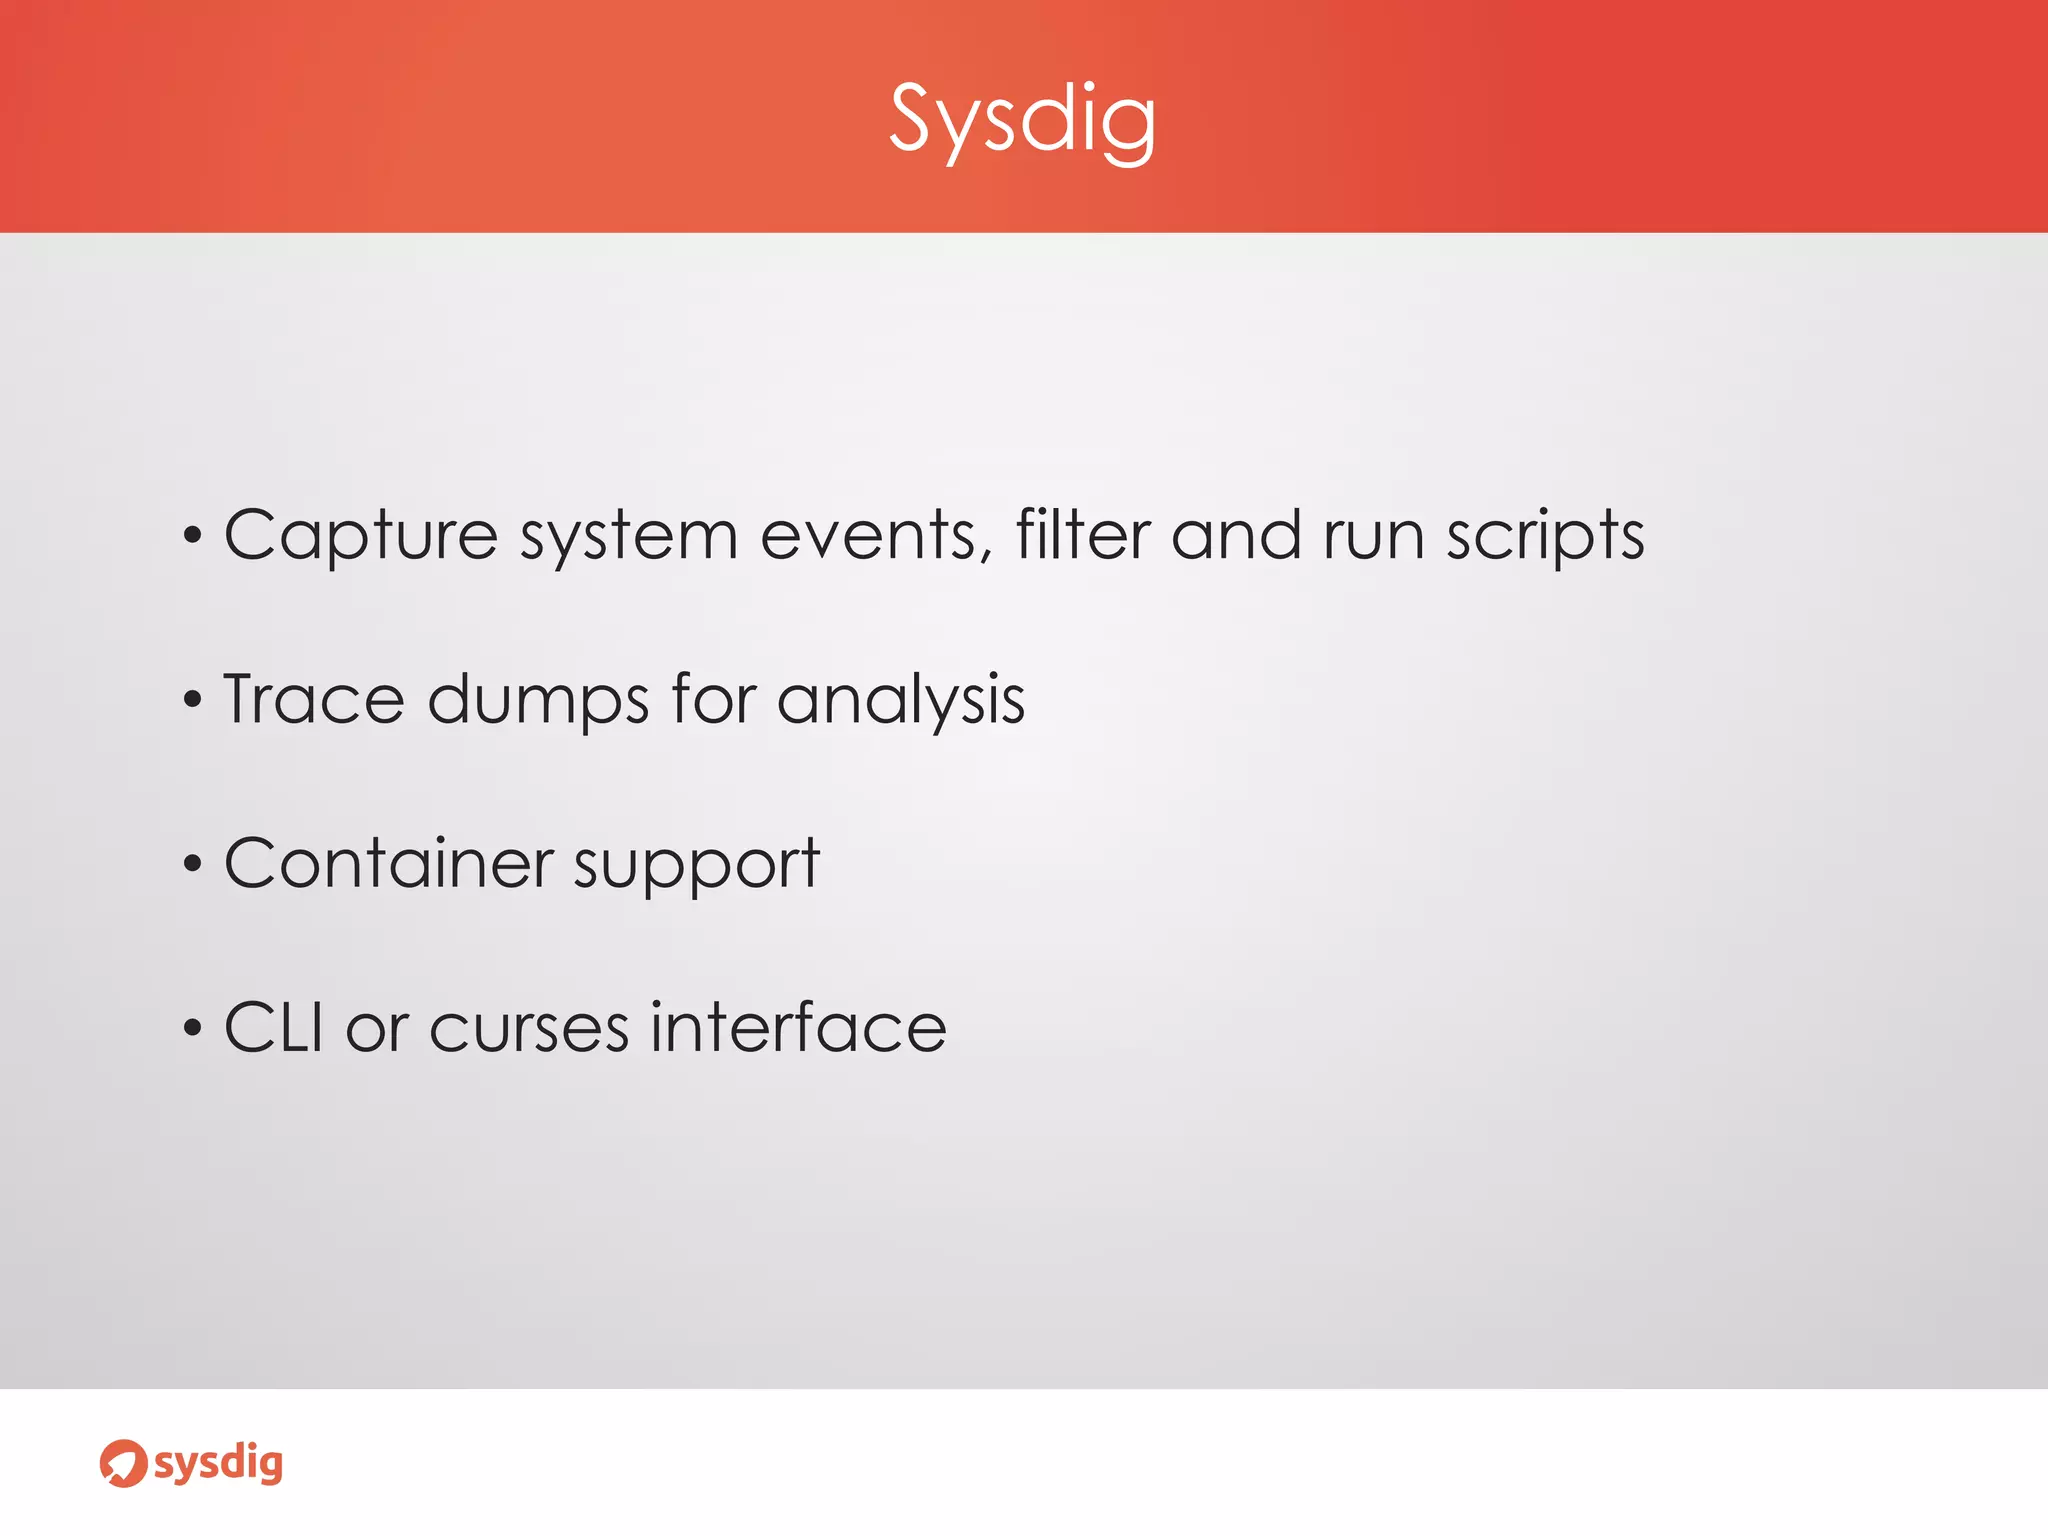
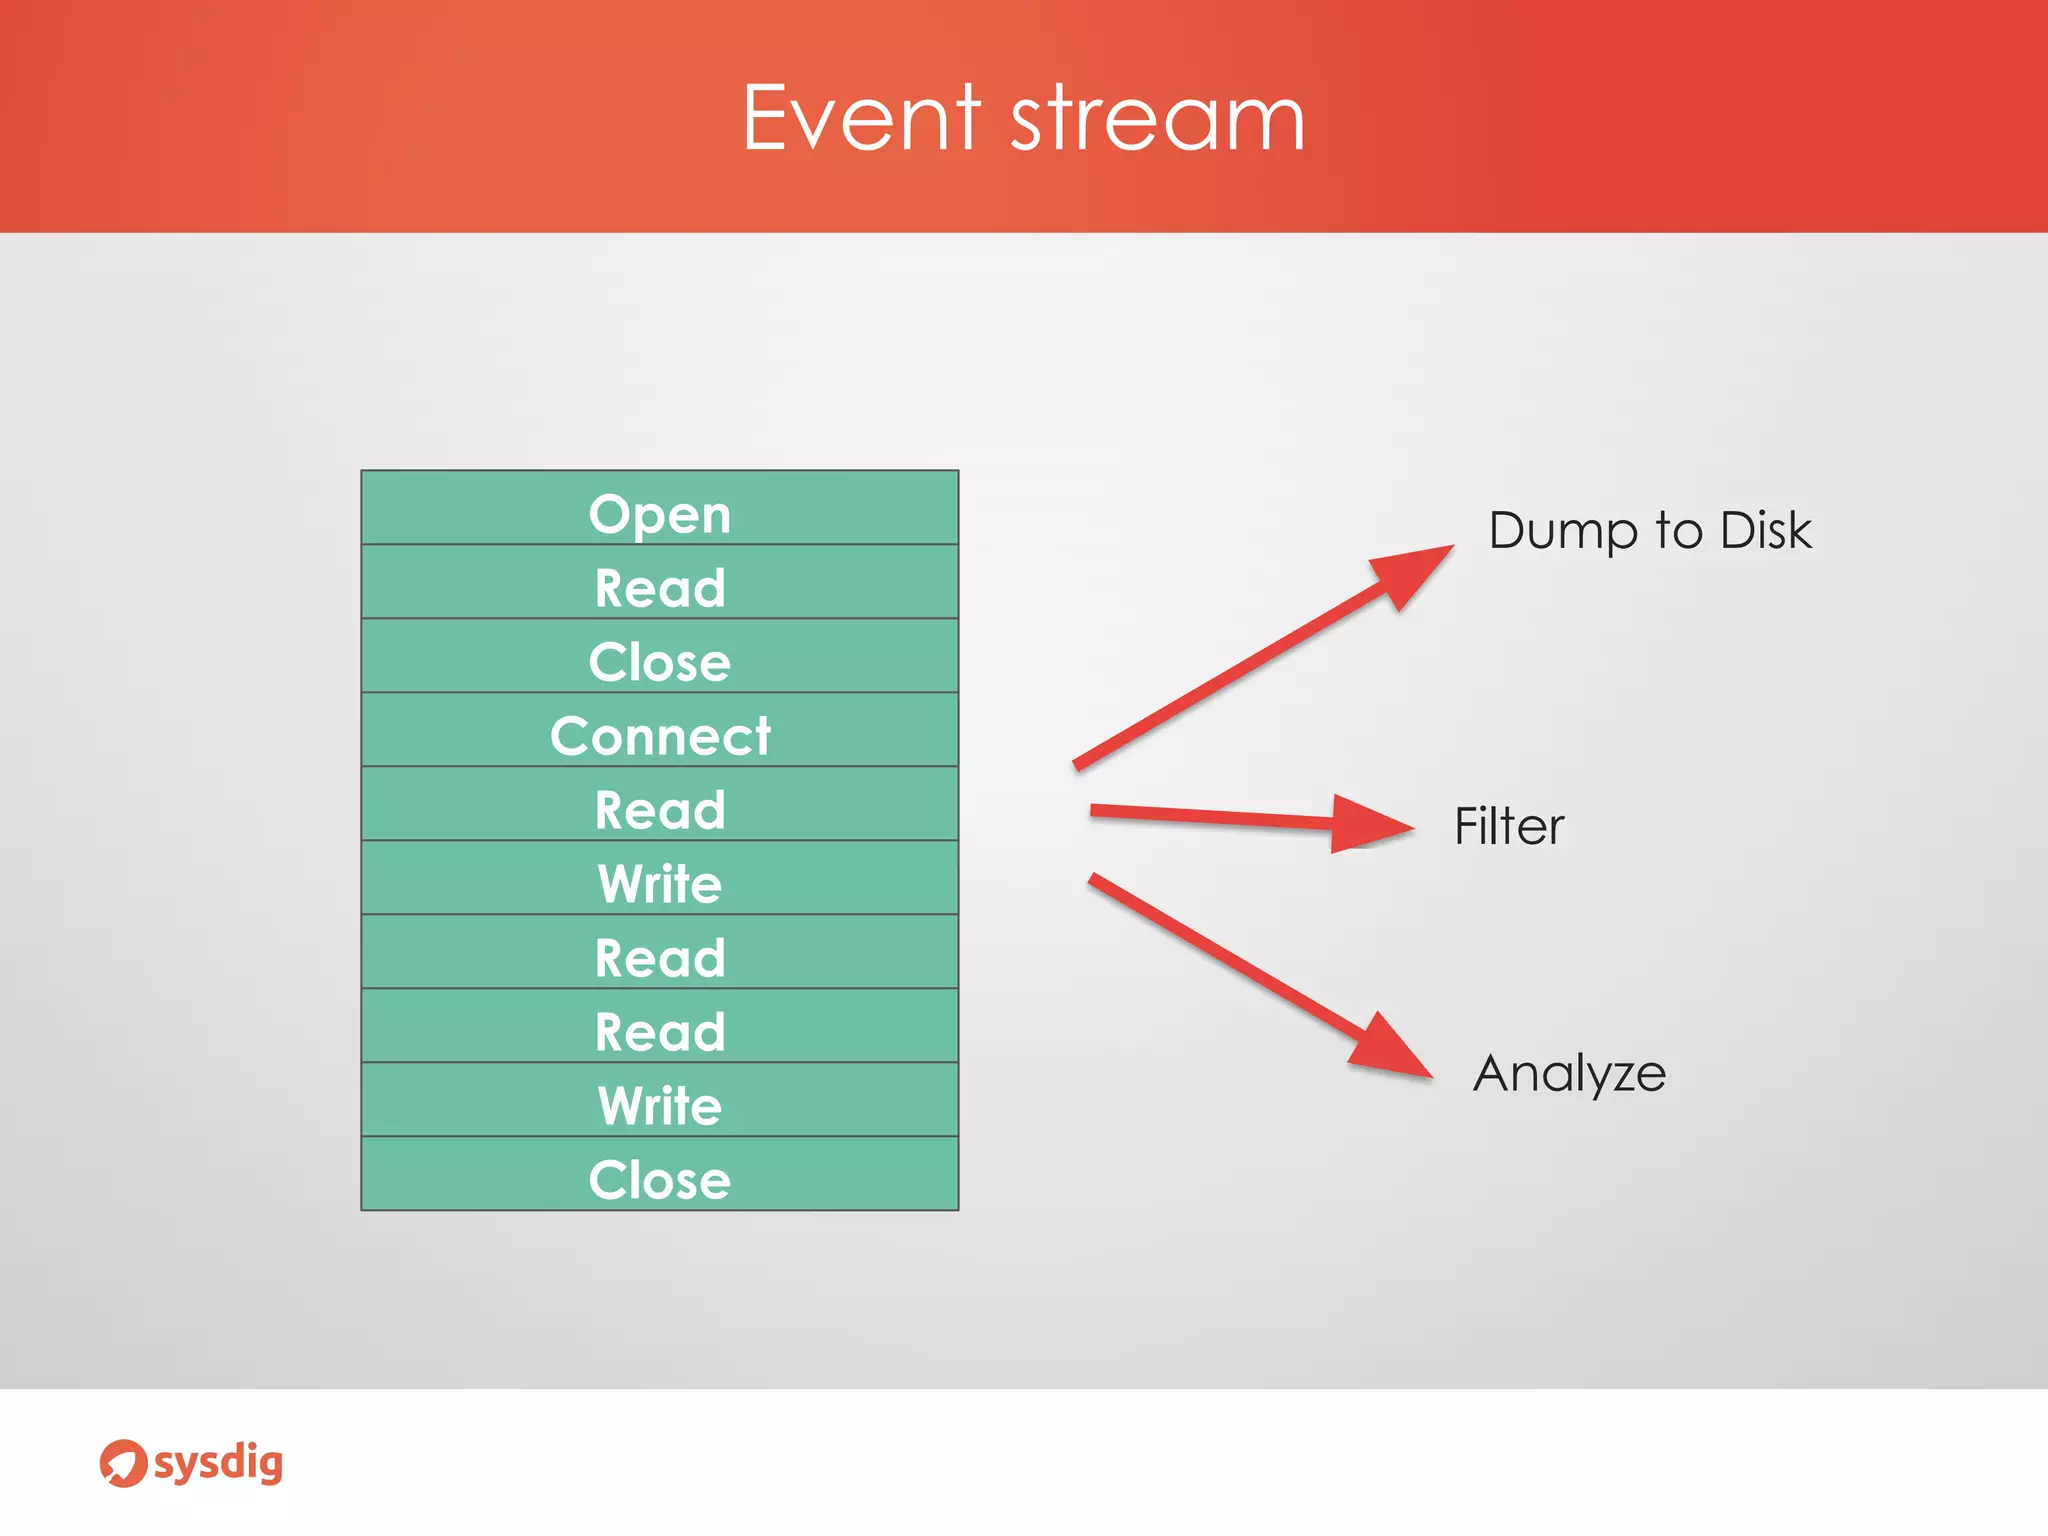
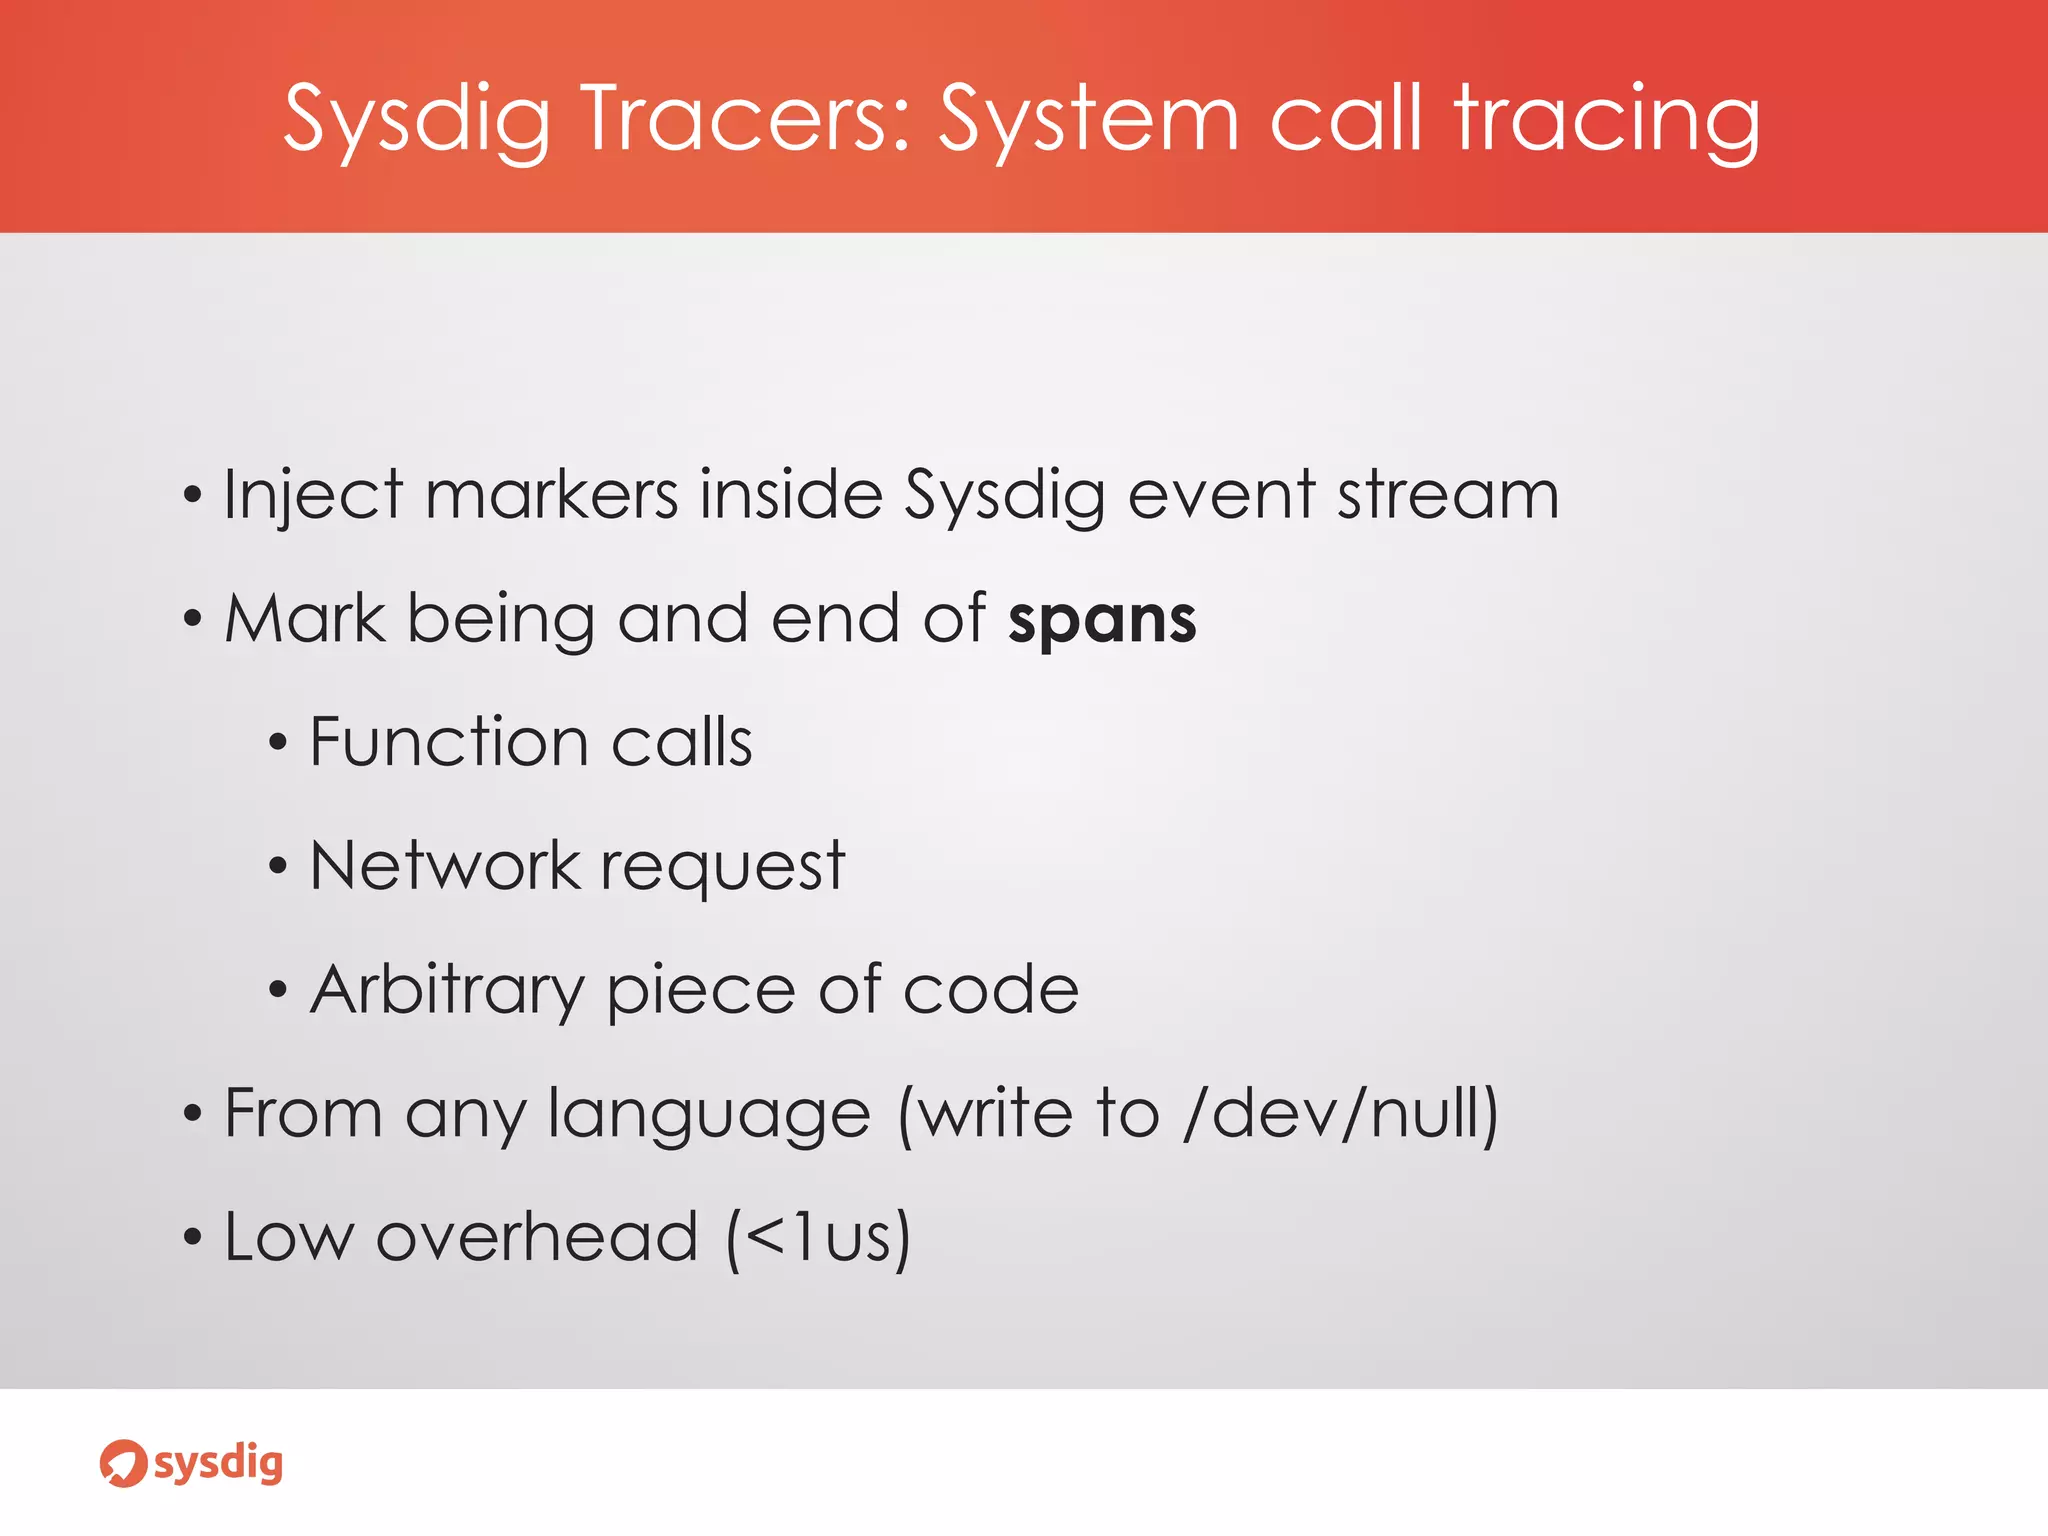
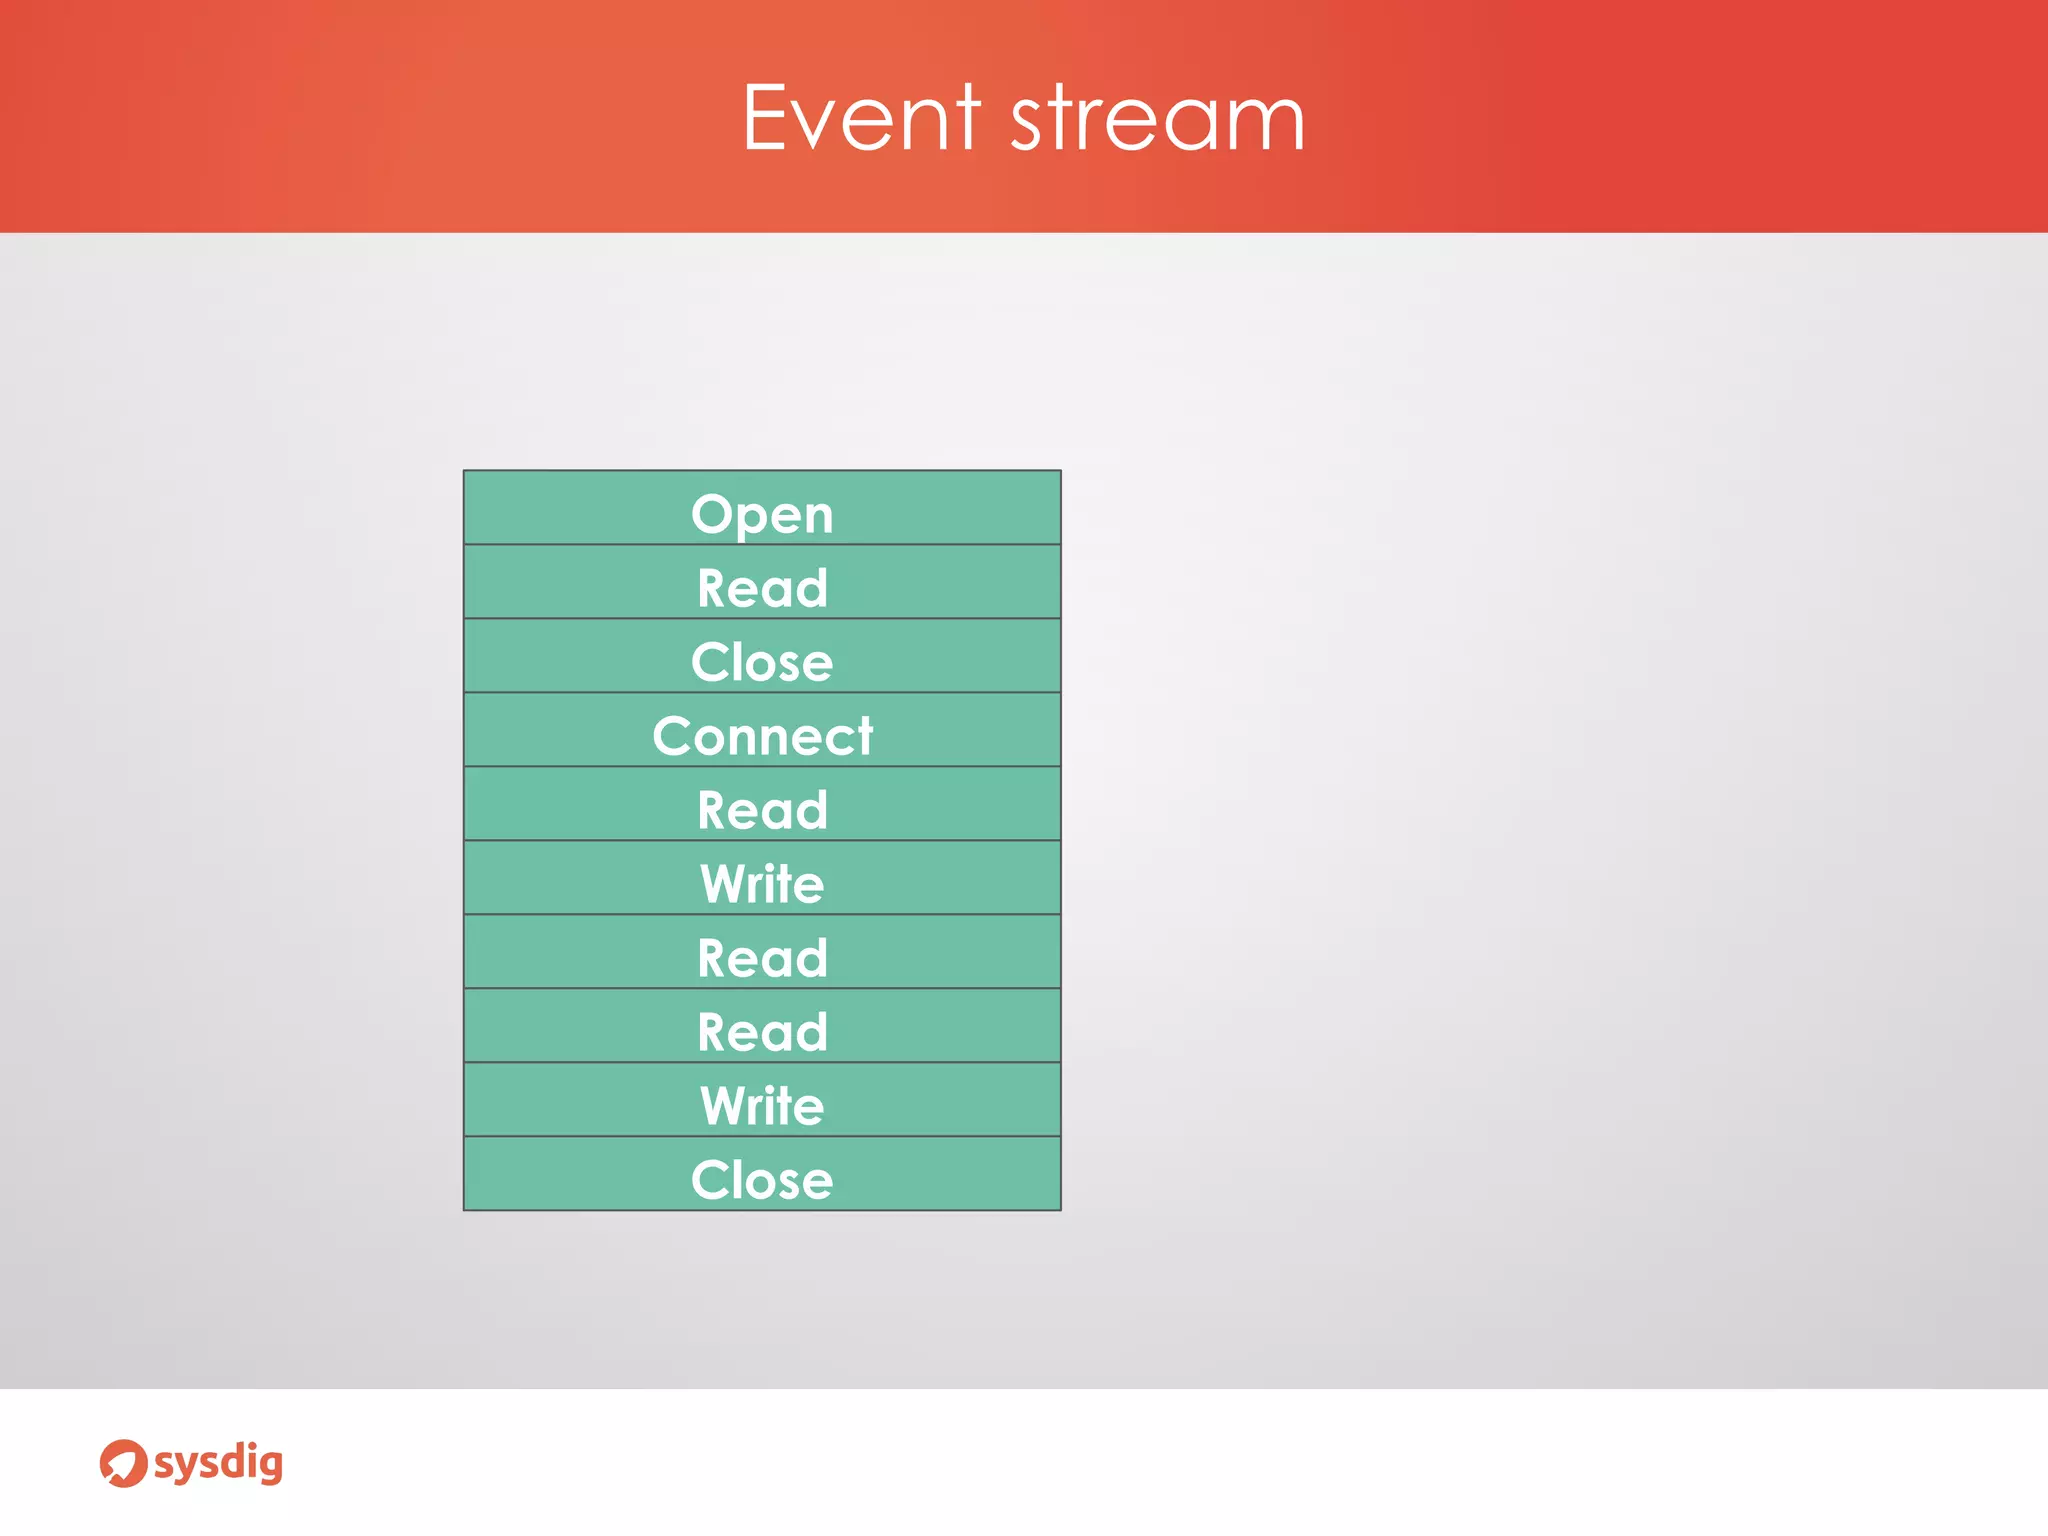
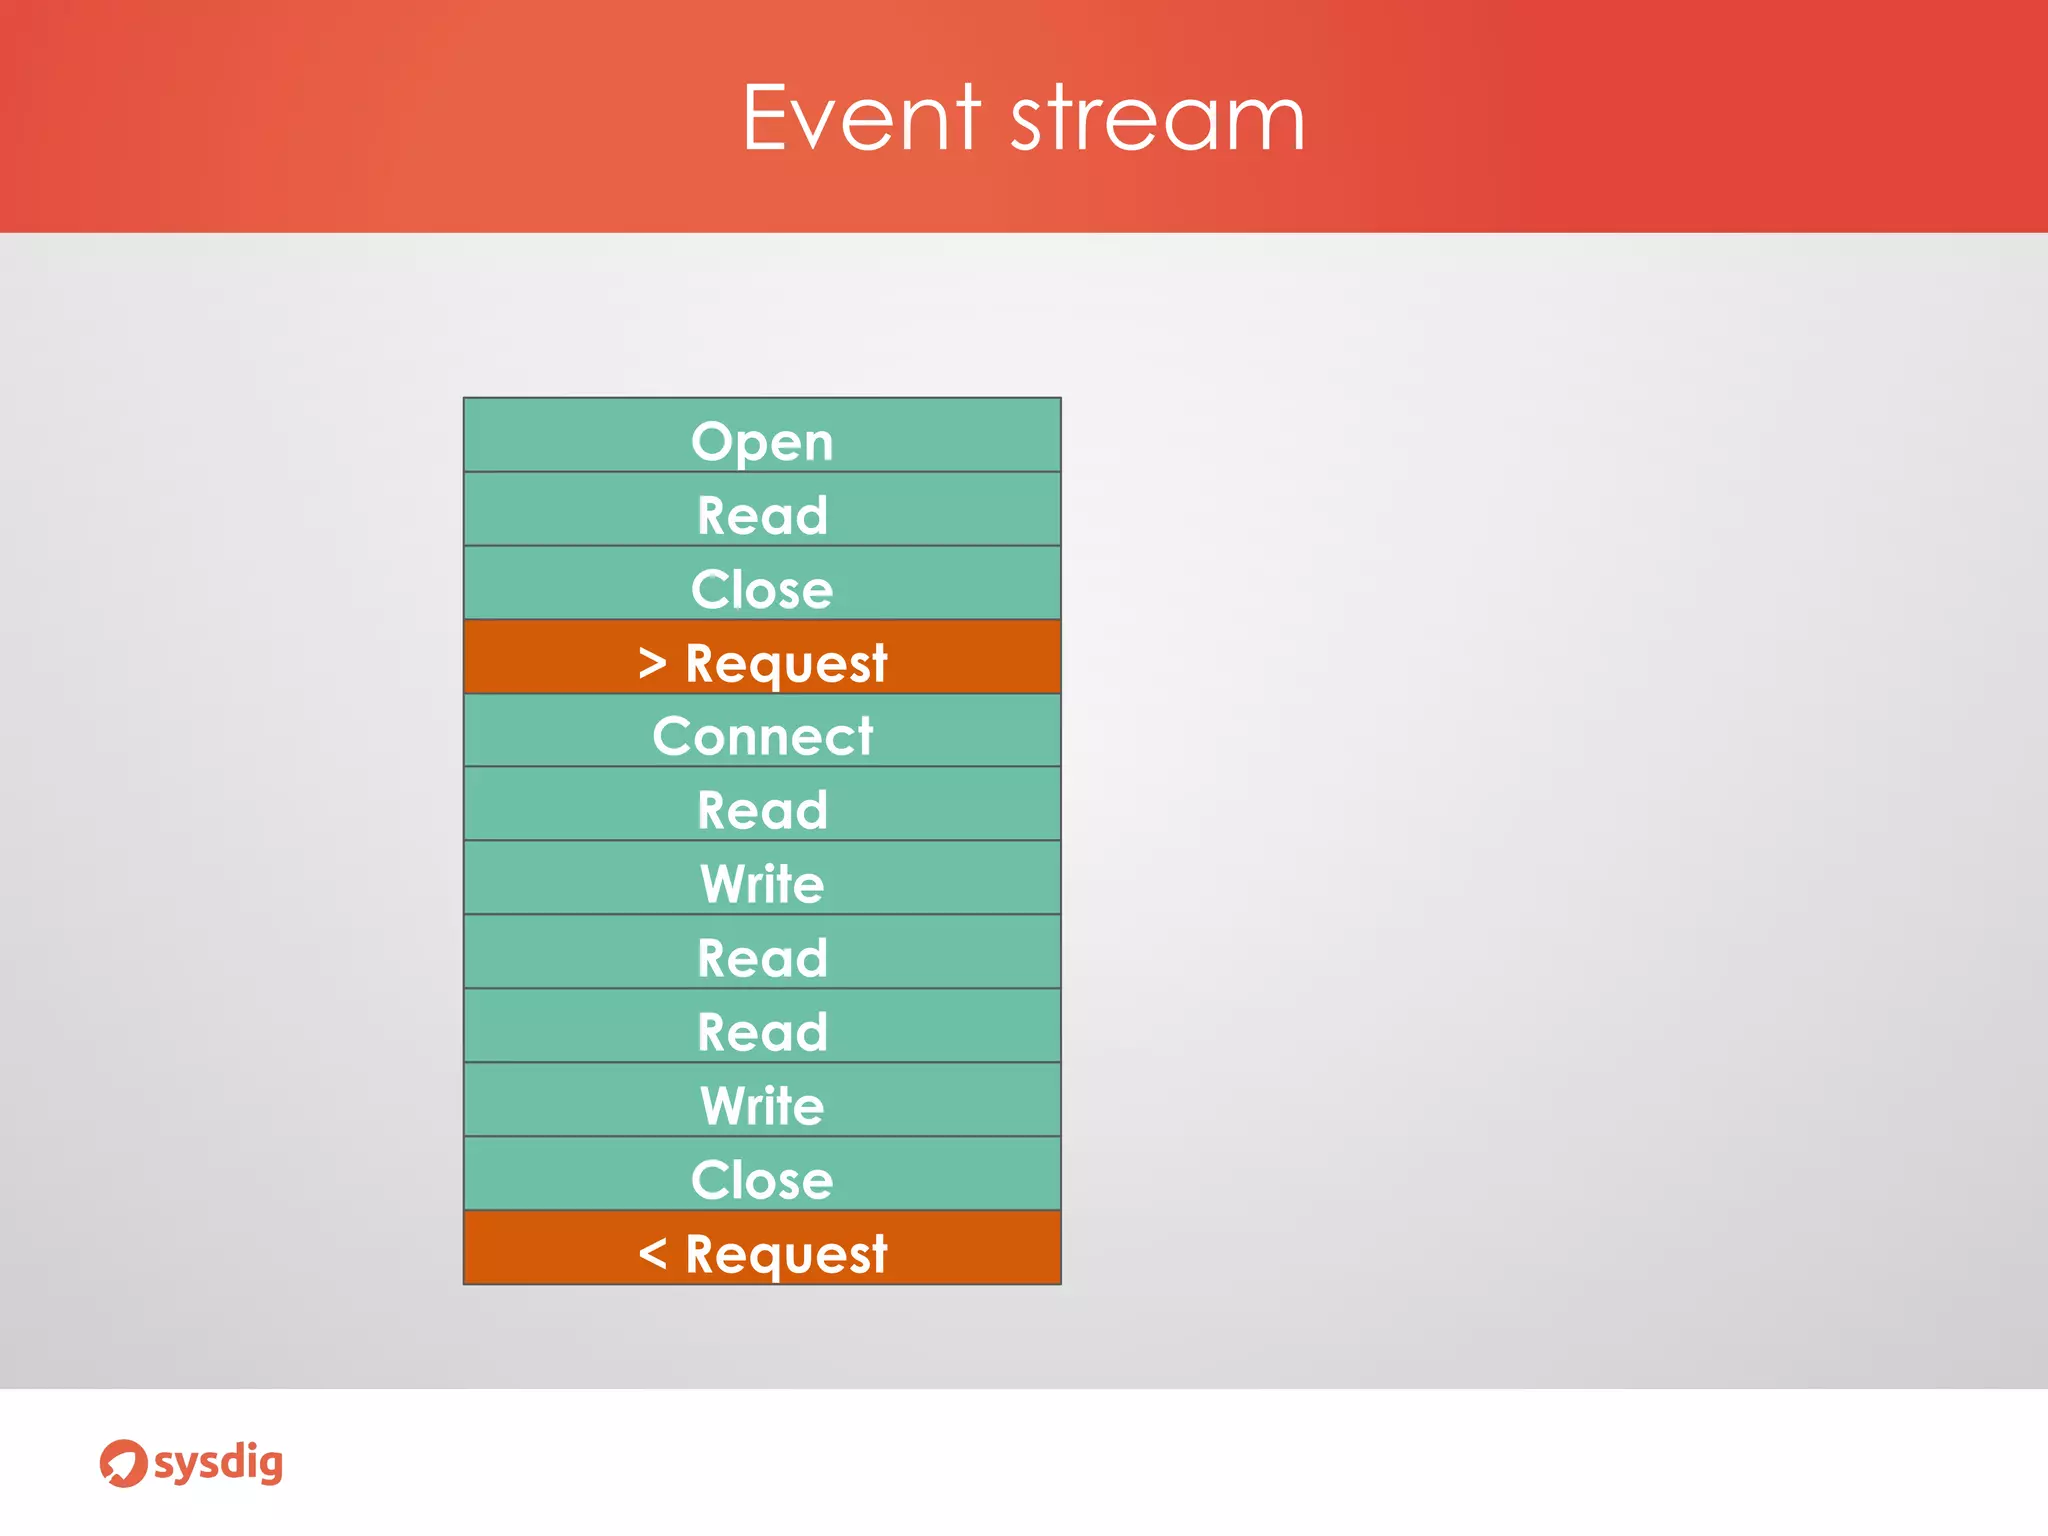
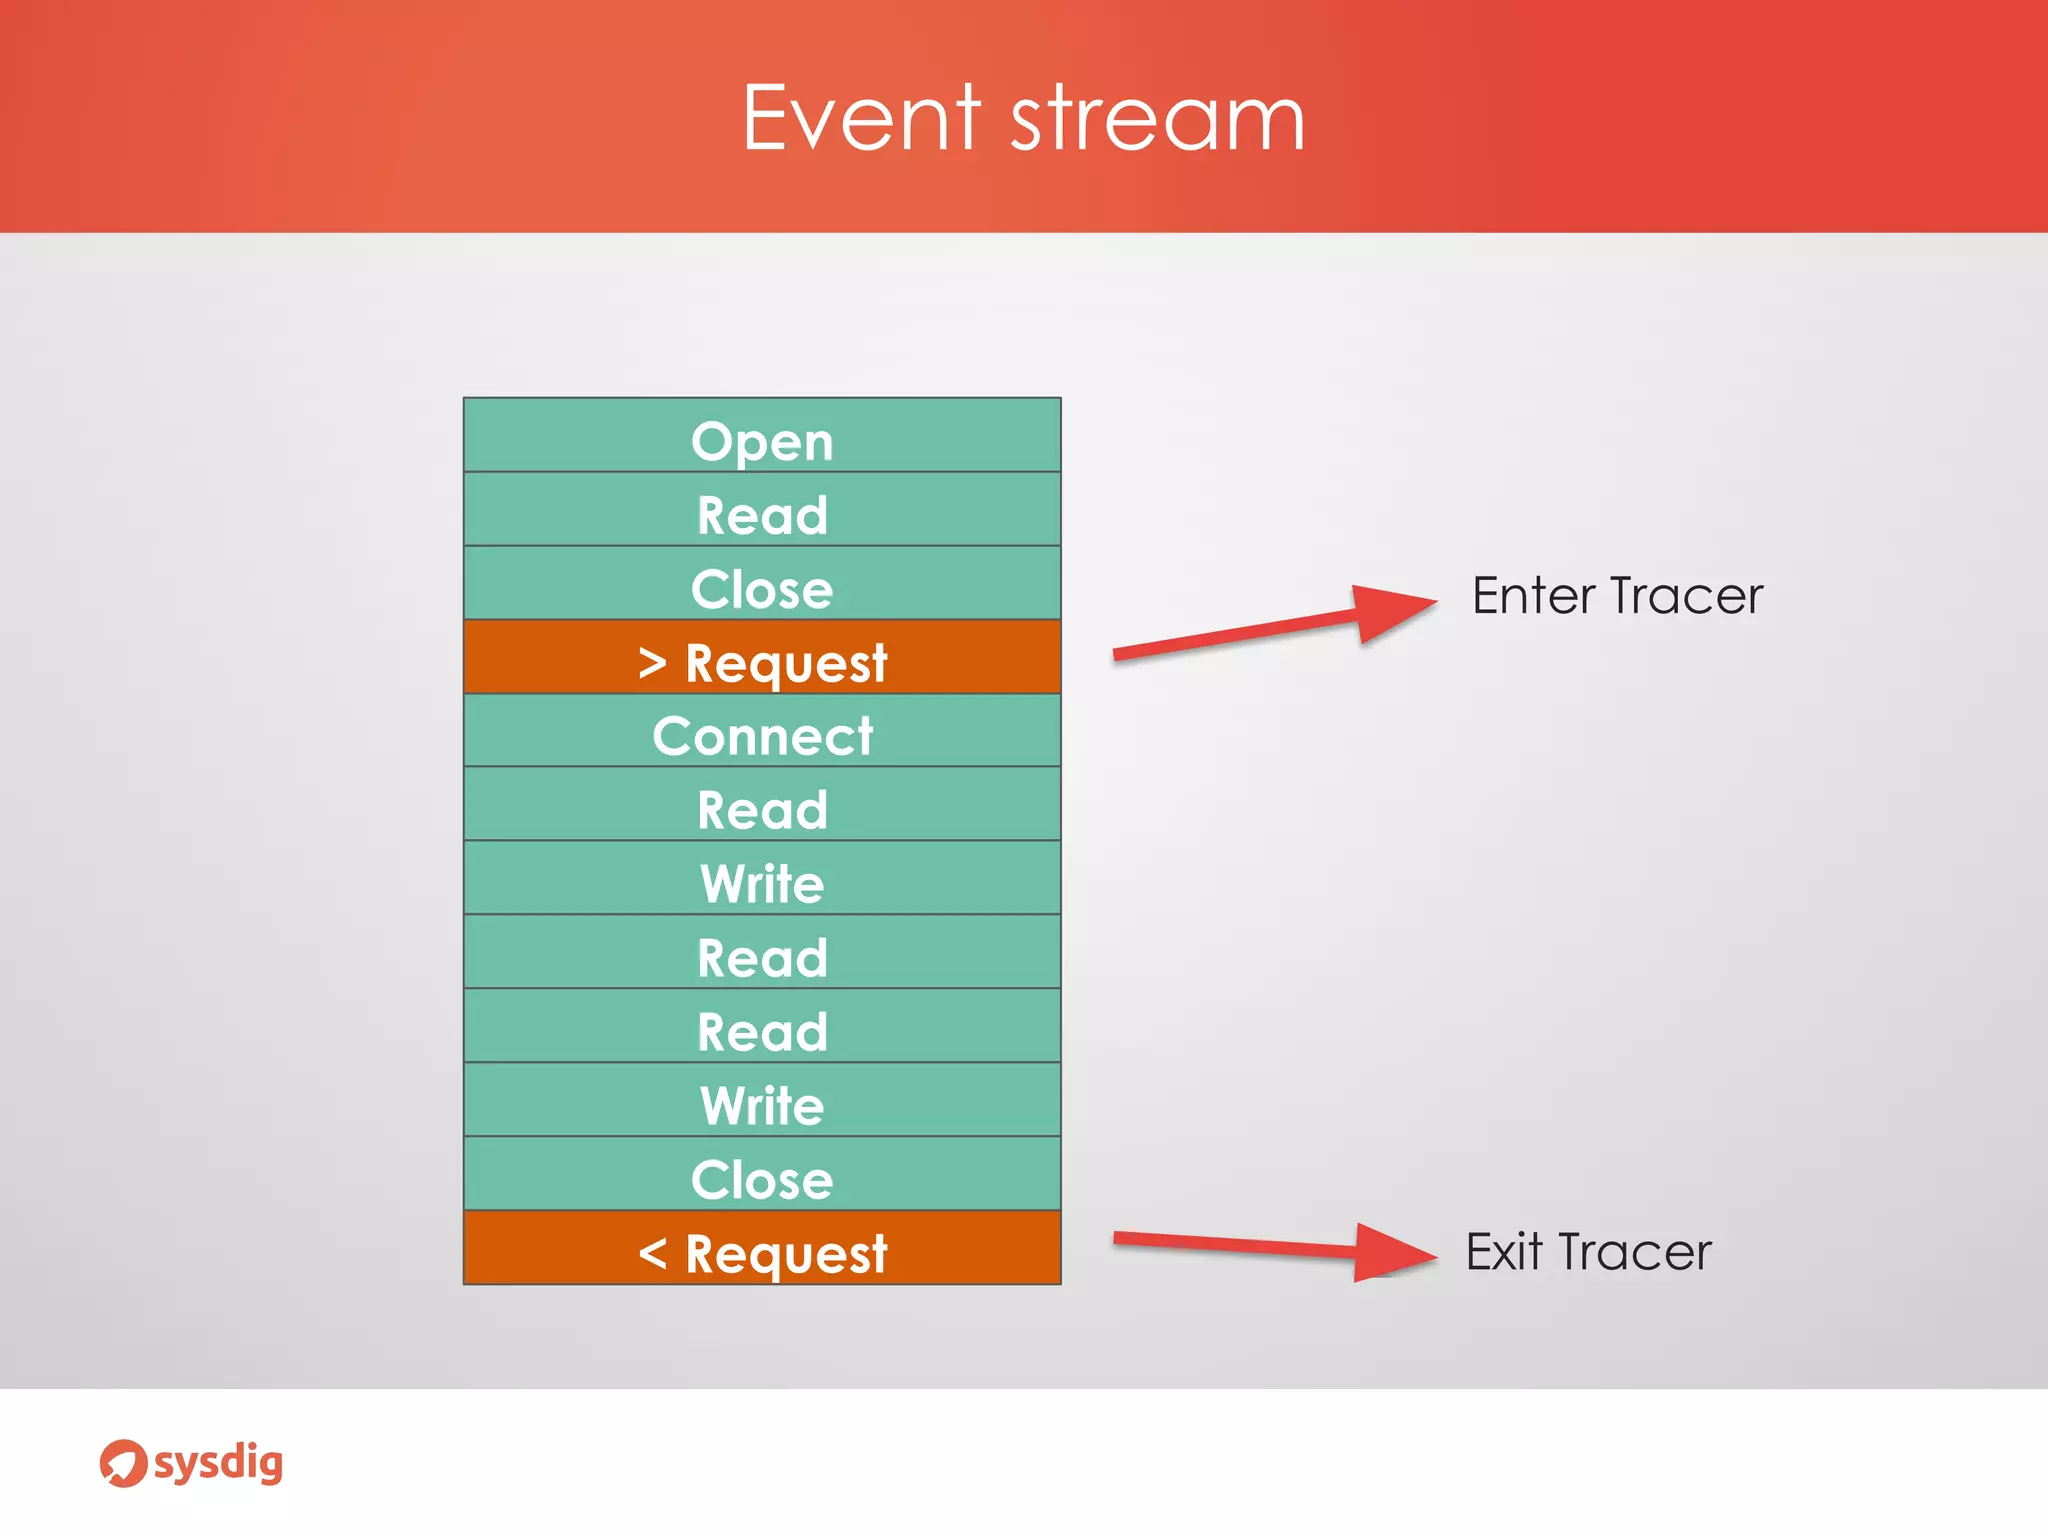
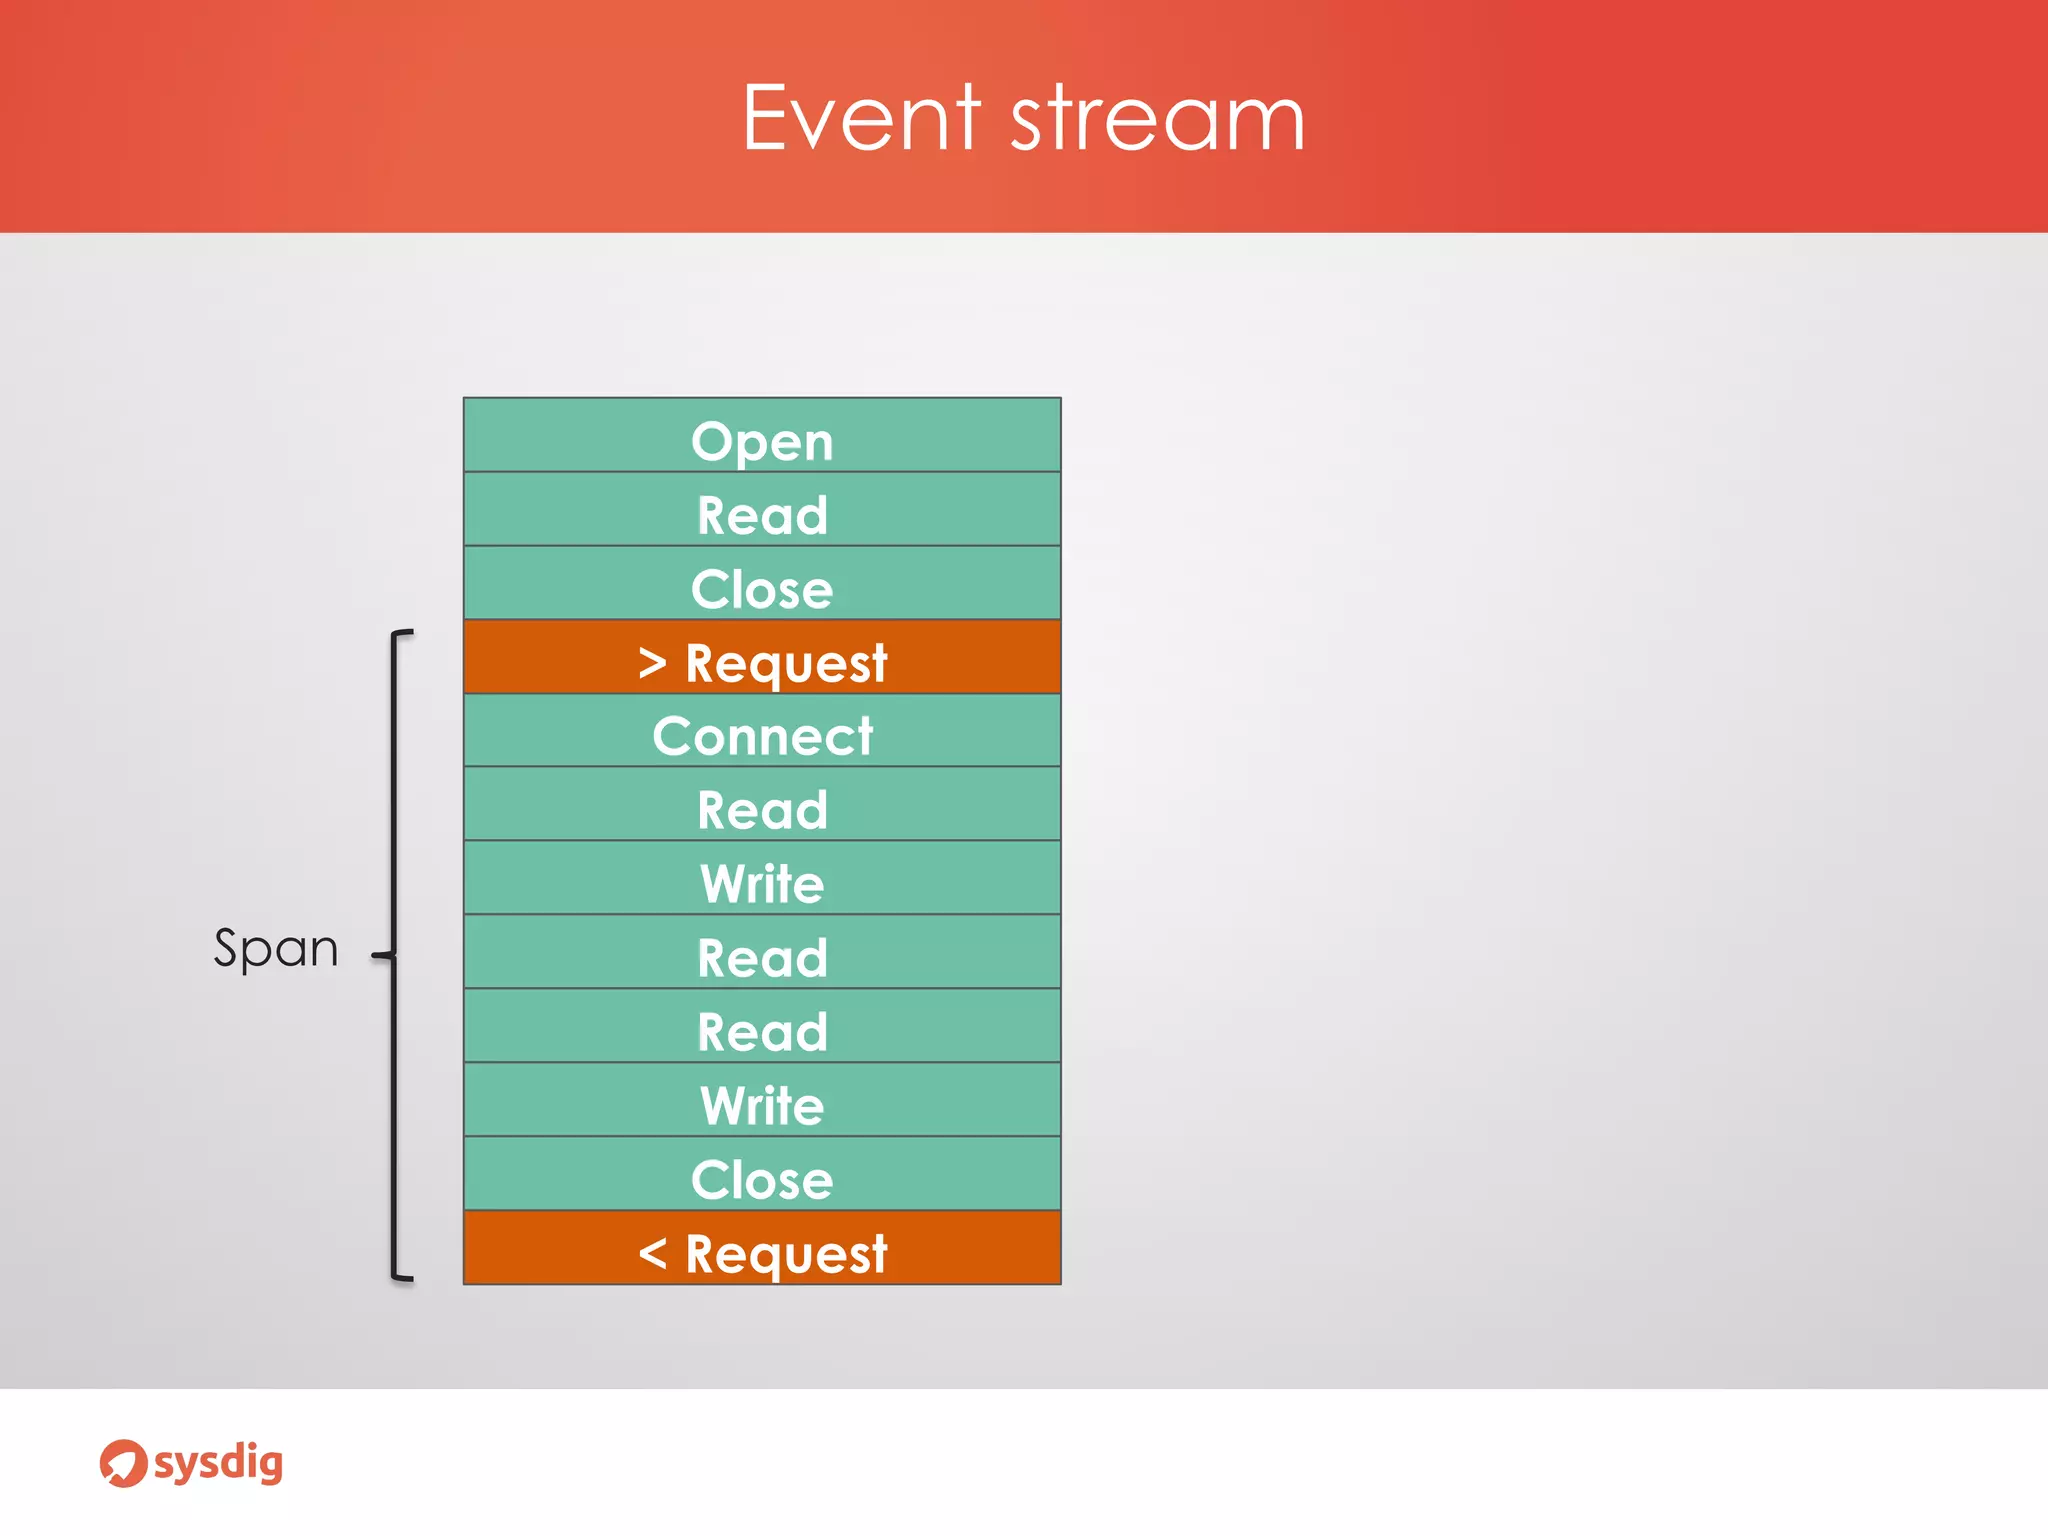
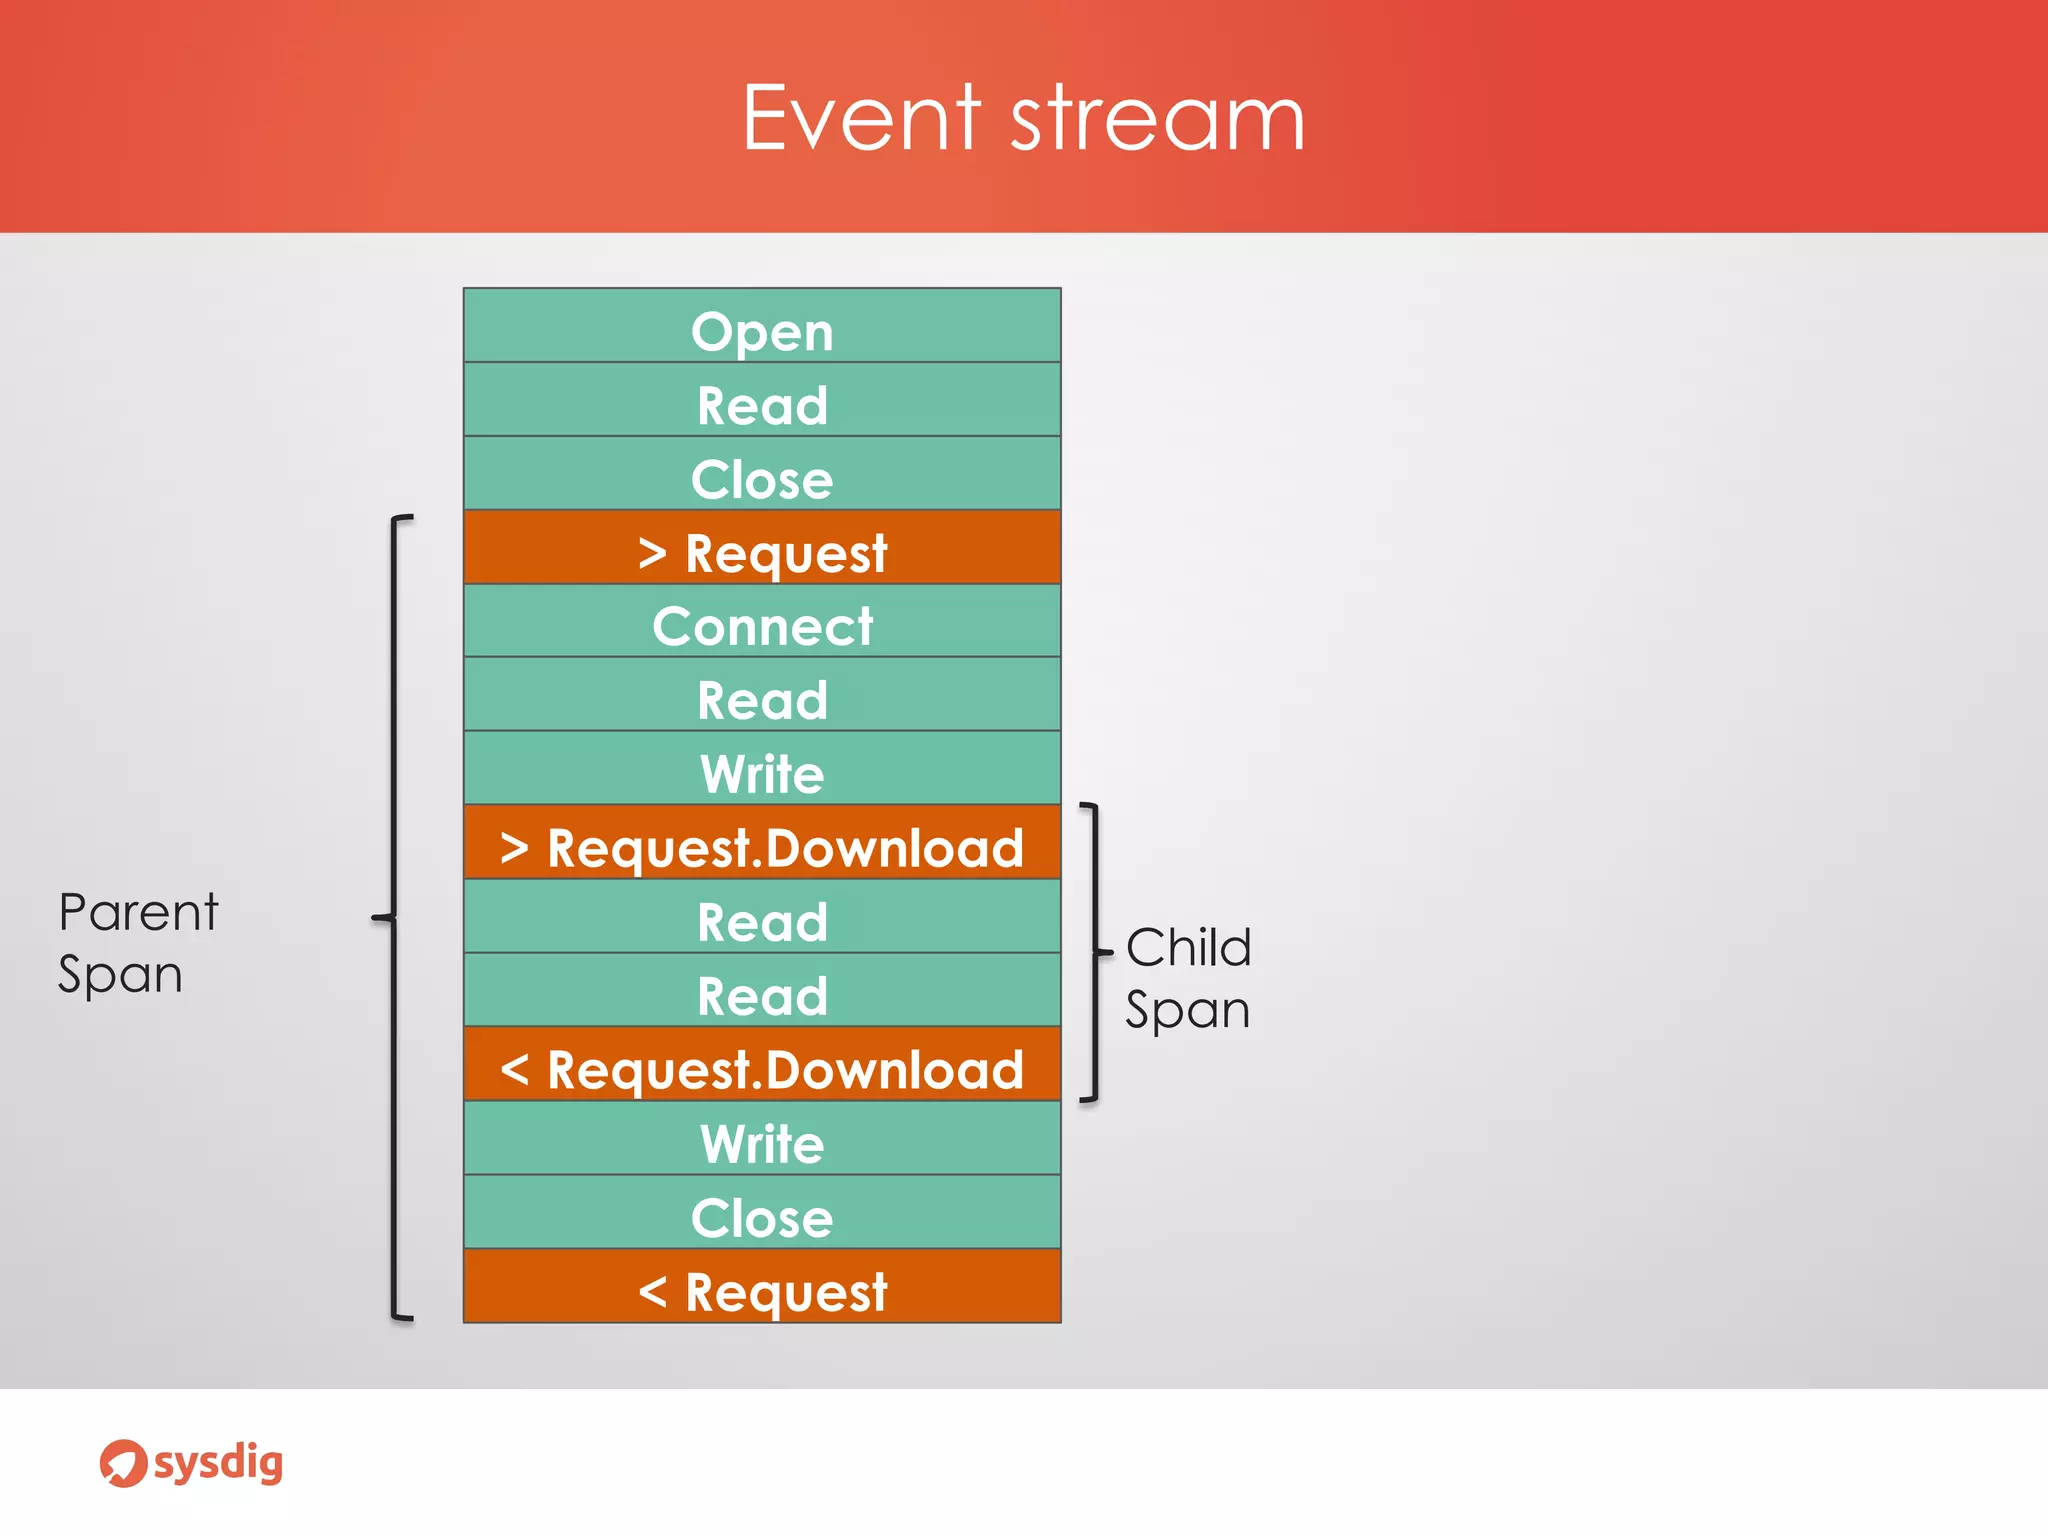
The document discusses Sysdig, an open source system troubleshooting tool with native container support. It allows capturing system events, filtering, and running scripts on them. Sysdig includes tracing capabilities through Sysdig Tracers, which can inject markers into the event stream to trace functions, network requests, and arbitrary code segments with low overhead. Traces can then be analyzed to troubleshoot performance and measure latencies in code and across systems.