
Recommended
More Related Content
What's hot
What's hot (20)
Similar to OGTT.pptx
Similar to OGTT.pptx (20)
More from SubhashreeMahapatro
More from SubhashreeMahapatro (20)
Recently uploaded
Recently uploaded (20)
OGTT.pptx
- 2. INTRODUCTION Blood glucose concentration in a normal adult remains in the range of 60-100 mg/100 ml. When the value exceeds, it is called hyperglycemia. Persistent hyperglycemia may be a result of diabetes mellitus, which is detected by estimating blood glucose concentration during fasting. To confirm the diagnosis, fasting and postprandial (after meals) samples are analyzed. Sometimes, it may also be essential to perform glucose tolerance test (GTT).
- 3. ESTIMATION OF FASTING AND POSTPRANDIAL BLOOD GLUCOSE LEVELS International Committee of Diabetologists has recommended the estimation of blood glucose in the overnight fasting and postprandial samples (2 hours after 75 g of a glucose load) to confirm the diagnosis of diabetes mellitus Accordingly, an individual is said to be normal if fasting blood glucose value is less than 100 mg/100 ml and the 2-hours' value is below 140 mg/100 ml. A fasting value of 126 mg/100 ml or higher and the 2 hours' value of more than 200 mg/100 ml is diagnostic of diabetes mellitus. Fasting value between 100-125 mg/100 ml and/or the 2 hours' value between 140-200 mg/100 ml is referred to as impaired glucose tolerance
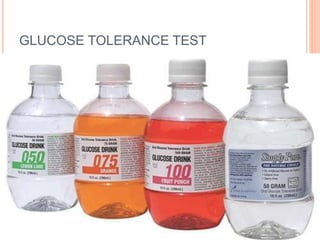
- 4. GLUCOSE TOLERANCE TEST Glucose tolerance test (GTT) is performed by giving a load of glucose, orally. It is helpful in confirming the diagnosis of diabetes in those patients whose fasting blood glucose concentration is in the upper normal limit, with transient or sustained glycosuria without the symptoms of diabetes or with family history of the disease.
- 5. WHAT IS IT The glucose tolerance test is a lab test to check how your body moves sugar from the blood into tissues like muscle and fat. The test is often used to diagnose diabetes. Tests to screen for diabetes during pregnancy are similar.
- 7. PROCEDURE For GTT, fasting venous blood sample (after 12-16 hours of fast) is drawn, in a fluoride-oxalate tube Thereafter, 75 g of glucose (about 1 g/kg body weight) is given in nearly 200-300 ml of water. Blood samples are again drawn after every 30 minutes, till 2 to 2½ hours. Urine specimen may also be collected simultaneously. Each blood sample is analyzed and glucose tolerance curve is plotted
- 9. INTERPRETATION Fasting blood glucose concentration, maximum blood glucose value after a glucose load, and the rate at which it returns to the fasting, gives an idea about the disease. For a normal individual, fasting blood glucose value should be within the normal limit. It is increased by about 50% within 60 minutes and thereafter returns towards fasting after two hours. Any deviation from the above is referred to as an abnormal glucose tolerance curve. In a patient with diabetes mellitus, fasting blood glucose level is above normal. In addition, the rise in blood glucose with time may be higher and the level may not return towards fasting. In addition, glucose may be present in urine If glucose tolerance curve is normal but there is glycosuria, it is referred to as renal glycosuria.
- 10. NORMAL CURVE The fasting level is within the normal limits (<100 mg%). The peak is reached at 1 hour and it is below the renal threshold level of 180 mg%. However it is found to be usually below 150 mg%. It returns to the fasting levels by 2 hours. Sometimes there is a greater decrease at 2 hours. than the original fasting level (dip), which usually returns to fasting values by 2½ hours. All urine samples are negative for glucose innormal response.
- 11. IMPAIRED GLUCOSE TOLERANCE CURVE (IGT) The fasting level is between 100-126 mg%, peak value may be more than the renal threshold value and the 2 hours values remain any where between 140-200 mg%. There are traces of glycosuria at the peak and 2 hours samples.
- 12. DIABETES MELLITUS CURVE (DM) This shows the maximum intolerance. The fasting levels are more than 126 mg%, the level steadily rises to significantly higher values than renal threshold level, reaching a peak at 1 hour and then gradually declining slowly, but the 2 hour level is always more than 200 mg%. The values may be much higher, indicating a severe diabetes mellitus. Clearly there is glycosuria in most of the samples of urine. Levels are usually above 200 mg% in newly diagnosed or uncontrolled diabetics.
- 13. LAG CURVE OR ALIMENTARY GLYCOSURIA In this, the GTT curve is quite normal, there is an abnormally high level at the peak time except that of 1 hour accompanied by transient glycosuria during this time. The fasting level, the return of the peak and 2hour glucose level are well within the normal limits. This is called the lag curve, on the assumption that there is lag or delay in insulin secretion. Consequently, there is an abnormally high peak. The condition is benign and does not warrant any treatment.
- 14. RENAL GLYCOSURIA CURVE Both lowered renal threshold level, as well as increased renal threshold level are seen. The latter is seen in elderly patients and also in many diabetics. (i) Lowered renal threshold: The GTT curve is very similar to a normal curve except that the peak value is a little lower than that in a normal curve. But there is transient glycosuria at this lowered peak, which is the renal threshold level for these subjects. This is usually due to reabsorption defect in renal tubules so that an appreciable amount of glucose appears in the urine. This condition is harmless and does not progress to become diabetes mellitus. This is also sometimes seen in later stages of pregnancy.
- 15. (ii) Raised renal threshold: Here the glycosuria does not occur even at significantly higher levels than the normal renal threshold of 160-180 mg%. This is seen in elderly people and in many diabetics. Probably the glomerular arteriosclerosis leading to reduced GFR is responsible. At reduced glucose concentration may be reached before GFR, a higher the tubular reabsorptive capacity of glucose is saturated. Blood glucose levels of 200 mg% or more have been found without any glycosuria in the elderly.
- 16. FLAT CURVE-INCREASED GLUCOSE TOLERANCE These patients show very little effect of glucose load on their fasting level, which is well within the normal limits. The peak values are also relatively very low and there is no glycosuria at all. Such a curve is referred to as flat curve. For example glucose levels at half hourly intervals, starting from fasting level, could be 75, 90, 115, 95, 85, 80 (mg%).This is usually seen in hypoactivity of endocrinal glands e.g. hypothyroidism, hypoadrenalism (Addison's disease), hypopituitarism (Simmond's disease) etc. Steatorrhoea as a result of impaired absorption also leads to flat curves.
- 17. GTT IN GESTATIONAL DIABETES MELLITUS GTT is done in pregnant women above 25 age with risk factors like history of diabetes in the years of previous pregnancy or in the family, or advanced maternal age. 75g of glucose load is given. Hourly samples are collected for 2 hours. The accepted upper normal limits are 125 mg% (F); 180 mg% (1 hour.); 199 mg% (2 hours) and 145 mg% (3 hours). At least two values should exceed the above values.
- 18. INTRAVENOUS GTT (IV-GTT) This is done in situations where oral administration is not feasible e.g. (a) some patients can't tolerate oral glucose load, or (b) malabsorption syndrome of the intestine or (c) partial gastrectomy etc. where glucose absoption is inadequate. Glucose load at the rate of 0.5 g/kg body weight is given as a 25 g/dL solution intravenuously. Blood samples are collected at 30, 60, 90 and 120 minutes after infusion. Peak levels are reached at 30 minutes and it returns to basal level in 60 minutes in a normal individual. In diabetics, basal level takes longer, usually 2 hours or more.
- 19. EXTENDED GTT In this form, the test is extended upto 4-5 hours instead of the usual 2½ hours. It is usually done in cases characterised by post prandial hypoglycemia which is usually transient and is relieved by taking glucose. It is commonly seen in patients who have undergone partial gastrectomy or with B-cell islet tumor called insulinoma. Rapid emptying of the stomach and excessive insulin secretion is the cause of hypoglycemia which is not significantly low, but is usually accompanied by symptoms.