Dutch Bros Inc. (BROS) Stock Analysis Report
•
0 likes•47 views

Based on the Dutch Bros Inc. stock forecasts from 8 analysts, the average analyst target price for Dutch Bros Inc. is USD 52.67 over the next 12 months. Dutch Bros Inc.’s average analyst rating is Strong Buy. Stock Target Advisor’s own stock analysis of Dutch Bros Inc. is Neutral, which is based on 3 positive signals and 3 negative signals. At the last closing, Dutch Bros Inc.’s stock price was USD 27.00. Dutch Bros Inc.’s stock price has changed by -40.74% over the past week, -49.05% over the past month and 0% over the last year.

Recommended
Recommended
More Related Content
Similar to Dutch Bros Inc. (BROS) Stock Analysis Report
Similar to Dutch Bros Inc. (BROS) Stock Analysis Report (20)
More from Stock Target Advisor
More from Stock Target Advisor (20)
Recently uploaded
Recently uploaded (20)
Dutch Bros Inc. (BROS) Stock Analysis Report
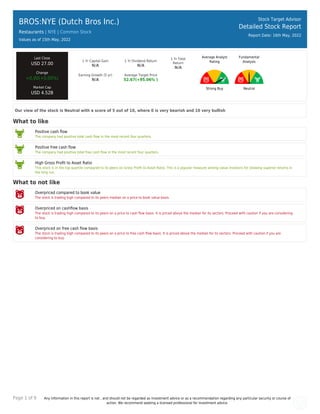
- 1. Page 1 of 9 Any information in this report is not , and should not be regarded as investment advice or as a recommendation regarding any particular security or course of action. We recommend seeking a licensed professional for investment advice. BROS:NYE (Dutch Bros Inc.) Restaurants | NYE | Common Stock Values as of 15th May, 2022 Stock Target Advisor Detailed Stock Report Report Date: 16th May, 2022 Last Close USD 27.00 Change +0.00(+0.00%) Market Cap USD 4.52B 1 Yr Capital Gain N/A 1 Yr Dividend Return N/A 1 Yr Total Return N/A Earning Growth (5 yr) N/A Average Target Price 52.67(+95.06% ) Average Analyst Rating Strong Buy Fundamental Analysis Neutral Our view of the stock is Neutral with a score of 5 out of 10, where 0 is very bearish and 10 very bullish What to like Positive cash flow The company had positive total cash flow in the most recent four quarters. Positive free cash flow The company had positive total free cash flow in the most recent four quarters. High Gross Profit to Asset Ratio This stock is in the top quartile compared to its peers on Gross Profit to Asset Ratio. This is a popular measure among value investors for showing superior returns in the long run. What to not like Overpriced compared to book value The stock is trading high compared to its peers median on a price to book value basis. Overpriced on cashflow basis The stock is trading high compared to its peers on a price to cash flow basis. It is priced above the median for its sectors. Proceed with caution if you are considering to buy. Overpriced on free cash flow basis The stock is trading high compared to its peers on a price to free cash flow basis. It is priced above the median for its sectors. Proceed with caution if you are considering to buy.
- 2. Page 2 of 9 Any information in this report is not , and should not be regarded as investment advice or as a recommendation regarding any particular security or course of action. We recommend seeking a licensed professional for investment advice. BROS:NYE (Dutch Bros Inc.) Restaurants | | Common Stock Stock Target Advisor Detailed Stock Report Report Date: 16th May, 2022 Adjusted Closing Share Volume Relative Returns Relative Performance (Total Returns) Security Capital Gain Dividend Return Total Return BROS Dutch Bros Inc. -26.4% 0 -26.4% VTI Vanguard Index Funds - Vanguard Total Stock Market ETF -13.1% +1% -12.1% Company Overview Dutch Bros Inc. operates and franchises drive-thru shops. It offers Dutch Bros hot and cold espresso-based beverages, and cold brew coffee products, as well as Blue Rebel energy drinks, tea, lemonade, smoothies, and other beverages through company-operated shops and online channels. As of December 31, 2021, it operated 538 drive-thru coffee locations in Arizona, California, Colorado, Idaho, Kansas, Nevada, New Mexico, Oklahoma, Oregon, Texas, Utah, and Washington. The company was founded in 1992 and is headquartered in Grants Pass, Oregon.
- 3. Page 3 of 9 Any information in this report is not , and should not be regarded as investment advice or as a recommendation regarding any particular security or course of action. We recommend seeking a licensed professional for investment advice. Company Website https://www.dutchbros.com Address 110 SW 4th Street, Grants Pass, OR, United States, 97526 Fiscal Year End December Employees 11000 Technical Indicators Value Value Beta N/A 52 Week High 81.40 Short Ratio 4.14 52 Week Low 20.05 Shorted Shares 7,322,409 200 Day Moving Average 51.98 Shorted Shares Previous Month 8,132,017 50 Day Moving Average 50.59 Shares Held By Insiders 1,491.40% Short Percentage 3.00% Shares Held by Institutions 57.42 Dividend Yield N/A
- 4. Page 4 of 9 Any information in this report is not , and should not be regarded as investment advice or as a recommendation regarding any particular security or course of action. We recommend seeking a licensed professional for investment advice. BROS:NYE (Dutch Bros Inc.) Restaurants | | Common Stock Stock Target Advisor Detailed Stock Report Report Date: 16th May, 2022 Market Performance Market Performance vs. Industry / Classification (Restaurants) Market Performance vs. Exchange (Nasdaq Global Select) Value Sector Median Percentile Rank Grade Market Median Percentile Rank Grade YTD Capital Gain -46.97% -18.7% 6% -13.5% 6% Dividend Return N/A 0.6% N/A 0.9% N/A Total Return -46.97% -14.3% 6% -12.8% 6% Trailing 12 Months Capital Gain N/A -20.2% N/A -11.1% N/A Dividend Return N/A 0.9% N/A 2.8% N/A Total Return N/A -19.3% N/A -8.4% N/A Trailing 5 Years Capital Gain N/A 28.2% N/A 4.8% N/A Dividend Return N/A 11.3% N/A 12.9% N/A Total Return N/A 28.2% N/A 20.1% N/A Average Annual (5 Year Horizon) Capital Gain N/A 19.5% N/A 5.0% N/A Dividend Return N/A 1.8% N/A 2.1% N/A Total Return N/A 21.9% N/A 8.1% N/A Risk Return Profile Volatility (Standard Deviation) N/A 43.6% N/A 22.8% N/A Risk Adjusted Return N/A N/A N/A 40.9% N/A Market Capitalization 4.52B 1.83B 61% 1.27B 73%
- 5. Page 5 of 9 Any information in this report is not , and should not be regarded as investment advice or as a recommendation regarding any particular security or course of action. We recommend seeking a licensed professional for investment advice. Key Financial Ratios Ratios vs. Industry / Classification (Computer Hardware) Ratios vs. Exchange (Nasdaq Global Select) Value Sector Median Percentile Rank Grade Market Median Percentile Rank Grade Market Value peratio N/A 18.6 N/A 16.2 N/A pbratio 14.4 3.1 15% 1.6 5% pcfratio 56.2 14.4 11% 7.2 5% pfcfratio 106.0 13.1 6% 10.8 3% Management Effectiveness retequity N/A 6.2% N/A 10.3% N/A retinvcap -56.80% 10.7% 6% 5.5% 4% retass -17.41% 3.8% 6% 2.6% 3% debtequityratio 1.67% 23.1% 54% 69.0% 92% Technical Ratios yield N/A 2.7% N/A 7.2% N/A sratio 4.14 3.84 44% 2.12 24% spercent 21.55% 2.8% 6% 3.6% 21% beta N/A 1.22 N/A 1.04 N/A
- 6. Page 6 of 9 Any information in this report is not , and should not be regarded as investment advice or as a recommendation regarding any particular security or course of action. We recommend seeking a licensed professional for investment advice. BROS:NYE (Dutch Bros Inc.) Restaurants | | Common Stock Stock Target Advisor Detailed Stock Report Report Date: 16th May, 2022 Recent Analyst Ratings Price Action Rating Action Analyst Rating Price date Downgraded by Stifel Nicolaus Research Buy » Hold USD 70 » USD 30 2022-05-12 Target Lowered by Robert W Baird USD 60 » USD 30 2022-05-12 Target Lowered by Bank of America Securities USD 80 » USD 64 2022-05-12 Target Lowered by Cowen USD 65 » USD 35 2022-05-12 Initiated by Gordon Haskett Buy USD 64 2022-04-13 Target Lowered by Piper Sandler Overweight USD 85 » USD 75 2022-04-05 Target Lowered by Cowen Outperform USD 70 » USD 65 2022-03-02 Maintains Barclays Equal-Weight USD 56 » USD 53 2021-12-15 Target Raised by JP Morgan & Company Overweight » Overweight USD 47 » USD 58 2021-12-14 Maintains Cowen Outperform USD 50 » USD 70 2021-11-11 Reiterated by Piper Sandler Overweight USD 60 » USD 85 2021-11-11 Target Raised by Stifel Nicolaus Research Buy USD 52 » USD 70 2021-11-11 Target Raised by Bank of America Securities Buy USD 55 » USD 80 2021-10-27 Initiates Coverage On Cowen Outperform USD 50 2021-10-11 Initiated by Robert W Baird Outperform USD 56 2021-10-11 Initiated by Bank of America Securities Buy USD 55 2021-10-11 Initiated by Piper Sandler Overweight USD 60 2021-10-11 Initiated by William Blair Outperform 2021-10-11 Initiated by Stifel Nicolaus Research Buy USD 52 2021-10-11 Initiates Coverage On Barclays Equal-Weight USD 40 2021-10-11 Initiated by JP Morgan & Company Overweight USD 47 2021-10-11 Initiated by Jefferies Financial LLC Buy USD 60 2021-10-11
- 7. Page 7 of 9 Any information in this report is not , and should not be regarded as investment advice or as a recommendation regarding any particular security or course of action. We recommend seeking a licensed professional for investment advice. BROS:NYE (Dutch Bros Inc.) Restaurants | | Common Stock Stock Target Advisor Detailed Stock Report Report Date: 16th May, 2022 Annual Financial (USD)
- 8. Page 8 of 9 Any information in this report is not , and should not be regarded as investment advice or as a recommendation regarding any particular security or course of action. We recommend seeking a licensed professional for investment advice. BROS:NYE (Dutch Bros Inc.) Restaurants | | Common Stock Stock Target Advisor Detailed Stock Report Report Date: 16th May, 2022 Quarterly Financial (USD)
- 9. Page 9 of 9 Any information in this report is not , and should not be regarded as investment advice or as a recommendation regarding any particular security or course of action. We recommend seeking a licensed professional for investment advice. BROS:NYE (Dutch Bros Inc.) Restaurants | | Common Stock Stock Target Advisor Detailed Stock Report Report Date: 16th May, 2022 Largest Industry Peers for Restaurants Symbol Company Name Price(Change) Market Cap MCD McDonald's Corporation N/A USD 181.22B CMG Chipotle Mexican Grill Inc N/A USD 36.86B YUM Yum! Brands Inc N/A USD 32.18B QSR Restaurant Brands Internationa.. N/A USD 22.65B YUMC Yum China Holdings Inc N/A USD 16.28B DRI Darden Restaurants Inc N/A USD 15.97B DPZ Domino's Pizza Inc N/A USD 12.29B SG Sweetgreen Inc. N/A USD 1.93B SHAK Shake Shack Inc N/A USD 1.83B CNNE Cannae Holdings Inc N/A USD 1.63B The Stock Target Advisor platform run millions of calculations every day on over 30,000 Canadian and American stocks, comparing and ranking their financial and market performance against their sectors and exchange. We represent the percentile ranking using the following grading system. Letter Grade Percentage Letter Grade Percentage Letter Grade Percentage A+ 97%-100% A 93%-96% A- 90%-92% B+ 97%-89% B 83%-86% B- 80%-82% C+ 77%-79% C 73%-76% C- 70%-72% D+ 67%-69% D 63%-66% D- 60%-62% F 0%-59%