Cineplex Inc (CGX) Stock Analysis Report
•
0 likes•46 views

Cineplex Inc., together with its subsidiaries, operates as an entertainment and media company in Canada and internationally. Based on the Cineplex Inc stock forecasts from 7 analysts, the average analyst target price for Cineplex Inc is CAD 18.16 over the next 12 months. Cineplex Inc’s average analyst rating is Strong Buy. Stock Target Advisor’s own stock analysis of Cineplex Inc is Slightly Bearish, which is based on 4 positive signals and 9 negative signals. At the last closing, Cineplex Inc’s stock price was CAD 12.76. Cineplex Inc’s stock price has changed by +9.72% over the past week, -0.93% over the past month and -2.15% over the last year.

Recommended
Recommended
More Related Content
Similar to Cineplex Inc (CGX) Stock Analysis Report
Similar to Cineplex Inc (CGX) Stock Analysis Report (20)
More from Stock Target Advisor
More from Stock Target Advisor (20)
Recently uploaded
Recently uploaded (20)
Cineplex Inc (CGX) Stock Analysis Report
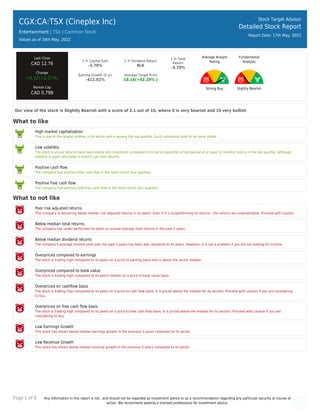
- 1. Page 1 of 9 Any information in this report is not , and should not be regarded as investment advice or as a recommendation regarding any particular security or course of action. We recommend seeking a licensed professional for investment advice. CGX:CA:TSX (Cineplex Inc) Entertainment | TSX | Common Stock Values as of 16th May, 2022 Stock Target Advisor Detailed Stock Report Report Date: 17th May, 2022 Last Close CAD 12.76 Change +0.32(+2.57%) Market Cap CAD 0.79B 1 Yr Capital Gain -3.70% 1 Yr Dividend Return N/A 1 Yr Total Return -3.70% Earning Growth (5 yr) -412.02% Average Target Price 18.16(+42.29% ) Average Analyst Rating Strong Buy Fundamental Analysis Slightly Bearish Our view of the stock is Slightly Bearish with a score of 3.1 out of 10, where 0 is very bearish and 10 very bullish What to like High market capitalization This is one of the largest entities in its sector and is among the top quartile. Such companies tend to be more stable. Low volatility The stock’s annual returns have been stable and consistent compared to its sector peers(for a hold period of at least 12 months) and is in the top quartile. Although stability is good, also keep in mind it can limit returns. Positive cash flow The company had positive total cash flow in the most recent four quarters. Positive free cash flow The company had positive total free cash flow in the most recent four quarters. What to not like Poor risk adjusted returns This company is delivering below median risk adjusted returns in its peers. Even if it is outperforming on returns , the returns are unpredictable. Proceed with caution. Below median total returns The company has under performed its peers on annual average total returns in the past 5 years. Below median dividend returns The company’s average income yield over the past 5 years has been low compared to its peers. However, it is not a problem if you are not looking for income. Overpriced compared to earnings The stock is trading high compared to its peers on a price to earning basis and is above the sector median. Overpriced compared to book value The stock is trading high compared to its peers median on a price to book value basis. Overpriced on cashflow basis The stock is trading high compared to its peers on a price to cash flow basis. It is priced above the median for its sectors. Proceed with caution if you are considering to buy. Overpriced on free cash flow basis The stock is trading high compared to its peers on a price to free cash flow basis. It is priced above the median for its sectors. Proceed with caution if you are considering to buy. Low Earnings Growth This stock has shown below median earnings growth in the previous 5 years compared to its sector Low Revenue Growth This stock has shown below median revenue growth in the previous 5 years compared to its sector
- 2. Page 2 of 9 Any information in this report is not , and should not be regarded as investment advice or as a recommendation regarding any particular security or course of action. We recommend seeking a licensed professional for investment advice. CGX:CA:TSX (Cineplex Inc) Entertainment | | Common Stock Stock Target Advisor Detailed Stock Report Report Date: 17th May, 2022 Adjusted Closing Share Volume Relative Returns Relative Performance (Total Returns) Security Capital Gain Dividend Return Total Return CGX:CA Cineplex Inc -2.1% 0 -2.1% XIU:CA iShares S&P/TSX 60 Index ETF +5.7% +2.7% +8.5% Company Overview Cineplex Inc., together with its subsidiaries, operates as an entertainment and media company in Canada and internationally. It operates through four segments: Film Entertainment and Content, Media, Amusement and Leisure, and Location-Based Entertainment. The company engages in theatre exhibition and theatre food service activities. It also provides alternative programming service; rents and sells movies in digital form; and operates cineplex.com, an entertainment site that offers streaming video, movie information, showtimes and ability to buy tickets online, entertainment news, and box office reports, as well as advertising and digital commerce opportunities. In addition, the company offers Cineplex mobile app for various devices; incorporates advertising mediums related to theatre exhibition, and digital place- based media that provides digital signage solutions; and designs, installs, maintains, and operates digital signage networks in various verticals, including digital out of home, quick service restaurants, financial institutions, and retailers. Further, it distributes and operates amusement, gaming, and vending equipment; and operates social entertainment destinations featuring gaming, entertainment, and dining under The Rec Room and Playdium names. As of December 31, 2021, the company owned, leased, or had interest in 1,652 screens in 160 theatres, as well as 13 location-based entertainment venues in 6 provinces. Cineplex Inc. was founded in 1912 and is headquartered in Toronto, Canada. Address: 1303 Yonge Street, Toronto, ON, Canada, M4T 2Y9
- 3. Page 3 of 9 Any information in this report is not , and should not be regarded as investment advice or as a recommendation regarding any particular security or course of action. We recommend seeking a licensed professional for investment advice. Company Website https://www.cineplex.com Address 1303 Yonge Street, Toronto, ON, Canada, M4T 2Y9 Fiscal Year End December Employees 10000 Technical Indicators Value Value Beta 3.21 52 Week High 16.76 Short Ratio 16.70 52 Week Low 10.93 Shorted Shares 5,228,642 200 Day Moving Average 13.16 Shorted Shares Previous Month 5,187,058 50 Day Moving Average 12.94 Shares Held By Insiders 131.90% Short Percentage 6.00% Shares Held by Institutions 26.01 Dividend Yield 13.74%
- 4. Page 4 of 9 Any information in this report is not , and should not be regarded as investment advice or as a recommendation regarding any particular security or course of action. We recommend seeking a licensed professional for investment advice. CGX:CA:TSX (Cineplex Inc) Entertainment | | Common Stock Stock Target Advisor Detailed Stock Report Report Date: 17th May, 2022 Market Performance Market Performance vs. Industry / Classification (Entertainment) Market Performance vs. Exchange (Nasdaq Global Select) Value Sector Median Percentile Rank Grade Market Median Percentile Rank Grade YTD Capital Gain -6.25% -22.7% 100% -9.9% 63% Dividend Return N/A N/A N/A 1.0% N/A Total Return -6.25% -22.7% 100% -9.3% 61% Trailing 12 Months Capital Gain -3.70% -30.5% 75% -5.6% 58% Dividend Return N/A N/A N/A 2.6% N/A Total Return -3.70% -30.5% 75% -4.0% 51% Trailing 5 Years Capital Gain -75.43% -75.4% 50% 6.5% 5% Dividend Return 8.89% 8.9% 50% 11.4% 34% Total Return -66.54% -66.5% 50% 17.5% 7% Average Annual (5 Year Horizon) Capital Gain -11.23% -6.6% 25% 4.6% 4% Dividend Return 3.01% 3.0% 50% 1.8% 74% Total Return -8.22% -6.6% 25% 6.3% 5% Risk Return Profile Volatility (Standard Deviation) 48.38% 57.1% 75% 15.9% 18% Risk Adjusted Return -17.00% N/A 50% 40.7% 14% Market Capitalization 0.79B 0.47B 75% 0.47B 63%
- 5. Page 5 of 9 Any information in this report is not , and should not be regarded as investment advice or as a recommendation regarding any particular security or course of action. We recommend seeking a licensed professional for investment advice. Key Financial Ratios Ratios vs. Industry / Classification (Computer Hardware) Ratios vs. Exchange (Nasdaq Global Select) Value Sector Median Percentile Rank Grade Market Median Percentile Rank Grade Market Value peratio 40.7 5.5 33% 13.5 12% pbratio 32.7 7.3 25% 1.4 2% pcfratio 12.9 4.4 25% 7.3 20% pfcfratio 27.1 14.4 25% 9.2 15% Management Effectiveness retequity -1,616.98% -7.5% 25% 9.0% 1% retinvcap -26.90% -0.7% 25% 4.3% 10% retass -5.98% -0.6% 25% 2.5% 15% debtequityratio -336.43% 123.1% 100% 50.5% 99% Technical Ratios yield 13.74% 5.9% 100% 6.5% 58% sratio 16.70 16.70 50% 1.76 6% spercent 7.24% 1.5% 25% 2.1% 40% beta 3.21 1.71 33% 1.04 3%
- 6. Page 6 of 9 Any information in this report is not , and should not be regarded as investment advice or as a recommendation regarding any particular security or course of action. We recommend seeking a licensed professional for investment advice. CGX:CA:TSX (Cineplex Inc) Entertainment | | Common Stock Stock Target Advisor Detailed Stock Report Report Date: 17th May, 2022 Recent Analyst Ratings Price Action Rating Action Analyst Rating Price date Target Up Canaccord Capital Speculative Buy CAD 18 2022-05-16 Maintains BMO Financial Hold CAD 15 2022-05-16 Maintains Scotiabank Capital Outperform CAD 20 2022-05-16 Assigns STA Research Hold CAD 20 2022-05-16 Maintains CIBC Capital Markets Outperform CAD 19 2022-02-15 Maintains Scotiabank Capital Outperform CAD 20 2022-02-14 Maintains BMO Financial Hold CAD 15 2022-02-14 Target RBC Royalbank Sector Perform CAD 15 2022-02-14 Target Down Canaccord Capital Speculative Buy CAD 17 2022-02-14 Maintains TD Research Buy CAD 19.5 2022-02-11 Maintains Scotiabank Capital Outperform CAD 20 2022-01-04 Maintains Scotiabank Capital Outperform CAD 20 2021-12-23 Target Up CIBC Capital Markets Outperform CAD 19 2021-12-16 Target Up Canaccord Capital Speculative Buy CAD 19 2021-12-16 Target Up Canaccord Capital Speculative Buy CAD 19 2021-12-15 Target Up Canaccord Capital Hold CAD 15 2021-11-16 Target Up National Bank of Canada Financial Outperform CAD 19 2021-11-12 Target Up CIBC Capital Markets Neutral CAD 16 2021-11-12 Target Up TD Research Buy CAD 19.5 2021-11-12 Target Up BMO Financial Hold CAD 15 2021-11-12 Reiterated by BMO Financial Hold 2021-09-14 Target Up BMO Financial NA CAD 14 2021-09-13 Upgraded by CIBC Capital Markets Sector Perform » Outperform CAD 12 » CAD 20 2021-08-14 Target Up RBC Royalbank Sector Peform CAD 13 2021-08-13 Reiterates CIBC Capital Markets Neutral CAD 14 2021-08-13
- 7. Page 7 of 9 Any information in this report is not , and should not be regarded as investment advice or as a recommendation regarding any particular security or course of action. We recommend seeking a licensed professional for investment advice. CGX:CA:TSX (Cineplex Inc) Entertainment | | Common Stock Stock Target Advisor Detailed Stock Report Report Date: 17th May, 2022 Annual Financial (CAD)
- 8. Page 8 of 9 Any information in this report is not , and should not be regarded as investment advice or as a recommendation regarding any particular security or course of action. We recommend seeking a licensed professional for investment advice. CGX:CA:TSX (Cineplex Inc) Entertainment | | Common Stock Stock Target Advisor Detailed Stock Report Report Date: 17th May, 2022 Quarterly Financial (CAD)
- 9. Page 9 of 9 Any information in this report is not , and should not be regarded as investment advice or as a recommendation regarding any particular security or course of action. We recommend seeking a licensed professional for investment advice. CGX:CA:TSX (Cineplex Inc) Entertainment | | Common Stock Stock Target Advisor Detailed Stock Report Report Date: 17th May, 2022 Largest Industry Peers for Entertainment Symbol Company Name Price(Change) Market Cap CJR-B:CA Corus Entertainment Inc +0.10 (+2.5%) CAD 0.84B WILD:CA WildBrain Ltd -0.05 (-1.8%) CAD 0.47B BRMI:CA Boat Rocker Media Inc +0.27 (+9.0%) CAD 0.18B The Stock Target Advisor platform run millions of calculations every day on over 30,000 Canadian and American stocks, comparing and ranking their financial and market performance against their sectors and exchange. We represent the percentile ranking using the following grading system. Letter Grade Percentage Letter Grade Percentage Letter Grade Percentage A+ 97%-100% A 93%-96% A- 90%-92% B+ 97%-89% B 83%-86% B- 80%-82% C+ 77%-79% C 73%-76% C- 70%-72% D+ 67%-69% D 63%-66% D- 60%-62% F 0%-59%