sharechart Technical Newsletter vol-1 issue-7
•
0 likes•488 views

ShareChart is formed to stock analysis, to assist people, to trade stocks. It provides powerful technical analysis tools and fundamental news for both traders and investors.
Recommended

Recommended
More Related Content
Viewers also liked
Similar to sharechart Technical Newsletter vol-1 issue-7
Similar to sharechart Technical Newsletter vol-1 issue-7 (20)
Recently uploaded
Recently uploaded (20)
sharechart Technical Newsletter vol-1 issue-7
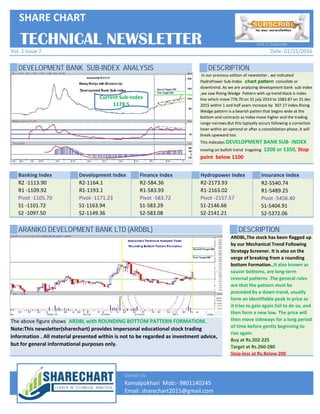
- 1. DEVELOPMENT BANK SUB-INDEX ANALYSIS DESCRIPTION Banking Index Development Index Finance Index Hydropower Index Insurance Index SHARE CHART Vol. 1 Issue 7 R2 -1113.90 R1 -1109.92 Pivot -1105.70 S1 -1101.72 S2 -1097.50 R2-1164.1 R1-1193.1 Pivot- 1171.23 S1-1163.94 S2-1149.36 R2-584.36 R1-583.93 Pivot -583.72 S1-583.29 S2-583.08 In our previous edition of newsletter , we indicated HydroPower Sub-Index chart pattern consolide or downtrend .As we are analyzing development bank sub-index ,we saw Rising Wedge Pattern with up trend black is index line which move 776.70 on 31 july 2014 to 1083.87 on 31 dec 2015 within 1 and half years increase by 307.17 index.Rising Wedge pattern is a bearish patten that begins wide at the bottom and contracts as index move higher and the trading range narrows.But this typiyally occurs following a correction lover within an uptrend or after a consolidation phase ,it will break upwward too. This indicates DEVELOPMENT BANK SUB- INDEX moving on bullish trend trageting 1200 or 1350, Stop point below 1100 TECHNICAL NEWSLETTER R2-2173.93 R1-2163.02 Pivot -2157.57 S1-2146.66 S2-2141.21 R2-5540.74 R1-5489.25 Pivot -5456.40 S1-5404.91 S2-5372.06 Date: 01/21/2016 Click To Subscribe Current Sub-Index 1178.5 ARANIKO DEVELOPMENT BANK LTD (ARDBL) DESCRIPTION Contact Us: Email: sharechart2015@gmail.com R2 -1113.90 R1 -1109.92 Pivot -1105.70 S1 -1101.72 S2 -1097.50 R2-1164.1 R1-1193.1 Pivot- 1171.23 S1-1163.94 S2-1149.36 R2-584.36 R1-583.93 Pivot -583.72 S1-583.29 S2-583.08 Kamalpokhari Mob:- 9801140245 The above figure shows ARDBL with ROUNDING BOTTOM PATTERN FORMATIOM. Note:This newsletter(sharechart) provides impersonal educational stock trading information . All material presented within is not to be regarded as investment advice, but for general informational purposes only. R2-2173.93 R1-2163.02 Pivot -2157.57 S1-2146.66 S2-2141.21 R2-5540.74 R1-5489.25 Pivot -5456.40 S1-5404.91 S2-5372.06 ARDBL,The stock has been flagged up by our Mechanical Trend Following Strategy Screener. It is also on the verge of breaking from a rounding bottom Formation.,It also known as saucer bottoms, are long-term reversal patterns .The general rules are that the pattern must be preceded by a down-trend, usually form an identifiable peak in price as it tries to gain again.fail to do so, and then form a new low. The price will then move sideways for a long period of time before gently beginning to rise again. Buy at Rs.202-225 Target at Rs.260-280 Stop-loss at Rs.Below 200 Email: sharechart2015@gmail.com Kamalpokhari Mob:- 9801140245