sharechart Technical Newsletter vol-1 issue-8
•
1 like•581 views

ShareChart is formed to stock analysis, to assist people, to trade stocks. It provides powerful technical analysis tools and fundamental news for both traders and investors.
Recommended

Recommended
More Related Content
Viewers also liked
Similar to sharechart Technical Newsletter vol-1 issue-8
Similar to sharechart Technical Newsletter vol-1 issue-8 (20)
Recently uploaded
Recently uploaded (20)
sharechart Technical Newsletter vol-1 issue-8
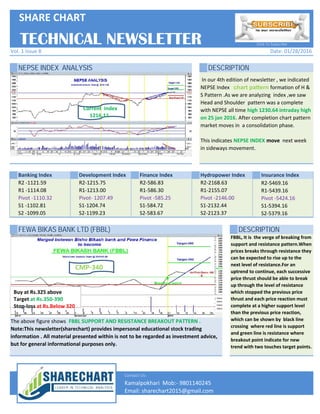
- 1. NEPSE INDEX ANALYSIS DESCRIPTION Banking Index Development Index Finance Index Hydropower Index Insurance Index In our 4th edition of newsletter , we indicated NEPSE Index chart pattern formation of H & S Pattern .As we are analyzing index ,we saw Head and Shoulder pattern was a complete with NEPSE all time high 1230.64 intraday high on 25 jan 2016. After completion chart pattern market moves in a consolidation phase. This indicates NEPSE INDEX move next week in sideways movement. TECHNICAL NEWSLETTER R2-2168.63 R1-2155.07 Pivot -2146.00 S1-2132.44 S2-2123.37 R2-5469.16 R1-5439.16 Pivot -5424.16 S1-5394.16 S2-5379.16 Date: 01/28/2016 Click To Subscribe SHARE CHART Vol. 1 Issue 8 R2 -1121.59 R1 -1114.08 Pivot -1110.32 S1 -1102.81 S2 -1099.05 R2-1215.75 R1-1213.00 Pivot- 1207.49 S1-1204.74 S2-1199.23 R2-586.83 R1-586.30 Pivot -585.25 S1-584.72 S2-583.67 Current Sub-Index 1178.5 Current Index 1216.11 FEWA BIKAS BANK LTD (FBBL) DESCRIPTION Contact Us: Email: sharechart2015@gmail.com Kamalpokhari Mob:- 9801140245 The above figure shows FBBL SUPPORT AND RESISTANCE BREAKOUT PATTERN . Note:This newsletter(sharechart) provides impersonal educational stock trading information . All material presented within is not to be regarded as investment advice, but for general informational purposes only. R2-2168.63 R1-2155.07 Pivot -2146.00 S1-2132.44 S2-2123.37 R2-5469.16 R1-5439.16 Pivot -5424.16 S1-5394.16 S2-5379.16 FBBL, It is the verge of breaking from support and resistance pattern.When prices breaks through resistance they can be expected to rise up to the next level of resistance.For an uptrend to continue, each successive price thrust should be able to break up through the level of resistance which stopped the previous price thrust and each price reaction must complete at a higher support level than the previous price reaction, which can be shown by black line crossing where red line is support and green line is resistance where breakout point indicate for new trend with two touches target points. R2 -1121.59 R1 -1114.08 Pivot -1110.32 S1 -1102.81 S2 -1099.05 R2-1215.75 R1-1213.00 Pivot- 1207.49 S1-1204.74 S2-1199.23 R2-586.83 R1-586.30 Pivot -585.25 S1-584.72 S2-583.67 Buy at Rs.325 above Target at Rs.350-390 Stop-loss at Rs.Below 320 CMP-340 Email: sharechart2015@gmail.com Kamalpokhari Mob:- 9801140245