sharechart Technical Newsletter vol-1 issue-4
•
0 likes•389 views

ShareChart is formed to stock analysis, to assist people, to trade stocks. It provides powerful technical analysis news and tools for both traders and investors.
Recommended

Recommended
More Related Content
What's hot
What's hot (12)
Recently uploaded
Recently uploaded (20)
sharechart Technical Newsletter vol-1 issue-4
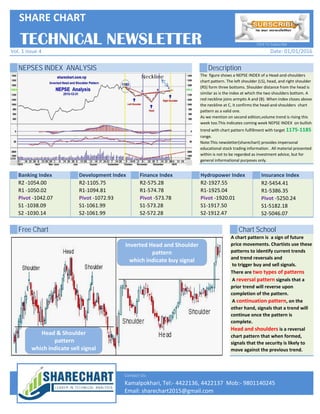
- 1. NEPSES INDEX ANALYSIS Description Banking Index Development Index Finance Index Hydropower Index Insurance Index The figure shows a NEPSE INDEX of a Head-and-shoulders chart pattern. The left shoulder (LS), head, and right shoulder (RS) form three bottoms. Shoulder distance from the head is similar as is the index at which the two shoulders bottom. A red neckline joins armpits A and (B). When index closes above the neckline at C, it confirms the head-and-shoulders chart pattern as a valid one. As we mention on second edition,volume trend is rising this week too.This indicates coming week NEPSE INDEX on bullish trend with chart pattern fulfillment with target 1175-1185 range. Note:This newsletter(sharechart) provides impersonal educational stock trading information . All material presented within is not to be regarded as investment advice, but for general informational purposes only. TECHNICAL NEWSLETTER R2-1927.55 R1-1925.04 Pivot -1920.01 S1-1917.50 S2-1912.47 R2-5454.41 R1-5386.35 Pivot -5250.24 S1-5182.18 S2-5046.07 Date: 01/01/2016 Click To Subscribe SHARE CHART Vol. 1 Issue 4 R2 -1054.00 R1 -1050.02 Pivot -1042.07 S1 -1038.09 S2 -1030.14 R2-1105.75 R1-1094.81 Pivot -1072.93 S1-1061.99 S2-1061.99 R2-575.28 R1-574.78 Pivot -573.78 S1-573.28 S2-572.28 Free Chart Chart School Contact Us: Email: sharechart2015@gmail.com Kamalpokhari, Tel:- 4422136, 4422137 Mob:- 9801140245 R2-1927.55 R1-1925.04 Pivot -1920.01 S1-1917.50 S2-1912.47 R2-5454.41 R1-5386.35 Pivot -5250.24 S1-5182.18 S2-5046.07 A chart pattern is a sign of future price movements. Chartists use these patterns to identify current trends and trend reversals and to trigger buy and sell signals. There are two types of patterns A reversal pattern signals that a prior trend will reverse upon completion of the pattern. A continuation pattern, on the other hand, signals that a trend will continue once the pattern is complete. Head and shoulders is a reversal chart pattern that when formed, signals that the security is likely to move against the previous trend. R2 -1054.00 R1 -1050.02 Pivot -1042.07 S1 -1038.09 S2 -1030.14 R2-1105.75 R1-1094.81 Pivot -1072.93 S1-1061.99 S2-1061.99 R2-575.28 R1-574.78 Pivot -573.78 S1-573.28 S2-572.28 Head & Shoulder pattern which indicate sell signal Inverted Head and Shoulder pattern which indicate buy signal Email: sharechart2015@gmail.com Kamalpokhari, Tel:- 4422136, 4422137 Mob:- 9801140245