sharechart Technical Newsletter vol-1 issue-10
•
0 likes•709 views

ShareChart is formed to stock analysis, to assist people, to trade stocks. It provides powerful technical analysis tools and fundamental news for both traders and investors.
Recommended

Recommended
More Related Content
Viewers also liked
Viewers also liked (8)
Similar to sharechart Technical Newsletter vol-1 issue-10
Similar to sharechart Technical Newsletter vol-1 issue-10 (20)
Recently uploaded
Recently uploaded (20)
sharechart Technical Newsletter vol-1 issue-10
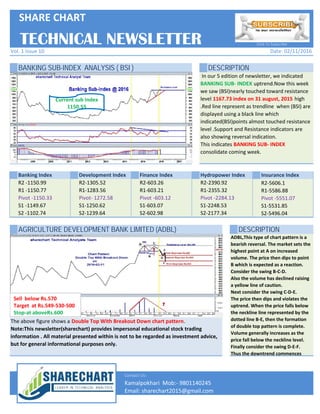
- 1. BANKING SUB-INDEX ANALYSIS ( BSI ) DESCRIPTION Banking Index Development Index Finance Index Hydropower Index Insurance Index SHARE CHART Vol. 1 Issue 10 R2 -1150.99 R1 -1150.77 Pivot -1150.33 S1 -1149.67 S2 -1102.74 R2-1305.52 R1-1283.56 Pivot- 1272.58 S1-1250.62 S2-1239.64 R2-603.26 R1-603.21 Pivot -603.12 S1-603.07 S2-602.98 In our 5 edition of newsletter, we indicated BANKING SUB- INDEX uptrend.Now this week we saw (BSI)nearly touched toward resistance level 1167.73 index on 31 august, 2015 high .Red line represent as trendline when (BSI) are displayed using a black line which indicated(BSI)points almost touched resistance level .Support and Resistance indicators are also showing reversal indication. This indicates BANKING SUB- INDEX consolidate coming week. TECHNICAL NEWSLETTER R2-2390.92 R1-2355.32 Pivot -2284.13 S1-2248.53 S2-2177.34 R2-5606.1 R1-5586.88 Pivot -5551.07 S1-5531.85 S2-5496.04 Date: 02/11/2016 Click To Subscribe Current sub Index 1150.55 AGRICULTURE DEVELOPMENT BANK LIMITED (ADBL) DESCRIPTION Contact Us: Email: sharechart2015@gmail.com R2 -1150.99 R1 -1150.77 Pivot -1150.33 S1 -1149.67 S2 -1102.74 R2-1305.52 R1-1283.56 Pivot- 1272.58 S1-1250.62 S2-1239.64 R2-603.26 R1-603.21 Pivot -603.12 S1-603.07 S2-602.98 Kamalpokhari Mob:- 9801140245 The above figure shows a Double Top With Breakout Down chart pattern. Note:This newsletter(sharechart) provides impersonal educational stock trading information . All material presented within is not to be regarded as investment advice, but for general informational purposes only. R2-2390.92 R1-2355.32 Pivot -2284.13 S1-2248.53 S2-2177.34 R2-5606.1 R1-5586.88 Pivot -5551.07 S1-5531.85 S2-5496.04 ADBL,This type of chart pattern is a bearish reversal. The market sets the highest point at A on increased volume. The price then dips to point B which is expected as a reaction. Consider the swing B-C-D. Also the volume has declined raising a yellow line of caution. Next consider the swing C-D-E. The price then dips and violates the uptrend. When the price falls below the neckline line represented by the dotted line B-E, then the formation of double top pattern is complete. Volume generally increases as the price fall below the neckline level. Finally consider the swing D-E-F. Thus the downtrend commences Sell below Rs.570 Target at Rs.549-530-500 Stop-at aboveRs.600 Email: sharechart2015@gmail.com Kamalpokhari Mob:- 9801140245