sharechart Technical Newsletter vol-1 issue-12
•
0 likes•778 views

ShareChart is formed to stock analysis, to assist people, to trade stocks. It provides powerful technical analysis tools and fundamental news for both traders and investors.

Recommended
More Related Content
Viewers also liked
Viewers also liked (20)
Similar to sharechart Technical Newsletter vol-1 issue-12
Similar to sharechart Technical Newsletter vol-1 issue-12 (20)
Recently uploaded
Recently uploaded (20)
sharechart Technical Newsletter vol-1 issue-12
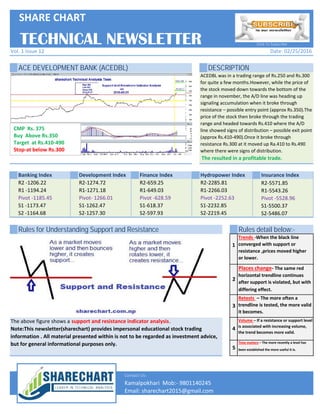
- 1. ACE DEVELOPMENT BANK (ACEDBL) DESCRIPTION Banking Index Development Index Finance Index Hydropower Index Insurance Index SHARE CHART Vol. 1 Issue 12 R2 -1206.22 R1 -1194.24 Pivot -1185.45 S1 -1173.47 S2 -1164.68 R2-1274.72 R1-1271.18 Pivot- 1266.01 S1-1262.47 S2-1257.30 R2-659.25 R1-649.03 Pivot -628.59 S1-618.37 S2-597.93 ACEDBL was in a trading range of Rs.250 and Rs.300 for quite a few months.However, while the price of the stock moved down towards the bottom of the range in november, the A/D line was heading up signaling accumulation when it broke through resistance – possible entry point (approx Rs.350).The price of the stock then broke through the trading range and headed towards Rs.410 where the A/D line showed signs of distribution – possible exit point (approx Rs.410-490).Once it broke through resistance Rs.300 at it moved up Ra.410 to Rs.490 where there were signs of distribution. The resulted in a profitable trade. TECHNICAL NEWSLETTER R2-2285.81 R1-2266.03 Pivot -2252.63 S1-2232.85 S2-2219.45 R2-5571.85 R1-5543.26 Pivot -5528.96 S1-5500.37 S2-5486.07 Date: 02/25/2016 Click To Subscribe CMP Rs. 375 Buy Above Rs.350 Target at Rs.410-490 Stop-at below Rs.300 Rules for Understanding Support and Resistance Rules detail below:- Contact Us: Email: sharechart2015@gmail.com R2 -1206.22 R1 -1194.24 Pivot -1185.45 S1 -1173.47 S2 -1164.68 R2-1274.72 R1-1271.18 Pivot- 1266.01 S1-1262.47 S2-1257.30 R2-659.25 R1-649.03 Pivot -628.59 S1-618.37 S2-597.93 The above figure shows a support and resistance indicator analysis. Note:This newsletter(sharechart) provides impersonal educational stock trading information . All material presented within is not to be regarded as investment advice, but for general informational purposes only. R2-2285.81 R1-2266.03 Pivot -2252.63 S1-2232.85 S2-2219.45 R2-5571.85 R1-5543.26 Pivot -5528.96 S1-5500.37 S2-5486.07 Trends -When the black line converged with support or resistance ,prices moved higher or lower. Places change- The same red horizontal trendline continues after support is violated, but with differing effect. Retests – The more often a trendline is tested, the more valid it becomes. Volume – If a resistance or support level is associated with increasing volume, the trend becomes more valid. 1 Kamalpokhari Mob:- 9801140245 2 3 4 5 Time matters – The more recently a level has been established the more useful it is. Email: sharechart2015@gmail.com Kamalpokhari Mob:- 9801140245