sharechart Technical Newsletter vol-1 issue-9
•
0 likes•608 views

ShareChart is formed to stock analysis, to assist people, to trade stocks. It provides powerful technical analysis tools and fundamental news for both traders and investors.
Recommended

Recommended
More Related Content
Viewers also liked
Viewers also liked (8)
Recently uploaded
Recently uploaded (20)
sharechart Technical Newsletter vol-1 issue-9
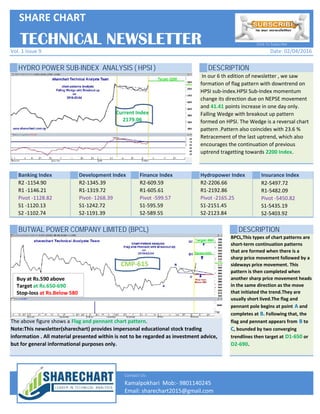
- 1. HYDRO POWER SUB-INDEX ANALYSIS ( HPSI ) DESCRIPTION Banking Index Development Index Finance Index Hydropower Index Insurance Index In our 6 th edition of newsletter , we saw formation of flag pattern with downtrend on HPSI sub-index.HPSI Sub-Index momentum change its direction due on NEPSE movement and 41.41 points increase in one day only. Falling Wedge with breakout up pattern formed on HPSI. The Wedge is a reversal chart pattern .Pattern also coincides with 23.6 % Retracement of the last uptrend, which also encourages the continuation of previous uptrend tragetting towards 2200 Index. TECHNICAL NEWSLETTER R2-2206.66 R1-2192.86 Pivot -2165.25 S1-2151.45 S2-2123.84 R2-5497.72 R1-5482.09 Pivot -5450.82 S1-5435.19 S2-5403.92 Date: 02/04/2016 Click To Subscribe SHARE CHART Vol. 1 Issue 9 R2 -1154.90 R1 -1146.21 Pivot -1128.82 S1 -1120.13 S2 -1102.74 R2-1345.39 R1-1319.72 Pivot- 1268.39 S1-1242.72 S2-1191.39 R2-609.59 R1-605.61 Pivot -599.57 S1-595.59 S2-589.55 Current Sub-Index 1178.5Current Index 2179.06 BUTWAL POWER COMPANY LIMITED (BPCL) DESCRIPTION Contact Us: Email: sharechart2015@gmail.com Kamalpokhari Mob:- 9801140245 The above figure shows a Flag and pennant chart pattern. Note:This newsletter(sharechart) provides impersonal educational stock trading information . All material presented within is not to be regarded as investment advice, but for general informational purposes only. R2-2206.66 R1-2192.86 Pivot -2165.25 S1-2151.45 S2-2123.84 R2-5497.72 R1-5482.09 Pivot -5450.82 S1-5435.19 S2-5403.92 BPCL,This types of chart patterns are short-term continuation patterns that are formed when there is a sharp price movement followed by a sideways price movement. This pattern is then completed when another sharp price movement heads in the same direction as the move that initiated the trend.They are usually short lived.The flag and pennant pole begins at point A and completes at B. Following that, the flag and pennant appears from B to C, bounded by two converging trendlines then target at D1-650 or D2-690. R2 -1154.90 R1 -1146.21 Pivot -1128.82 S1 -1120.13 S2 -1102.74 R2-1345.39 R1-1319.72 Pivot- 1268.39 S1-1242.72 S2-1191.39 R2-609.59 R1-605.61 Pivot -599.57 S1-595.59 S2-589.55 Buy at Rs.590 above Target at Rs.650-690 Stop-loss at Rs.Below 580 CMP-615 Email: sharechart2015@gmail.com Kamalpokhari Mob:- 9801140245