sharechart Technical Newsletter vol-1 issue-5
•
1 like•653 views

ShareChart is formed to stock analysis, to assist people, to trade stocks. It provides powerful technical analysis news and tools for both traders and investors.
Recommended

Recommended
More Related Content
What's hot
What's hot (12)
Viewers also liked
Similar to sharechart Technical Newsletter vol-1 issue-5
Similar to sharechart Technical Newsletter vol-1 issue-5 (20)
Recently uploaded
Recently uploaded (20)
sharechart Technical Newsletter vol-1 issue-5
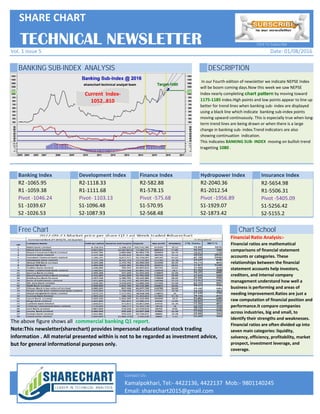
- 1. BANKING SUB-INDEX ANALYSIS DESCRIPTION Banking Index Development Index Finance Index Hydropower Index Insurance Index SHARE CHART Vol. 1 Issue 5 R2 -1065.95 R1 -1059.38 Pivot -1046.24 S1 -1039.67 S2 -1026.53 R2-1118.33 R1-1111.68 Pivot- 1103.13 S1-1096.48 S2-1087.93 R2-582.88 R1-578.15 Pivot -575.68 S1-570.95 S2-568.48 In our Fourth edition of newsletter we indicate NEPSE Index will be boom coming days.Now this week we saw NEPSE Index nearly completing chart pattern by moving toward 1175-1185 index.High points and low points appear to line up better for trend lines when banking sub- index are displayed using a black line which indicate banking sub-index points moving upward continuously. This is especially true when long- term trend lines are being drawn or when there is a large change in banking sub- index.Trend indicators are also showing continuation indication. This indicates BANKING SUB- INDEX moving on bullish trend tragetting 1080 . TECHNICAL NEWSLETTER R2-2040.36 R1-2012.54 Pivot -1956.89 S1-1929.07 S2-1873.42 R2-5654.98 R1-5506.31 Pivot -5405.09 S1-5256.42 S2-5155.2 Date: 01/08/2016 Click To Subscribe Current Index- 1052..810 Free Chart Chart School Contact Us: Email: sharechart2015@gmail.com R2 -1065.95 R1 -1059.38 Pivot -1046.24 S1 -1039.67 S2 -1026.53 R2-1118.33 R1-1111.68 Pivot- 1103.13 S1-1096.48 S2-1087.93 R2-582.88 R1-578.15 Pivot -575.68 S1-570.95 S2-568.48 Kamalpokhari, Tel:- 4422136, 4422137 Mob:- 9801140245 The above figure shows all commercial banking Q1 report. Note:This newsletter(sharechart) provides impersonal educational stock trading information . All material presented within is not to be regarded as investment advice, but for general informational purposes only. R2-2040.36 R1-2012.54 Pivot -1956.89 S1-1929.07 S2-1873.42 R2-5654.98 R1-5506.31 Pivot -5405.09 S1-5256.42 S2-5155.2 Financial Ratio Analysis:- Financial ratios are mathematical comparisons of financial statement accounts or categories. These relationships between the financial statement accounts help investors, creditors, and internal company management understand how well a business is performing and areas of needing improvement.Ratios are just a raw computation of financial position and performance.It compare companies across industries, big and small, to identify their strengths and weaknesses. Financial ratios are often divided up into seven main categories: liquidity, solvency, efficiency, profitability, market prospect, investment leverage, and coverage. Email: sharechart2015@gmail.com Kamalpokhari, Tel:- 4422136, 4422137 Mob:- 9801140245