sharechart Technical Newsletter vol-1 issue-13
•
0 likes•1,005 views

The document analyzes the NEPSE index and indicates it will likely move in a bullish trend next week based on a completed head and shoulders pattern. It provides resistance and support levels for several indexes. It also discusses a volatility indicator analysis showing prices are relatively high above the upper Bollinger band and low below the lower band. The MACD indicator is above the central line, also indicating a bullish sign. Current market price and buy/target levels are given for SANIMA BANK LIMITED.

Recommended
More Related Content
Viewers also liked
Viewers also liked (14)
Similar to sharechart Technical Newsletter vol-1 issue-13
Similar to sharechart Technical Newsletter vol-1 issue-13 (20)
Recently uploaded
Recently uploaded (20)
sharechart Technical Newsletter vol-1 issue-13
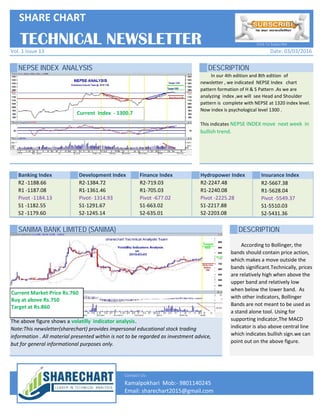
- 1. NEPSE INDEX ANALYSIS DESCRIPTION Banking Index Development Index Finance Index Hydropower Index Insurance Index In our 4th edition and 8th edition of newsletter , we indicated NEPSE Index chart pattern formation of H & S Pattern .As we are analyzing index ,we will see Head and Shoulder pattern is complete with NEPSE at 1320 index level. Now index is psychological level 1300 . This indicates NEPSE INDEX move next week in bullish trend. TECHNICAL NEWSLETTER R2-2247.48 R1-2240.08 Pivot -2225.28 S1-2217.88 S2-2203.08 R2-5667.38 R1-5628.04 Pivot -5549.37 S1-5510.03 S2-5431.36 Date: 03/03/2016 Click To Subscribe SHARE CHART Vol. 1 Issue 13 R2 -1188.66 R1 -1187.08 Pivot -1184.13 S1 -1182.55 S2 -1179.60 R2-1384.72 R1-1361.46 Pivot- 1314.93 S1-1291.67 S2-1245.14 R2-719.03 R1-705.03 Pivot -677.02 S1-663.02 S2-635.01 Current Index - 1300.7 SANIMA BANK LIMITED (SANIMA) DESCRIPTION Contact Us: Email: sharechart2015@gmail.com Kamalpokhari Mob:- 9801140245 According to Bollinger, the bands should contain price action, which makes a move outside the bands significant.Technically, prices are relatively high when above the upper band and relatively low when below the lower band. As with other indicators, Bollinger Bands are not meant to be used as a stand alone tool. Using for supporting indicator,The MACD indicator is also above central line which indicates bullish sign.we can point out on the above figure. The above figure shows a volatilly indicator analysis. Note:This newsletter(sharechart) provides impersonal educational stock trading information . All material presented within is not to be regarded as investment advice, but for general informational purposes only. R2-2247.48 R1-2240.08 Pivot -2225.28 S1-2217.88 S2-2203.08 R2-5667.38 R1-5628.04 Pivot -5549.37 S1-5510.03 S2-5431.36 R2 -1188.66 R1 -1187.08 Pivot -1184.13 S1 -1182.55 S2 -1179.60 R2-1384.72 R1-1361.46 Pivot- 1314.93 S1-1291.67 S2-1245.14 R2-719.03 R1-705.03 Pivot -677.02 S1-663.02 S2-635.01 Current Market Price Rs.760 Buy at above Rs.750 Target at Rs.860 Email: sharechart2015@gmail.com Kamalpokhari Mob:- 9801140245