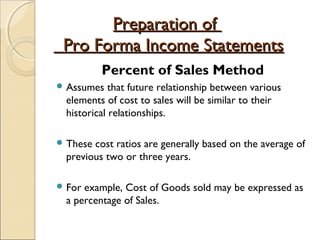
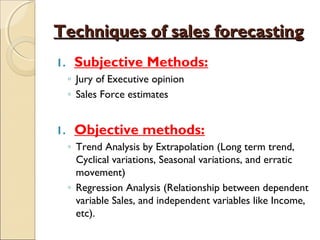
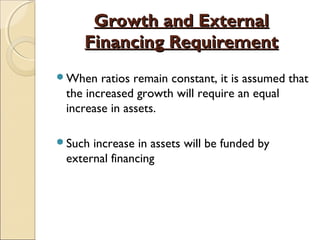
FINANCIALFINANCIAL
FORECASTINGFORECASTING
PRESENTED BY:
POOJA GUPTA
AASHNA HARYANI
NITIN SINGH
ABHIMANYU GHAI
What is Financial Forecasting?What is Financial Forecasting?
 It is a Part of Planning process.
 They are inferences as to what the future may be.
 Extends over a time horizon.
 Based on:
i. Economic assumptions (interest rate, inflation rate,
growth rate and so on).
ii. Sales forecast.
iii. Pro forma statements of Income account and Balance
sheet.
iv. Asset requirements.
v. Financing plan.
vi. Cash Budget
The NeedThe Need
 Financial Manager prepares Pro forma or projected
financial statements to:
a. Assess the firm’s forecasted performance is in line
with Targets and expectations of investors.
b. Examine the effect of proposed operating changes.
c. Anticipate the financing needs of the firm.
d. Estimate the future free cash flows.
Techniques of FinancialTechniques of Financial
projectionsprojections
1. Proforma Financial Statements.
2. Cash Budgets.
3. Operating Budgets.
4. Sales Budget
Proforma Financial StatementsProforma Financial Statements
A comprehensive look at the likely future
financial performance.
Pro forma Income Statement. (Represents the
operational plan for the whole organization.)
Pro forma Balance sheet. (Reflects the
cumulative impact of anticipated future
decisions).
Preparation ofPreparation of
Pro Forma Income StatementsPro Forma Income Statements
Percent of Sales Method
 Assumes that future relationship between various
elements of cost to sales will be similar to their
historical relationships.
 These cost ratios are generally based on the average of
previous two or three years.
 For example, Cost of Goods sold may be expressed as
a percentage of Sales.
2. Budgeted Expense Method.2. Budgeted Expense Method.
 Estimate the value of each item on the basis of
expected developments in the future period for which
the pro forma P&L a/c is being prepared.
 Calls for greater effort on the part of Management,
since they have to define the likely happenings.
3. Combination method3. Combination method
 Neither the Percent of sales method nor the Budgeted
expense method should be used in isolation.
 A combination of both methods work best.
 Items which have stable relationship to sales can be
forecasted using the Percent of sales method.
 For items where the future is likely to be very different
from the past, budgeted expense method can be used.
Proforma Income StatementProforma Income Statement
Actual figures
for Quarter 31-
3-2006
Assumptions Proforma for
the qr ended
30-6-2006
1.No.of units sold
2.Net Sales
3.Cost of Goods
sold:
4.Labour
5. Materials
6.Distribution cost
7. Overhead
8. Total
9. Ratio of CGS to
Sales.
10. Gross Profit
11. GP Margin
14000
140000
100%
22960
25256
4592
61992
114800
82.0%
25200
18%
Sales decline 30%
due to low demand.
No change in Product
mix.
20% of Cost of good
22% of COG
4% of COG
54% of COG
Increase by 1.5%
9800
98000
100%
16366
18002.6
3273.2
44188.2
81830
83.5%
16170
16.5%
Contd.Contd.
Actuals Assumption Proforma
12. Expenses:
13. Selling Expenses
14. Admin. Expense
15. Others
16.Total
17. Operating Profit
18. Interest
19. Depreciation
20.PBT
21. Tax @ 30%
22.Net Income
23.Dividends
24.Retained
earnings.
25. Cash flow after
dividends.
8250
4450
Nil
12700
12500
2500
2000
7000
2100
4900
900
4000
6000
A drop of Rs.
750 .
A drop of Rs. 850
Rs.2000 only
No dividends
Carried to B/s.
Retained earning +
Depreciation
7500
3600
Nil
11100
5070
2000
2000
1070
321
749
0
749
2749
Pro forma Balance sheetPro forma Balance sheet
 Projections for Balance sheet can be made asunder:
1. Employ Percent of Sales method to project items on
the asset side, except “Investments” and “Misc Exp &
Losses”.
2. Expected values for Investment and Misc exp can be
estimated using specific information.
3. Use Percent of sales method to project values of
current liabilities and Provisions. (Also referred to as
‘spontaneous liabilities’)
4. Projected values of R & S can be obtained by adding
projected retained earnings from P&L proforma
statement.
B/S Contd..B/S Contd..
5. Projected value for Equity and preferential capital can
be set tentatively equal to their previous values.
6. Projected values for loan funds will be tentatively
equal to their previous level less repayments or
retirements.
7. Compare the total of asset side with that of liabilities
side and determine the balancing figure. (If assets
exceed liabilities, the balancing figure represents
external funding requirement. If liabilities exceeds
Assets, the balancing item represents ‘surplus
available funds’ )
PROFORMA BALANCE SHEETPROFORMA BALANCE SHEET..
Actual Assumptions Proforma
for
June
Change
LIABILITIES:
A.CAPITAL
B.R& S.(C+D)
C.RESERVES
D.P&L Balance
E.Total share
holders funds.
F.Total Debt
G.Total Liabilities
(E+F)
6500
4500
500
4000
11000
7500
18500
Issue of shares
Rs.500
P&L account.
7000
5250
500
4750
12250
7500
19750
+500
+750
0
+750
+1250
0
+1250
Proforma Balance sheet contd..Proforma Balance sheet contd..
Actuals Assumptions Proforma Change
ASSETS;
H. GROSS BLOCK (I+j)
I.LAND
j. Plant & Machinery
K. LESS DEPRECN.
L. NET BLOCK (J-K)
M. CURRENT ASSETS
(N+O)
N. INVENTORIES
O.CASH.
Less:
P. CURRENT LIAILITIES.
Q. Provisions
R. Net current assets
(M-P-Q)
s.Total assets (L+R)
t.Additional funds
required.
24000
3000
21000
10000
11000
14500
10500
4000
5000
2000
7500
18500
No change
Sale of 1000
Depreciation of 9500
Increase by 2000
Maintain CB of 3500
Decrease by 1000
23000
3000
20000
9500
10500
16000
12500
3500
4000
2000
10000
20500
-1000
0
-1000
-500
-500
+1500
+2000
-500
-1000
0
+2500
+2000
Other Proforma statementsOther Proforma statements
Cash Budget
Operating Budget
Sales Budget
Production Budget
Sales and Distribution expenses budget
Administrative overheads budget.
Sales forecastingSales forecasting
 Long duration sales forecasts- for Investment planning
 Sales forecast for one year-for preparation of pro
forma statements
 Sales forecasts for shorter durations (1 to 6 months) –
for cash budgeting and working capital planning.
Techniques of sales forecastingTechniques of sales forecasting
1. Subjective Methods:
◦ Jury of Executive opinion
◦ Sales Force estimates
1. Objective methods:
◦ Trend Analysis by Extrapolation (Long term trend,
Cyclical variations, Seasonal variations, and erratic
movement)
◦ Regression Analysis (Relationship between dependent
variable Sales, and independent variables like Income,
etc).
Growth and ExternalGrowth and External
Financing RequirementFinancing Requirement
When ratios remain constant, it is assumed that
the increased growth will require an equal
increase in assets.
Such increase in assets will be funded by
external financing
External funding Requirement (EFR) is calculated asExternal funding Requirement (EFR) is calculated as
followsfollows::
EFR= A/S (EFR= A/S (ΔΔS) –L/S (S) –L/S (ΔΔS) – m S1(1-d)S) – m S1(1-d)
Where, EFR= external funds requirementWhere, EFR= external funds requirement
A/S = Current Assets and Fixed Assets as proportionA/S = Current Assets and Fixed Assets as proportion
of Salesof Sales
L/S= CL and Provisions (spontaneous liabilities) as aL/S= CL and Provisions (spontaneous liabilities) as a
proportion of Sales.proportion of Sales.
ΔΔS= Expected increase in sales.S= Expected increase in sales.
M = Net profit MarginM = Net profit Margin
S1= Projected sales for next yearS1= Projected sales for next year
d = dividend payout ratiod = dividend payout ratio
THANK YOUTHANK YOU

Financial forecasting-planning

  • 1.
  • 2.
    What is FinancialForecasting?What is Financial Forecasting?  It is a Part of Planning process.  They are inferences as to what the future may be.  Extends over a time horizon.  Based on: i. Economic assumptions (interest rate, inflation rate, growth rate and so on). ii. Sales forecast. iii. Pro forma statements of Income account and Balance sheet. iv. Asset requirements. v. Financing plan. vi. Cash Budget
  • 3.
    The NeedThe Need Financial Manager prepares Pro forma or projected financial statements to: a. Assess the firm’s forecasted performance is in line with Targets and expectations of investors. b. Examine the effect of proposed operating changes. c. Anticipate the financing needs of the firm. d. Estimate the future free cash flows.
  • 4.
    Techniques of FinancialTechniquesof Financial projectionsprojections 1. Proforma Financial Statements. 2. Cash Budgets. 3. Operating Budgets. 4. Sales Budget
  • 5.
    Proforma Financial StatementsProformaFinancial Statements A comprehensive look at the likely future financial performance. Pro forma Income Statement. (Represents the operational plan for the whole organization.) Pro forma Balance sheet. (Reflects the cumulative impact of anticipated future decisions).
  • 6.
    Preparation ofPreparation of ProForma Income StatementsPro Forma Income Statements Percent of Sales Method  Assumes that future relationship between various elements of cost to sales will be similar to their historical relationships.  These cost ratios are generally based on the average of previous two or three years.  For example, Cost of Goods sold may be expressed as a percentage of Sales.
  • 7.
    2. Budgeted ExpenseMethod.2. Budgeted Expense Method.  Estimate the value of each item on the basis of expected developments in the future period for which the pro forma P&L a/c is being prepared.  Calls for greater effort on the part of Management, since they have to define the likely happenings.
  • 8.
    3. Combination method3.Combination method  Neither the Percent of sales method nor the Budgeted expense method should be used in isolation.  A combination of both methods work best.  Items which have stable relationship to sales can be forecasted using the Percent of sales method.  For items where the future is likely to be very different from the past, budgeted expense method can be used.
  • 9.
    Proforma Income StatementProformaIncome Statement Actual figures for Quarter 31- 3-2006 Assumptions Proforma for the qr ended 30-6-2006 1.No.of units sold 2.Net Sales 3.Cost of Goods sold: 4.Labour 5. Materials 6.Distribution cost 7. Overhead 8. Total 9. Ratio of CGS to Sales. 10. Gross Profit 11. GP Margin 14000 140000 100% 22960 25256 4592 61992 114800 82.0% 25200 18% Sales decline 30% due to low demand. No change in Product mix. 20% of Cost of good 22% of COG 4% of COG 54% of COG Increase by 1.5% 9800 98000 100% 16366 18002.6 3273.2 44188.2 81830 83.5% 16170 16.5%
  • 10.
    Contd.Contd. Actuals Assumption Proforma 12.Expenses: 13. Selling Expenses 14. Admin. Expense 15. Others 16.Total 17. Operating Profit 18. Interest 19. Depreciation 20.PBT 21. Tax @ 30% 22.Net Income 23.Dividends 24.Retained earnings. 25. Cash flow after dividends. 8250 4450 Nil 12700 12500 2500 2000 7000 2100 4900 900 4000 6000 A drop of Rs. 750 . A drop of Rs. 850 Rs.2000 only No dividends Carried to B/s. Retained earning + Depreciation 7500 3600 Nil 11100 5070 2000 2000 1070 321 749 0 749 2749
  • 11.
    Pro forma BalancesheetPro forma Balance sheet  Projections for Balance sheet can be made asunder: 1. Employ Percent of Sales method to project items on the asset side, except “Investments” and “Misc Exp & Losses”. 2. Expected values for Investment and Misc exp can be estimated using specific information. 3. Use Percent of sales method to project values of current liabilities and Provisions. (Also referred to as ‘spontaneous liabilities’) 4. Projected values of R & S can be obtained by adding projected retained earnings from P&L proforma statement.
  • 12.
    B/S Contd..B/S Contd.. 5.Projected value for Equity and preferential capital can be set tentatively equal to their previous values. 6. Projected values for loan funds will be tentatively equal to their previous level less repayments or retirements. 7. Compare the total of asset side with that of liabilities side and determine the balancing figure. (If assets exceed liabilities, the balancing figure represents external funding requirement. If liabilities exceeds Assets, the balancing item represents ‘surplus available funds’ )
  • 13.
    PROFORMA BALANCE SHEETPROFORMABALANCE SHEET.. Actual Assumptions Proforma for June Change LIABILITIES: A.CAPITAL B.R& S.(C+D) C.RESERVES D.P&L Balance E.Total share holders funds. F.Total Debt G.Total Liabilities (E+F) 6500 4500 500 4000 11000 7500 18500 Issue of shares Rs.500 P&L account. 7000 5250 500 4750 12250 7500 19750 +500 +750 0 +750 +1250 0 +1250
  • 14.
    Proforma Balance sheetcontd..Proforma Balance sheet contd.. Actuals Assumptions Proforma Change ASSETS; H. GROSS BLOCK (I+j) I.LAND j. Plant & Machinery K. LESS DEPRECN. L. NET BLOCK (J-K) M. CURRENT ASSETS (N+O) N. INVENTORIES O.CASH. Less: P. CURRENT LIAILITIES. Q. Provisions R. Net current assets (M-P-Q) s.Total assets (L+R) t.Additional funds required. 24000 3000 21000 10000 11000 14500 10500 4000 5000 2000 7500 18500 No change Sale of 1000 Depreciation of 9500 Increase by 2000 Maintain CB of 3500 Decrease by 1000 23000 3000 20000 9500 10500 16000 12500 3500 4000 2000 10000 20500 -1000 0 -1000 -500 -500 +1500 +2000 -500 -1000 0 +2500 +2000
  • 15.
    Other Proforma statementsOtherProforma statements Cash Budget Operating Budget Sales Budget Production Budget Sales and Distribution expenses budget Administrative overheads budget.
  • 16.
    Sales forecastingSales forecasting Long duration sales forecasts- for Investment planning  Sales forecast for one year-for preparation of pro forma statements  Sales forecasts for shorter durations (1 to 6 months) – for cash budgeting and working capital planning.
  • 17.
    Techniques of salesforecastingTechniques of sales forecasting 1. Subjective Methods: ◦ Jury of Executive opinion ◦ Sales Force estimates 1. Objective methods: ◦ Trend Analysis by Extrapolation (Long term trend, Cyclical variations, Seasonal variations, and erratic movement) ◦ Regression Analysis (Relationship between dependent variable Sales, and independent variables like Income, etc).
  • 18.
    Growth and ExternalGrowthand External Financing RequirementFinancing Requirement When ratios remain constant, it is assumed that the increased growth will require an equal increase in assets. Such increase in assets will be funded by external financing
  • 19.
    External funding Requirement(EFR) is calculated asExternal funding Requirement (EFR) is calculated as followsfollows:: EFR= A/S (EFR= A/S (ΔΔS) –L/S (S) –L/S (ΔΔS) – m S1(1-d)S) – m S1(1-d) Where, EFR= external funds requirementWhere, EFR= external funds requirement A/S = Current Assets and Fixed Assets as proportionA/S = Current Assets and Fixed Assets as proportion of Salesof Sales L/S= CL and Provisions (spontaneous liabilities) as aL/S= CL and Provisions (spontaneous liabilities) as a proportion of Sales.proportion of Sales. ΔΔS= Expected increase in sales.S= Expected increase in sales. M = Net profit MarginM = Net profit Margin S1= Projected sales for next yearS1= Projected sales for next year d = dividend payout ratiod = dividend payout ratio
  • 20.