Antuit Request

The objective of this exercise is to showcase your ability to mine data and present actionable insights to non-technical business stakeholders. This file includes 6 tabs, including the instructions tab. Traffic Tab: Includes web site traffic by day Market Tab: Includes Competitors traffic and social media mentions (for the automotive category) Sales Reports: shows sales, by day, by transaction and SKU SKU tab translates SKUs into friendly product names and provide $ values Media Spend Report including spend by channel and day Data is somewhat organized, but will require merging multiple sources together to maximize insights. Data may require some cleansing. The exercise: You have been tasked to providetop actionable insights to address one, or all, of the following business objectives. - Increase awareness - Increase revenue - Reduce/optimize media costs - Sales forecast and media spend for 2010. Please include what channels to continue or discontinue spending on. Also, explain the methodology and reccomended approach to forecasting and marketing mix modelling The audience: mid-senior level, non-technical stakeholders The output: 5-7 slide presentation in PPT, which includes assumptions, approach, analysis and insights. 30 min max.

Recommended
More Related Content
What's hot
What's hot (7)
Similar to Antuit Request
Similar to Antuit Request (20)
Recently uploaded
Recently uploaded (20)
Antuit Request
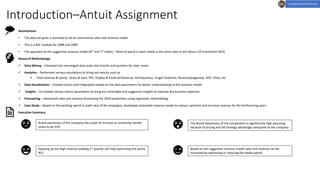
- 1. Assumptions • The data set given is assumed to be an ecommerce sales and revenue model • This is a B2C module for 2008 and 2009 • The approach to the suggestive revenue model (6th and 7th slides) – Ratio of spend in each media is the same ratio to the Return Of Investment (ROI) Research Methodology ✓ Data Mining – Cleansed and rearranged data scale into months and quarters for clear vision ✓ Analytics – Performed various calculations to bring out metrics such as ▪ Total revenue & spend, Gross & Gain, PPC, Display & Email Ad Revenue, Ad frequency, Target Audience, Revenue/pageview, SOV- Visits, etc ✓ Data Visualization – Created charts and infographics based on the data parameters for better understanding to the business model ✓ Insights – Co-related various metric parameters to bring out actionable and suggestive insights to improve the business objective ✓ Forecasting – Generated sales and revenue forecasting for 2010 predictions using regression methodology ✓ Case Study – Based on the exisiting spend to yield ratio of Ad campaigns, developed actionable revenue model to reduce, optimize and increase revenue for the forthcoming years Executive Summary Introduction–Antuit Assignment Brand awareness of the company has scope to increase as remaining market share to be 52% The Brand Awareness of the competitors is significantly high assuming because of pricing and Ad strategy advantage compared to the company Keeping up the High revenue yielding 1st quarter will help optimizing the yearly ROI Based on the suggestive revenue model sales and revenue can be increased by optimizing or reducing the media spend Created by Sathish Kumaar
- 2. Brand Awareness Target Audience On an average 48%of the total audience is being targeted Market Share Visits to competitor sites Visits 46%of the market is still available to increase exisiting target audience 0k 50k 100k 150k 200k 250k 0m 20m 40m 60m 80m 100m 120m 140m 160m 180m 200m 2008 Qtr1 2008 Qtr2 2008 Qtr3 2008 Qtr4 2009 Qtr1 2009 Qtr2 2009 Qtr3 2009 Qtr4 Frequency of Ad Visitors Visits Page Views Social Media Mentions Approach – Co-related ad frequency to cast impact on brand awareness among total audience • According to years 2008 and 2009’s 1st and 4th quarter • Both year had high audience scope and high exposure of ads. • The customer behavior suggests that the audience is actively looking to purchase. • This is an ideal scenario for high conversion rate to increase sales. • According to years 2008 and 2009’s 2nd and 3rd quarter • Both year had moderate audience scope with low ad frequency. Thus shows a trend • Right time to increase the media spend to target audience from the competitors market • Building an ad promotion would then increase conversation rate against its competitors audience Note: All metrics are measured in millions and ad frequency is measured in thousands Created by Sathish Kumaar
- 3. 0k 50k 100k 150k 200k 250k 0 200 400 600 800 1000 1200 2008 Qtr1 2008 Qtr2 2008 Qtr3 2008 Qtr4 2009 Qtr1 2009 Qtr2 2009 Qtr3 2009 Qtr4 Product Sales Quantity vs Ad Frequency Windshield Tires Tail Lights Shocks Radiators Mirrors Hoods Headlights Ad-Marketing vs Sales Approach – No. of product sold in each quarter is compared against the frequency of Ad-exposure. This gives a perspective on how the expense in advertising has impacted the sales Assumption – It is evident that the ad frequency is sinusoidal to the no of products sold in each quarter where ad campaigns are channelized seasonal to gain selective product based sales and revenue • On 2008 quarter 1 , quarter 4 and 2009 quarter 4 has high ad frequency and also reflects high sale figures (more than 1000 units) of windshield, tires and taillights thus relating ad-campaigns were targeted on those particular products and yielded a total profit of $2290k • It shows that ad expense can be reduced or optimised in the first and the fourth quarter but can be increased in other quarters to nominalise the budget and ROI for the whole year Suggestion – Similar Products sold extensively in competitors market should be targeted on Ad campaigns to grow target audience and sales numbers which directly increases yearly revenue Note: All product metrics are measured in SKU – (Stock Keeping Unit) and ad frequency is measured in thousands Created by Sathish Kumaar
- 4. Sales & Revenue Forecasting 2010 850 900 950 1000 1050 1100 2008 Qtr 1 2008 Qtr 2 2008 Qtr 3 2008 Qtr 4 2009 Qtr 1 2009 Qtr 2 2009 Qtr 3 2009 Qtr 4 2010 Qtr 1 2010 Qtr 2 2010 Qtr 3 2010 Qtr 4 Sales Forecasted $0k $200k $400k $600k $800k $1,000k $1,200k $1,400k $1,600k 2008 Qtr 1 2008 Qtr 2 2008 Qtr 3 2008 Qtr 4 2009 Qtr 1 2009 Qtr 2 2009 Qtr 3 2009 Qtr 4 2010 Qtr 1 2010 Qtr 2 2010 Qtr 3 2010 Qtr 4 Revenue Forecasted Approach – The sales forecasted is plotted against the years 2008 and 2009 units sold data in each quarters using a regression method • Above forecasted line shows a high sale number in 2010 quarter 1 following the seasonal wave of previous years • 2010 sales slows down to a gradual plot during quarter 2 to quarter 4 but did not drop low as 2009 figures • The linear regression method thus extrapolates it to a predicted sales of 3967 units for the forthcoming year ➢ Which is 35 and 101 units lesser than the previous years respectively Approach - The revenue forecasted is plotted against the years 2008 and 2009 revenue earned data in each quarters using a regression method • The revenue plot is directly proportional to the sale numbers • The linear regression method thus extrapolates it to a predicted revenue for the forthcoming year is $3100k ➢ Which is $500k more than the previous years respectively ➢ Thus explaining the number of higher value products such as windshield and tires are expected to be sold more than the other products offered Note: All product sales metrics are measured in SKU (Stock Keeping Unit) Created by Sathish Kumaar
- 5. 2008,2009 Media Revenue PPC Ad Campaign Display Ad Campaigns Email Campaign $0 $200 $400 $600 $800 $1,000 $1,200 $0 $200 $400 $600 $800 $1,000 Revenue/1kvisitors Spend/1k visitors Spent vs Profit 0% 10% 20% 30% 40% 50% 60% 70% 80% $- $200 $400 $600 $800 $1,000 $1,200 $1,400 $1,600 $1,800 PPC Ad Campaign Display Ad Campaign Email Campaign Revenue/1000 visitors Spend/1000 visitors Profit $ % Profit Share Media Profit Index Media profit index bubbles – describes the size of profit earned and the space where it stands between investment and revenue Spent vs Profit – explains the ad campaign Spend to Earn ratio and the profit shared among other media campaigns • PPC Ad Campaign ➢ The most profitable campaign Sharing 75% of the profit and stands at 38% of money spent • Display Ad Campaign ➢ Very low profit earning campaign sharing 6% of profit share but stands tall at 49% of money spent • Email Ad Campaign ➢ Moderate performing Ad campaign sharing just 13% of money spent yet still returns 19% of profit earned Created by Sathish Kumaar
- 6. To Reduce/Optimize Ad Spend for 2010 PPC Ad Campaign Display Ad… Email Campaign $0 $200 $400 $600 $800 $1,000 $1,200 $1,400 $0 $200 $400 $600 $800 $1,000 Revenue/1kvisitors Spend/1k visitors Spent vs Profit 0 10 20 30 40 50 60 70 80 $0 $200 $400 $600 $800 $1,000 $1,200 $1,400 $1,600 $1,800 PPC Ad Campaign Display Ad Campaign Email Campaign Revenue/1000 visitors Spend/1000 visitors Profit $ % Profit Share Media Profit Index Note: This model is a suggested to reduce and optimize Ad expense Approach – Display Ad expense share of expense is controlled to 25% whereas PPC and Email Ad campaign expense is optimized to 50% and 20% respectively • PPC Ad Campaign ➢ This remains to be the most profitable campaign Sharing 76% of the profit and stands at 50% of money spent • Display Ad Campaign ➢ Being moderately invested campaign sharing 25% of amount spent earned 2% of profit share • Email Ad Campaign ➢ The lowest invested Ad campaign sharing just 20 % of money spent yet still returns moderately 22% of profit earned • This approach returned $2064 /1k visitors as revenue leaving $27 more profit and running cost is $84 cheaper than the existing model Created by Sathish Kumaar
- 7. To Increase Revenue Spend for 2010 PPC Ad Campaign Display Ad Campaigns $0 $200 $400 $600 $800 $1,000 $1,200 $1,400 $1,600 $1,800 $2,000 $0 $500 $1,000 $1,500 $2,000 Revenue/1kvisitors Spend/1k visitors Spent vs Profit 0% 10% 20% 30% 40% 50% 60% 70% 80% 90% $0 $200 $400 $600 $800 $1,000 $1,200 $1,400 $1,600 $1,800 PPC Ad Campaign Display Ad Campaign Email Campaign Revenue/1000 visitors Spend/1000 visitors Profit $ % Profit Share Media Profit Index This model is a suggested to increase Ad revenue significantly: Approach – PPC Ad expense share of expense is boosted to 65% whereas Display and Email Ad campaign expense is controlled to 20% and 15% respectively • PPC Ad Campaign ➢ This becomes most profitable campaign Sharing 85% of the profit and stands at 65% of money spent • Display Ad Campaign ➢ Discontinuing display ad will cost a drop in brand awareness thus optimum investment of 20% is shared for a return of 2% profit share • Email Ad Campaign ➢ This Ad campaign was controlled to 19% to maximize to PPC performance yet still returns moderately 14% of profit share • This approach returned $2,227/1k visitors as revenue leaving $190 more profit than the existing model at the same running cost Created by Sathish Kumaar