SlideShare a Scribd company logo
1 of 11
2014-2015
Key achievement of Shoexpress as on May 2015
2013-2014
2012-2013
Area: Shoexpress Western Period Covering:
More Shukran Branding for each stores
(Rollup Stand/T Shirts for Shukran
Ambassader/In store Pos materials)
60% MTD
Conversion on
sale.
30th
Jun
2015
Team recognition for the best performer.(To
be arranged the certificate from the
management for the best performance
store, which will create the competition
60% MTD
Conversion on
sale.
30th
Jun
2015
Shukran Enrolment.
1155 Avg a month
enrolment on YTD
To be targeted 3 new enrolment from each
staff.
30% Increase on
Enrolment
30th
Jun
2015
Educating the employees on the referral
program.
Recruitment drive will be focused in
35%
Saudiazation
30th
Jun
2015
Area Game Plan For Lead Advance Training
Saudiazation 20%
KPI under review
Current
Performance
Action Agreed
Expected
result
By when
Shukran Conversion% 20%
Month Wise Shukran Conversion
Area Game Plan Achievement
Store wise enrollment planCity Store Sales % JLY AUG SEP OCT NOV DEC JAN FEB MAR APR MAY JUN TOTAL
Salam Mall 7% 80 80 80 80 80 80 825 387 581 467 1,046 891 4,678
Andalus 13% 130 130 130 130 130 130 1,532 718 1,079 867 1,943 1,655 8,576
Baladh 7% 80 80 80 80 80 80 825 387 581 467 1,046 891 4,678
Bawadi 4% 50 50 50 50 50 50 471 221 332 267 598 509 2,699
Roshan Mall 5% 50 50 50 50 50 50 589 276 415 333 747 637 3,298
Makrona 2% 20 20 20 20 20 20 236 111 166 133 299 255 1,319
Event Mall 5% 50 50 50 50 50 50 589 276 415 333 747 637 3,298
Aliyath 4% 40 40 40 40 40 40 471 221 332 267 598 509 2,639
Al-Noor 9% 90 90 90 90 90 90 1,061 497 747 600 1,345 1,146 5,937
Al-Manar 5% 40 40 40 40 40 40 589 276 415 333 747 637 3,238
Rashid Mall 5% 40 40 40 40 40 40 589 276 415 333 747 637 3,238
Makkah Shaoqia-Makkah 9% 90 90 90 90 90 90 1,061 497 747 600 1,345 1,146 5,937
Sabthal AlaySabthal Alay 4% 40 40 40 40 40 40 471 221 332 267 598 509 2,639
Mohail Mohail 1% 118 55 83 67 149 127 600
Taif 1 5% 60 60 60 60 60 60 589 276 415 333 747 637 3,358
Taif2 5% 60 60 60 60 60 60 589 276 415 333 747 637 3,358
Yanbu 5% 60 60 60 60 60 60 589 276 415 333 747 637 3,358
Yanbu Mall 5% 20 20 20 20 20 20 589 276 415 333 747 637 3,118
Total 100% 1,000 1,000 1,000 1,000 1,000 1,000 11,787 5,526 8,302 6,669 14,949 12,734 65,967
Jeddah
Madinah
Taif
Yanbu
Shukran Enrollment Plan (Revised) 2014-2015
Area Game Plan Achievement
Shukran Enrollment target has increased by 21% growth on YTD
Saudiazation
Saudiazation increased upto 27% with the help of regular follow
up through HR dpt
Key achievement in Shoemart as a Area Manager (2011-2012)
KPI's Measure Target Achievement Weightage Self Review Comments
As defined previously As defined previously As defined previously
As defined
previously
How do you think you performed?
Mention specific achievements here
Sales Performance
Achievement on Sales Target in
% and by Value in AED mn (by
Territory/ Area/ Store)
Achievement on Sales Target
in 100% and by Value in
SR.57.46mn Shoemart
53.18 mn and Shoexpress
4.28 mn.
30%
SHOEMART:108% of the Sale Target
Achievement.(The target till April Sr.
41,713,251/-Actual. Sr.44,941,507/-
)SHOEXPRESS: 127% of the Sales
Target Acheivement. (Budget till April
3,240,898.Actual 4,126,765)
Sales Growth % increase in LFL sales growth
Acheivement of 9% increase
in LFL sales growth
15%
15% increase in SM LFL Growth.(CY
Actual 37,496,087/-PY Actual
32,532,613/-) 60% increase in SX LFL
Growth(CY Actual 2,294,327 PY Actual
1,606,691)
Store Productivity
% increase in ATV Value
monthly / quarterly / annually (By
Brand/Dept)
5% increase in ATV Value
annually (By Area) (LY YTD
ATV SAR.114/-)
15%
8 % increase in SM Atv.(CY ATV Sr.132/-
PY ATV Sr.122/- 19% increase in SX
ATV.(CY ATV Sr. 78/- PY ATV Sr.65/-)
Loss Prevention
Achievement within 'X Value'
Cost of Damage/Loss goods on
display on physical or invisible
inventory
Achievement within 0.30%
value of damage/loos goods
on display on physical or
invisible inventory.
20%
0.19% of the damage/wrong pairs
stocks of SM. 0.20% of the
damages/wrong pairs stocks of SX
Shrinkage
% decrease in shrinkage value
(pilferage, process loss,
damage)
Acheivement within 0 .30%
target stocks varience as a
percentage of value sold.
10%
0.35% Shrinkage according to the half
year inventory of SM . (qty -4,607and its
value - 108,384) 0.13% Shrinkage
according to the half year inventory of
SX (qty -218 and its value - 3,426)
People Capability
% number of employees trained
during the year
70% number of employees
trained during the year and to
be developed 2 store
manager and 1 area manager
10%
3 store managers have been
developed and nominated for the new
stores (Elahi for Carpisa and Dumond
at central park Jamy for Shoemart at
Albaha and Ameer for Shoemart at Al
Noor.) Area coordinter has been
developed and also grooming to take
LANDMARK GROUP
INDIVIDUAL PERFORMANCE AT LANDMARK (IPL)
ANNUAL PERFORMANCE REVIEW
KPI's Measure Target Achievement Weightage Self Review Comments
As defined previously As defined previously As defined previously
As defined
previously
How do you think you performed?
Mention specific achievements here
Sales Performance
Achievement on Sales Target in
% and by Value in AED mn (by
Territory/ Area/ Store)
Achievement on Sales Target
in 100% and by Value in
SR.40,234,591mn (by Area)
30%
118% of the Sales Target were
Achieved.The Target Till April
Sr.29,744,632/-Actual Sr.35,126,202/-
(114% will be the achievement with the
projected sales of May and
June.Target exclude with sx flemingo
38, 567,961Actual will be 44,349,161)
Sales Growth % increase in LFL sales growth
4% increase in LFL sales
growth
10%
23% More on Target.(27% increased in
LFL Sales.CY Actual Sr.32,531,612.LY
Actual Sr.25,657,075)
Store Productivity
% increase in ATV Value
monthly / quarterly / annually (By
Brand/Dept)
8% increase in ATV Value
annually (By Area)
10%
0% increase in ATV.(CY ATV Sr.123/-LY
ATV Sr. 123/-)
Loss Prevention
Achievement within 'X Value'
Cost of Damage/Loss goods on
display on physical or invisible
inventory
Achievement within 0.9%
Cost of Damage/Loss goods
on display on physical or
invisible inventory(362,111)
20%
Cost of the Damage Value for the CY is
Sr.51,182/-(14.25% of the Targeted
Value and 0.15% of the Sales Value.)
Shrinkage
% decrease in shrinkage value
(pilferage, process loss,
damage)
2% decrease in shrinkage
value (pilferage, process loss,
damage) to the 0.9%
benchmark
15%
3% Decrease in Shrinkage Value with
0.30% of the sales value. (CY
Shrinkage Value Sr.-129,362/- LY
Shrinkage Value Sr.133,534/-)
People Capability
% number of employees trained
during the year
70% number of employees
trained during the year
15%
91 % of the employees trained on
Sukran,Art of Selling,Product
knowledge and online GTM Creativity
with scanner usage for check
LANDMARK GROUP
INDIVIDUAL PERFORMANCE AT LANDMARK (IPL)
ANNUAL PERFORMANCE REVIEW
KPI's Measure Target Achievement Weightage Self Review Comments
As defined previously As defined previously As defined previously
As defined
previously
How do you think you performed?
Mention specific achievements here
Sales Performance
Achievement on Sales Target in
% and by Value in AED mn (by
Territory/ Area/ Store)
Achievement on Sales Target
in 100% and by Value in
SR.38,351,234 mn (by Area)
30%
SHOEMART:105% of the Sale Target
Achievement.(Target sr.30,037,217/-
Actual sr.31,411,962/-)SHOEXPRESS:
70% Sales Target Acheivement.
Target sr.5,365,500.Actual
sr.3,754,267)
Sales Growth % increase in LFL sales growth
4% increase in LFL sales
growth
10%
10% increased in LFL Growth.CY
Actual sr.31,411,962/-PY Actual
sr.28,534,605/-)
Store Productivity
% increase in ATV Value
monthly / quarterly / annually (By
Brand/Dept)
10% increase in ATV Value
annually (By Area)
10%
8% increased in ATV(CY ATV Sr.127/-
LY ATV Sr.118/-)
Loss Prevention
Achievement within 'X Value'
Cost of Damage/Loss goods on
display on physical or invisible
inventory
Achievement within 0.9%
Cost of Damage/Loss goods
on display on physical or
invisible inventory(342,021)
20%
SHOEMART:Damaged stocks which
are written off for the year .
sr.40,708.SHOEXPRESS: Written off
Sr.2,835/-(Total 13% of the targeted
value)
Shrinkage
% decrease in shrinkage value
(pilferage, process loss,
damage)
2% decrease in shrinkage
value (pilferage, process loss,
damage) to the 0.9%
benchmark
15%
SHOEMART:0.57% shrinkage as per
financial year inventory.(12%
Decrease in compare to last year
shrinkage: Ly shrinkage value sr -
236,288/- Cy shrinkage value Sr.-
177,078/-.SHOEXPRESS:0.62%
shrinkage and value Sr.-23,167/-
People Capability
% number of employees trained
during the year
70% number of employees
trained during the year
15%
88 % of the employees trained on Art
of selling,Product knowledge and
Coaching of Mentoring for the Store
Managers.New training module for
the products knwoledge were
started.
LANDMARK GROUP
INDIVIDUAL PERFORMANCE AT LANDMARK (IPL)
ANNUAL PERFORMANCE REVIEW
Key Achievement in Shoemart as a Area Manager (2009-2010)

More Related Content

Similar to Key acheivement

The_4_Sales_Reports_for_CEO
The_4_Sales_Reports_for_CEOThe_4_Sales_Reports_for_CEO
The_4_Sales_Reports_for_CEOPatrick Kenny
 
The Finance Perspective: The Business Model for the Subscription Economy
The Finance Perspective: The Business Model for the Subscription EconomyThe Finance Perspective: The Business Model for the Subscription Economy
The Finance Perspective: The Business Model for the Subscription EconomyZuora, Inc.
 
Revenue Projection PowerPoint Presentation Slides
Revenue Projection PowerPoint Presentation SlidesRevenue Projection PowerPoint Presentation Slides
Revenue Projection PowerPoint Presentation SlidesSlideTeam
 
Improving profitability of campaigns through data science
Improving profitability of campaigns through data scienceImproving profitability of campaigns through data science
Improving profitability of campaigns through data scienceswebi
 
Power financials - how we work
Power financials - how we workPower financials - how we work
Power financials - how we workSteve Power
 
Mike's Bikes Final Presentation.1
Mike's Bikes Final Presentation.1Mike's Bikes Final Presentation.1
Mike's Bikes Final Presentation.1Gestring Pat
 
Yearly Sales Plan_Square Toiletries Ltd_2019
Yearly Sales Plan_Square Toiletries Ltd_2019Yearly Sales Plan_Square Toiletries Ltd_2019
Yearly Sales Plan_Square Toiletries Ltd_2019Abdur Rakib Mohammad
 
JAC presentation
JAC presentationJAC presentation
JAC presentationyounis khan
 
IBM Vision 2017 Conference Session #1148 - Leveraging Planning Analytics & CD...
IBM Vision 2017 Conference Session #1148 - Leveraging Planning Analytics & CD...IBM Vision 2017 Conference Session #1148 - Leveraging Planning Analytics & CD...
IBM Vision 2017 Conference Session #1148 - Leveraging Planning Analytics & CD...QueBIT Consulting
 
Magnit FY2014 Financial Results
Magnit FY2014 Financial ResultsMagnit FY2014 Financial Results
Magnit FY2014 Financial ResultsMagnit IR Team
 
Example of Business Operations Analysis
Example of Business Operations AnalysisExample of Business Operations Analysis
Example of Business Operations AnalysisBojan Mitrovic, M.A.
 
Pay Forecast PowerPoint Presentation Slides
Pay Forecast PowerPoint Presentation Slides Pay Forecast PowerPoint Presentation Slides
Pay Forecast PowerPoint Presentation Slides SlideTeam
 
4 t15 arezzo_apresentacao_call ing
4 t15 arezzo_apresentacao_call ing4 t15 arezzo_apresentacao_call ing
4 t15 arezzo_apresentacao_call ingArezzori
 
Operations performance analysis that facilitates an informed decision making ...
Operations performance analysis that facilitates an informed decision making ...Operations performance analysis that facilitates an informed decision making ...
Operations performance analysis that facilitates an informed decision making ...Bojan Mitrovic, M.A.
 
Revenue Forecasting PowerPoint Presentation Slides
Revenue Forecasting PowerPoint Presentation SlidesRevenue Forecasting PowerPoint Presentation Slides
Revenue Forecasting PowerPoint Presentation SlidesSlideTeam
 
The Metrics That Matter - Zuora Subscribed 2017
The Metrics That Matter - Zuora Subscribed 2017The Metrics That Matter - Zuora Subscribed 2017
The Metrics That Matter - Zuora Subscribed 2017Matthew Tribe
 

Similar to Key acheivement (20)

The_4_Sales_Reports_for_CEO
The_4_Sales_Reports_for_CEOThe_4_Sales_Reports_for_CEO
The_4_Sales_Reports_for_CEO
 
The Finance Perspective: The Business Model for the Subscription Economy
The Finance Perspective: The Business Model for the Subscription EconomyThe Finance Perspective: The Business Model for the Subscription Economy
The Finance Perspective: The Business Model for the Subscription Economy
 
Revenue Projection PowerPoint Presentation Slides
Revenue Projection PowerPoint Presentation SlidesRevenue Projection PowerPoint Presentation Slides
Revenue Projection PowerPoint Presentation Slides
 
Improving profitability of campaigns through data science
Improving profitability of campaigns through data scienceImproving profitability of campaigns through data science
Improving profitability of campaigns through data science
 
Power financials - how we work
Power financials - how we workPower financials - how we work
Power financials - how we work
 
Mike's Bikes Final Presentation.1
Mike's Bikes Final Presentation.1Mike's Bikes Final Presentation.1
Mike's Bikes Final Presentation.1
 
Yearly Sales Plan_Square Toiletries Ltd_2019
Yearly Sales Plan_Square Toiletries Ltd_2019Yearly Sales Plan_Square Toiletries Ltd_2019
Yearly Sales Plan_Square Toiletries Ltd_2019
 
JAC presentation
JAC presentationJAC presentation
JAC presentation
 
IBM Vision 2017 Conference Session #1148 - Leveraging Planning Analytics & CD...
IBM Vision 2017 Conference Session #1148 - Leveraging Planning Analytics & CD...IBM Vision 2017 Conference Session #1148 - Leveraging Planning Analytics & CD...
IBM Vision 2017 Conference Session #1148 - Leveraging Planning Analytics & CD...
 
Magnit FY2014 Financial Results
Magnit FY2014 Financial ResultsMagnit FY2014 Financial Results
Magnit FY2014 Financial Results
 
HDC hyundai development company 294870 Algorithm Investment report
HDC hyundai development company 294870 Algorithm Investment reportHDC hyundai development company 294870 Algorithm Investment report
HDC hyundai development company 294870 Algorithm Investment report
 
hyundai wia 011210 Algorithm Investment Report
hyundai wia 011210 Algorithm Investment Reporthyundai wia 011210 Algorithm Investment Report
hyundai wia 011210 Algorithm Investment Report
 
Example of Business Operations Analysis
Example of Business Operations AnalysisExample of Business Operations Analysis
Example of Business Operations Analysis
 
ecoprobm 247540 Algorithm Investment Report
ecoprobm 247540 Algorithm Investment Reportecoprobm 247540 Algorithm Investment Report
ecoprobm 247540 Algorithm Investment Report
 
Pay Forecast PowerPoint Presentation Slides
Pay Forecast PowerPoint Presentation Slides Pay Forecast PowerPoint Presentation Slides
Pay Forecast PowerPoint Presentation Slides
 
emart 139480 Algorithm Investment Report
emart 139480 Algorithm Investment Reportemart 139480 Algorithm Investment Report
emart 139480 Algorithm Investment Report
 
4 t15 arezzo_apresentacao_call ing
4 t15 arezzo_apresentacao_call ing4 t15 arezzo_apresentacao_call ing
4 t15 arezzo_apresentacao_call ing
 
Operations performance analysis that facilitates an informed decision making ...
Operations performance analysis that facilitates an informed decision making ...Operations performance analysis that facilitates an informed decision making ...
Operations performance analysis that facilitates an informed decision making ...
 
Revenue Forecasting PowerPoint Presentation Slides
Revenue Forecasting PowerPoint Presentation SlidesRevenue Forecasting PowerPoint Presentation Slides
Revenue Forecasting PowerPoint Presentation Slides
 
The Metrics That Matter - Zuora Subscribed 2017
The Metrics That Matter - Zuora Subscribed 2017The Metrics That Matter - Zuora Subscribed 2017
The Metrics That Matter - Zuora Subscribed 2017
 

Key acheivement

  • 1. 2014-2015 Key achievement of Shoexpress as on May 2015
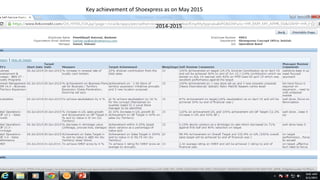
  • 4. Area: Shoexpress Western Period Covering: More Shukran Branding for each stores (Rollup Stand/T Shirts for Shukran Ambassader/In store Pos materials) 60% MTD Conversion on sale. 30th Jun 2015 Team recognition for the best performer.(To be arranged the certificate from the management for the best performance store, which will create the competition 60% MTD Conversion on sale. 30th Jun 2015 Shukran Enrolment. 1155 Avg a month enrolment on YTD To be targeted 3 new enrolment from each staff. 30% Increase on Enrolment 30th Jun 2015 Educating the employees on the referral program. Recruitment drive will be focused in 35% Saudiazation 30th Jun 2015 Area Game Plan For Lead Advance Training Saudiazation 20% KPI under review Current Performance Action Agreed Expected result By when Shukran Conversion% 20%
  • 5. Month Wise Shukran Conversion Area Game Plan Achievement
  • 6. Store wise enrollment planCity Store Sales % JLY AUG SEP OCT NOV DEC JAN FEB MAR APR MAY JUN TOTAL Salam Mall 7% 80 80 80 80 80 80 825 387 581 467 1,046 891 4,678 Andalus 13% 130 130 130 130 130 130 1,532 718 1,079 867 1,943 1,655 8,576 Baladh 7% 80 80 80 80 80 80 825 387 581 467 1,046 891 4,678 Bawadi 4% 50 50 50 50 50 50 471 221 332 267 598 509 2,699 Roshan Mall 5% 50 50 50 50 50 50 589 276 415 333 747 637 3,298 Makrona 2% 20 20 20 20 20 20 236 111 166 133 299 255 1,319 Event Mall 5% 50 50 50 50 50 50 589 276 415 333 747 637 3,298 Aliyath 4% 40 40 40 40 40 40 471 221 332 267 598 509 2,639 Al-Noor 9% 90 90 90 90 90 90 1,061 497 747 600 1,345 1,146 5,937 Al-Manar 5% 40 40 40 40 40 40 589 276 415 333 747 637 3,238 Rashid Mall 5% 40 40 40 40 40 40 589 276 415 333 747 637 3,238 Makkah Shaoqia-Makkah 9% 90 90 90 90 90 90 1,061 497 747 600 1,345 1,146 5,937 Sabthal AlaySabthal Alay 4% 40 40 40 40 40 40 471 221 332 267 598 509 2,639 Mohail Mohail 1% 118 55 83 67 149 127 600 Taif 1 5% 60 60 60 60 60 60 589 276 415 333 747 637 3,358 Taif2 5% 60 60 60 60 60 60 589 276 415 333 747 637 3,358 Yanbu 5% 60 60 60 60 60 60 589 276 415 333 747 637 3,358 Yanbu Mall 5% 20 20 20 20 20 20 589 276 415 333 747 637 3,118 Total 100% 1,000 1,000 1,000 1,000 1,000 1,000 11,787 5,526 8,302 6,669 14,949 12,734 65,967 Jeddah Madinah Taif Yanbu Shukran Enrollment Plan (Revised) 2014-2015 Area Game Plan Achievement
  • 7. Shukran Enrollment target has increased by 21% growth on YTD
  • 8. Saudiazation Saudiazation increased upto 27% with the help of regular follow up through HR dpt
  • 9. Key achievement in Shoemart as a Area Manager (2011-2012) KPI's Measure Target Achievement Weightage Self Review Comments As defined previously As defined previously As defined previously As defined previously How do you think you performed? Mention specific achievements here Sales Performance Achievement on Sales Target in % and by Value in AED mn (by Territory/ Area/ Store) Achievement on Sales Target in 100% and by Value in SR.57.46mn Shoemart 53.18 mn and Shoexpress 4.28 mn. 30% SHOEMART:108% of the Sale Target Achievement.(The target till April Sr. 41,713,251/-Actual. Sr.44,941,507/- )SHOEXPRESS: 127% of the Sales Target Acheivement. (Budget till April 3,240,898.Actual 4,126,765) Sales Growth % increase in LFL sales growth Acheivement of 9% increase in LFL sales growth 15% 15% increase in SM LFL Growth.(CY Actual 37,496,087/-PY Actual 32,532,613/-) 60% increase in SX LFL Growth(CY Actual 2,294,327 PY Actual 1,606,691) Store Productivity % increase in ATV Value monthly / quarterly / annually (By Brand/Dept) 5% increase in ATV Value annually (By Area) (LY YTD ATV SAR.114/-) 15% 8 % increase in SM Atv.(CY ATV Sr.132/- PY ATV Sr.122/- 19% increase in SX ATV.(CY ATV Sr. 78/- PY ATV Sr.65/-) Loss Prevention Achievement within 'X Value' Cost of Damage/Loss goods on display on physical or invisible inventory Achievement within 0.30% value of damage/loos goods on display on physical or invisible inventory. 20% 0.19% of the damage/wrong pairs stocks of SM. 0.20% of the damages/wrong pairs stocks of SX Shrinkage % decrease in shrinkage value (pilferage, process loss, damage) Acheivement within 0 .30% target stocks varience as a percentage of value sold. 10% 0.35% Shrinkage according to the half year inventory of SM . (qty -4,607and its value - 108,384) 0.13% Shrinkage according to the half year inventory of SX (qty -218 and its value - 3,426) People Capability % number of employees trained during the year 70% number of employees trained during the year and to be developed 2 store manager and 1 area manager 10% 3 store managers have been developed and nominated for the new stores (Elahi for Carpisa and Dumond at central park Jamy for Shoemart at Albaha and Ameer for Shoemart at Al Noor.) Area coordinter has been developed and also grooming to take LANDMARK GROUP INDIVIDUAL PERFORMANCE AT LANDMARK (IPL) ANNUAL PERFORMANCE REVIEW
  • 10. KPI's Measure Target Achievement Weightage Self Review Comments As defined previously As defined previously As defined previously As defined previously How do you think you performed? Mention specific achievements here Sales Performance Achievement on Sales Target in % and by Value in AED mn (by Territory/ Area/ Store) Achievement on Sales Target in 100% and by Value in SR.40,234,591mn (by Area) 30% 118% of the Sales Target were Achieved.The Target Till April Sr.29,744,632/-Actual Sr.35,126,202/- (114% will be the achievement with the projected sales of May and June.Target exclude with sx flemingo 38, 567,961Actual will be 44,349,161) Sales Growth % increase in LFL sales growth 4% increase in LFL sales growth 10% 23% More on Target.(27% increased in LFL Sales.CY Actual Sr.32,531,612.LY Actual Sr.25,657,075) Store Productivity % increase in ATV Value monthly / quarterly / annually (By Brand/Dept) 8% increase in ATV Value annually (By Area) 10% 0% increase in ATV.(CY ATV Sr.123/-LY ATV Sr. 123/-) Loss Prevention Achievement within 'X Value' Cost of Damage/Loss goods on display on physical or invisible inventory Achievement within 0.9% Cost of Damage/Loss goods on display on physical or invisible inventory(362,111) 20% Cost of the Damage Value for the CY is Sr.51,182/-(14.25% of the Targeted Value and 0.15% of the Sales Value.) Shrinkage % decrease in shrinkage value (pilferage, process loss, damage) 2% decrease in shrinkage value (pilferage, process loss, damage) to the 0.9% benchmark 15% 3% Decrease in Shrinkage Value with 0.30% of the sales value. (CY Shrinkage Value Sr.-129,362/- LY Shrinkage Value Sr.133,534/-) People Capability % number of employees trained during the year 70% number of employees trained during the year 15% 91 % of the employees trained on Sukran,Art of Selling,Product knowledge and online GTM Creativity with scanner usage for check LANDMARK GROUP INDIVIDUAL PERFORMANCE AT LANDMARK (IPL) ANNUAL PERFORMANCE REVIEW
  • 11. KPI's Measure Target Achievement Weightage Self Review Comments As defined previously As defined previously As defined previously As defined previously How do you think you performed? Mention specific achievements here Sales Performance Achievement on Sales Target in % and by Value in AED mn (by Territory/ Area/ Store) Achievement on Sales Target in 100% and by Value in SR.38,351,234 mn (by Area) 30% SHOEMART:105% of the Sale Target Achievement.(Target sr.30,037,217/- Actual sr.31,411,962/-)SHOEXPRESS: 70% Sales Target Acheivement. Target sr.5,365,500.Actual sr.3,754,267) Sales Growth % increase in LFL sales growth 4% increase in LFL sales growth 10% 10% increased in LFL Growth.CY Actual sr.31,411,962/-PY Actual sr.28,534,605/-) Store Productivity % increase in ATV Value monthly / quarterly / annually (By Brand/Dept) 10% increase in ATV Value annually (By Area) 10% 8% increased in ATV(CY ATV Sr.127/- LY ATV Sr.118/-) Loss Prevention Achievement within 'X Value' Cost of Damage/Loss goods on display on physical or invisible inventory Achievement within 0.9% Cost of Damage/Loss goods on display on physical or invisible inventory(342,021) 20% SHOEMART:Damaged stocks which are written off for the year . sr.40,708.SHOEXPRESS: Written off Sr.2,835/-(Total 13% of the targeted value) Shrinkage % decrease in shrinkage value (pilferage, process loss, damage) 2% decrease in shrinkage value (pilferage, process loss, damage) to the 0.9% benchmark 15% SHOEMART:0.57% shrinkage as per financial year inventory.(12% Decrease in compare to last year shrinkage: Ly shrinkage value sr - 236,288/- Cy shrinkage value Sr.- 177,078/-.SHOEXPRESS:0.62% shrinkage and value Sr.-23,167/- People Capability % number of employees trained during the year 70% number of employees trained during the year 15% 88 % of the employees trained on Art of selling,Product knowledge and Coaching of Mentoring for the Store Managers.New training module for the products knwoledge were started. LANDMARK GROUP INDIVIDUAL PERFORMANCE AT LANDMARK (IPL) ANNUAL PERFORMANCE REVIEW Key Achievement in Shoemart as a Area Manager (2009-2010)