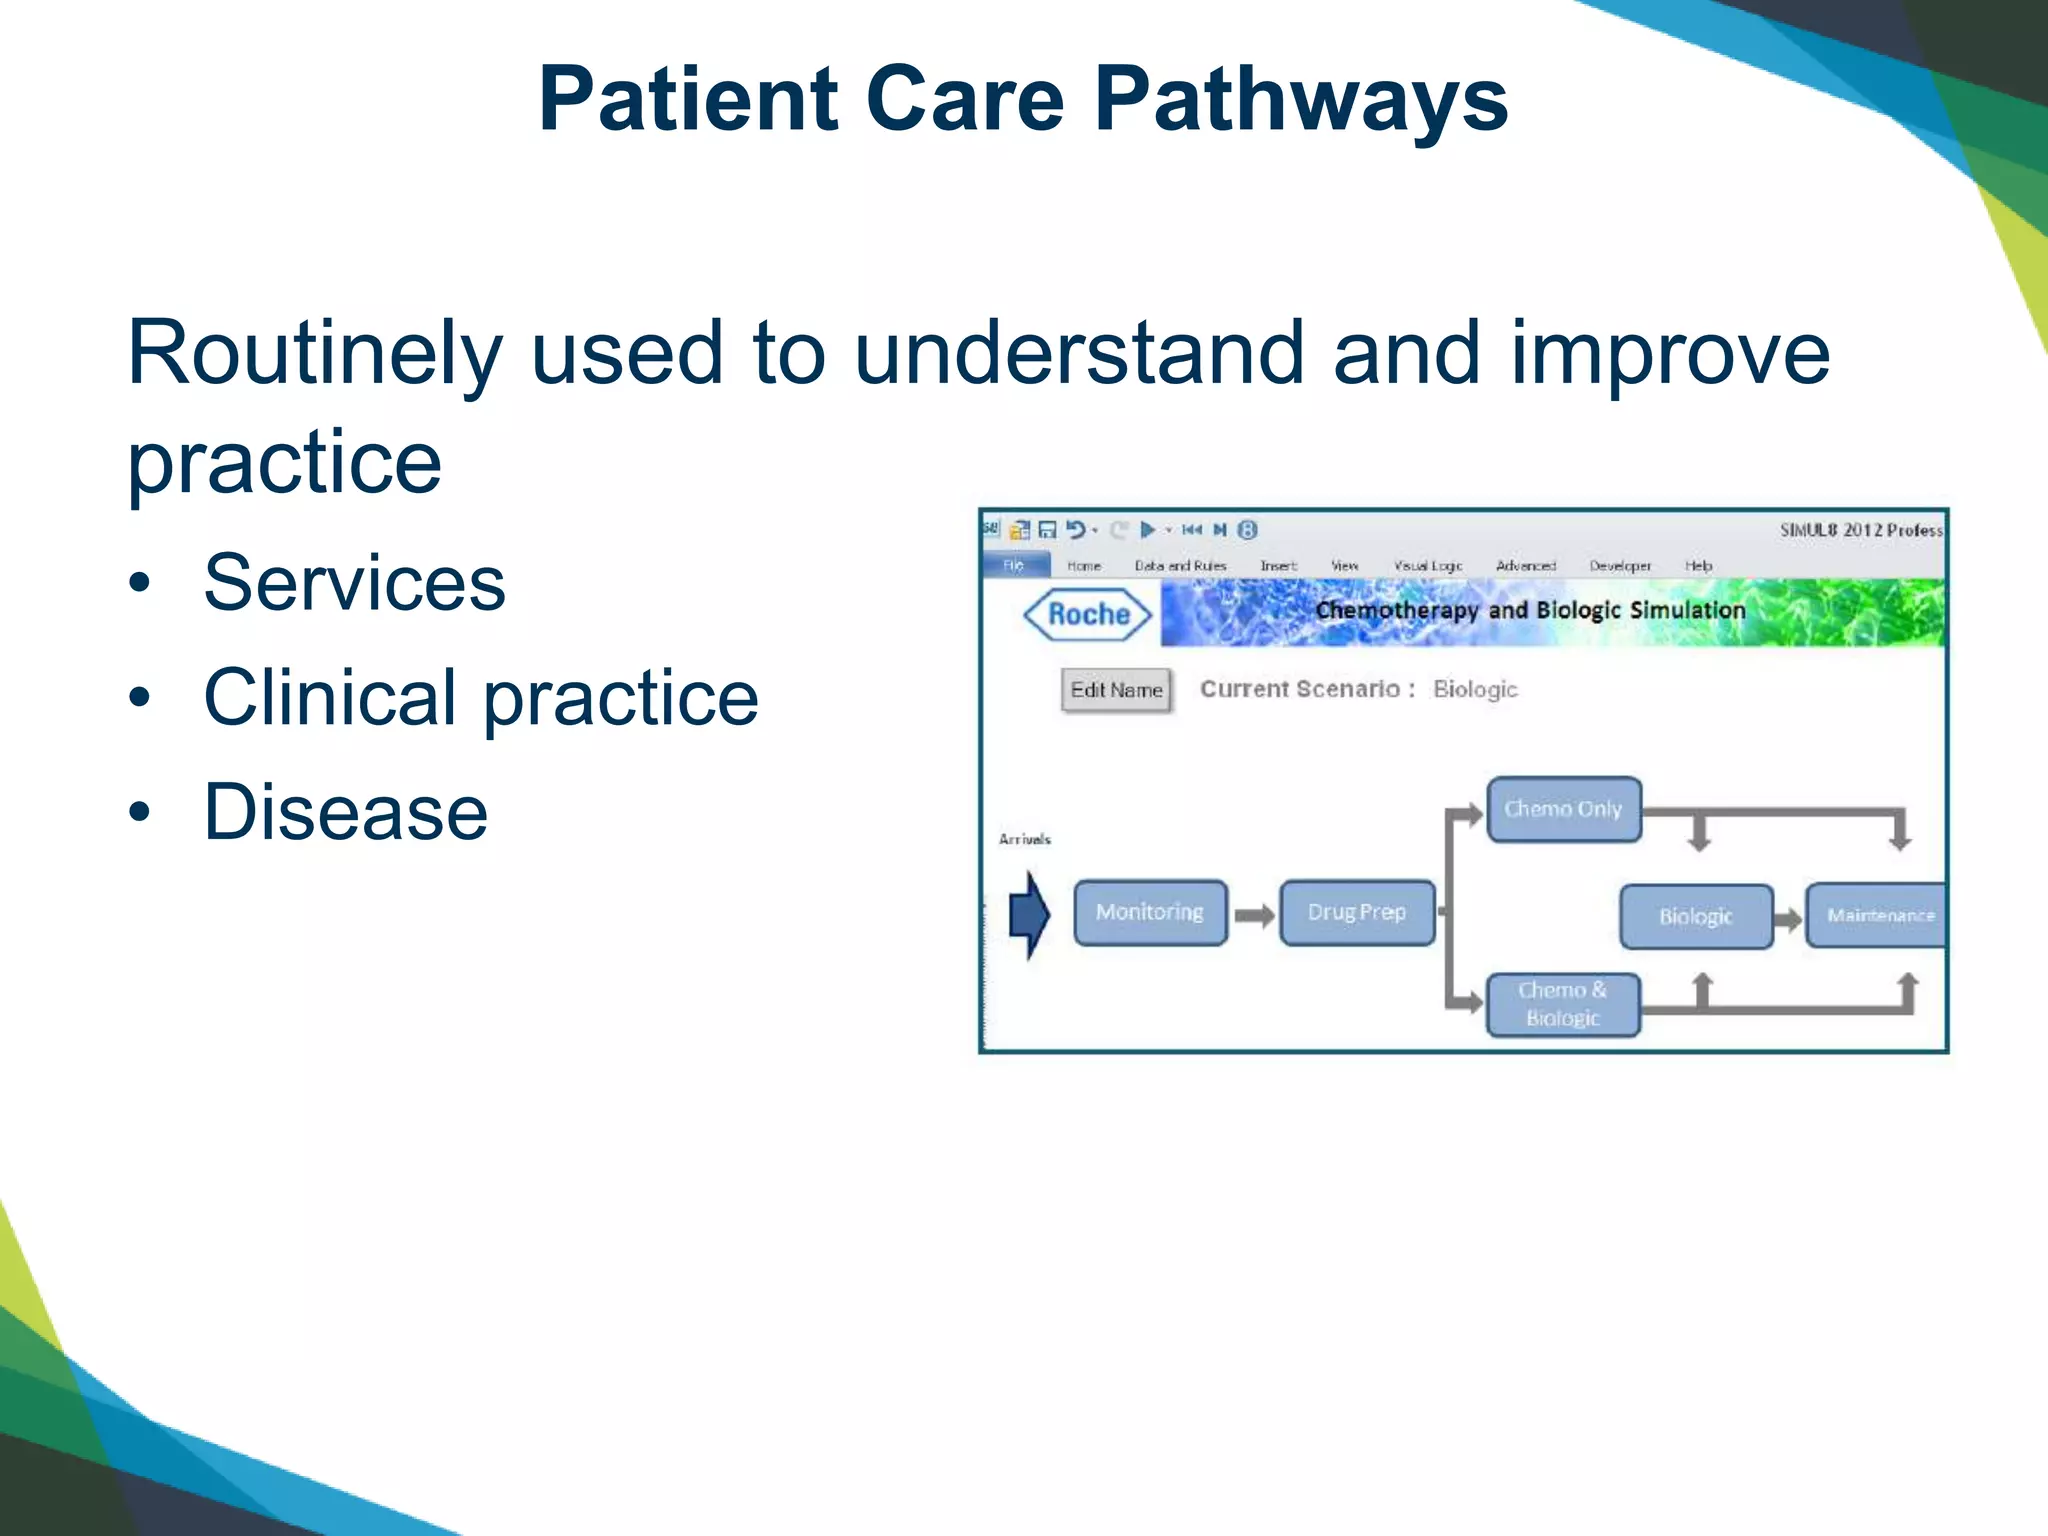
Improving Patient Care
Pathways
Claire Cordeaux: Executive Director, Healthcare
SIMUL8 Corporation | SIMUL8.com | info@SIMUL8.com
Presenter
Claire Cordeaux
Executive Director, Healthcare SIMUL8
SIMUL8 Corporation
claire.c@SIMUL8.com
SIMUL8 Corporation | SIMUL8.com | info@SIMUL8.com
• Understanding patient care through pathways
• How simulation can help
• Examples
• Standard of Care
• Sharing across a community
• How you can get involved
Agenda
Patient Care Pathways
Routinely used to understand and improve
practice
• Services
• Clinical practice
• Disease
Patient Care Pathways: Services
Process flow through services
Patient Care Pathways: Clinical Practice
Used to show best clinical practice.
Map of Medicine
Patient Care Pathways:
Disease Progression
Show progression through disease states
over time.
Our Approach to Simulating Pathways
Combining disease state transitions with
best practice and service access.
Why?
• Test impact of service redesign on disease
progression
• Genericized – can be used and localised by any
group interested improving pathways for patients
with the same condition
SIMUL8 Corporation | SIMUL8.com | info@SIMUL8.com
Disease Transitions: State Charts
• Define all disease
states patients can
transition to.
• Input the transitions
between states.
(Rates, %, Time)
• As simulation runs
patients will
transition to an from
states based on the
inputted rules.
SIMUL8 Corporation | SIMUL8.com | info@SIMUL8.com
Service Model
The disease transition model is linked to a service or
treatment model.
As patients transition into different states they use different
service. They trigger events in a DES model.
SIMUL8 Corporation | SIMUL8.com | info@SIMUL8.com
Best Clinical Practice
New interventions, best clinical practice,
service redesign can all be tested for impact
on:
Cost, Resource, Activity, Waiting times
AND
Disease Progression
SIMUL8 Corporation | SIMUL8.com | info@SIMUL8.com
Case Study 1: HIV
What is the impact of screening?
What is the impact of increasing frequency
of attendance to improve adherence?
• on future burden of disease
• projected treatment costs for the service
SIMUL8 Corporation | SIMUL8.com | info@SIMUL8.com
Age-banded
population
projections
Age-banded
disease
prevalence
Demand
1.23m x HIV 0.465% = 2531
Simulating Demand
SIMUL8 Corporation | SIMUL8.com | info@SIMUL8.com
Simulated Demand:
Catchment Population
The projected population is decreasing
SIMUL8 Corporation | SIMUL8.com | info@SIMUL8.com
25% of patients are
undiagnosed and use
this pathway.
Undiagnosed patients
can infect others.
Late diagnosis leads to
becoming symptomatic
and very sick.
Diagnosis (Current State)
SIMUL8 Corporation | SIMUL8.com | info@SIMUL8.com
Diagnosis (Current State)
Successful ART leads
to near normal life
expectancy
Cost per year if
symptomatic and
AIDs
75% of patients are
diagnosed and use this
pathway.
Diagnosed but
untreated can infect
others
Late diagnosis leads to
becoming symptomatic
and very sick
SIMUL8 Corporation | SIMUL8.com | info@SIMUL8.com
Costs (indicative only)
Cost $
Diagnosis 100
Follow up Appointment
and Drug therapy every 6
months
9,000
HIV symptoms (annual) 25,000
AIDS (1 year only) 50,000
SIMUL8 Corporation | SIMUL8.com | info@SIMUL8.com
Activity Results
These results represent no change for next
5 years.
0
2000
4000
6000
8000
10000
12000
14000
1 2 3 4 5
new infections
ART
Follow ups
SIMUL8 Corporation | SIMUL8.com | info@SIMUL8.com
What if screening reduces undiagnosed to 15%?
Costs decrease over time as fewer patients develop HIV
Symptoms and Aids and fewer are infected, although follow ups
increase.
0
50000000
100000000
150000000
200000000
250000000
1 2 3 4 5
Screening Costs
Costs
0
500
1000
1500
2000
2500
1 2 3 4 5
Screening Aids
Aids
Screening HIV
Sympt
HIV sympt
0
2000
4000
6000
8000
10000
12000
14000
1 2 3 4 5
Follow ups
ScreeningFollow
ups
Scenario 1 Results
SIMUL8 Corporation | SIMUL8.com | info@SIMUL8.com
What if we see patients every 3 instead of very 6
months and this increases successful ART?
Scenario 2
SIMUL8 Corporation | SIMUL8.com | info@SIMUL8.com
Scenario Results:
Increasing Treatment Frequency
Costs increase but infections reduce. Symptomatic
patients reduce in years 4 and 5
0
50000000
100000000
150000000
200000000
250000000
1 2 3 4 5
Screening Costs
Costs
Supported ART Costs
0
50
100
150
200
250
1 2 3 4 5
New infection baseline
New Infection
Screening
New infection
Supported ART
0
500
1000
1500
2000
2500
1 2 3 4 5
Baseline HIV sympt
Screening HIV Sympt
Support ART HIV Sympt
SIMUL8 Corporation | SIMUL8.com | info@SIMUL8.com
What Resources are Required?
0
2000
4000
6000
8000
10000
12000
14000
16000
1 2 3 4 5
Baseline follow ups
Sreening Follow ups
Support ART Follow ups
Follow ups increase in each scenario – with
100 weekly appointments wait times are
unacceptable.
SIMUL8 Corporation | SIMUL8.com | info@SIMUL8.com
Resource requirements
Increasing weekly appointments to 250
brings wait times in line with requirements
SIMUL8 Corporation | SIMUL8.com | info@SIMUL8.com
Case Study 2: Dementia
SIMUL8 Corporation | SIMUL8.com | info@SIMUL8.com
Results after multiple runs
SIMUL8 Corporation | SIMUL8.com | info@SIMUL8.com
Template Simulations
What are the key features of any disease
pathway?
Share your thoughts via our survey monkey and
we will report back.
SIMUL8 Corporation | SIMUL8.com | info@SIMUL8.com
Standard of Care
Imagine a simulated pathway including:
• Expected demand from population health predictions and
disease progression
• Evidence-based best clinical practice
• Localizable to individual providers and populations
Answering questions:
• What if I implement best practice?
• What will this look like in 3-5 years time?
• What resources will I need?
• How much will it cost/what income will I earn?
• Will I have patients waiting if I don’t increase staffing?
• What will patient outcomes be?
SIMUL8 Corporation | SIMUL8.com | info@SIMUL8.com
Share and Manage Pathways
on the Web
Have multiple user logins to access a suite of simulation models.
SIMUL8 Corporation | SIMUL8.com | info@SIMUL8.com
Create Simulation Suites
Upload multiple models which user can run, change, SAVE and EXPORT
results from. These users can also share these with others.
SIMUL8 Corporation | SIMUL8.com | info@SIMUL8.com
Manage Access
Create localized simulations and assign them so that only specific users can
view particular simulations.
SIMUL8 Corporation | SIMUL8.com | info@SIMUL8.com
Do Once and Share
Our offer to you
Help us build pathways we can share.
Send us your pathway suggestions and we
will choose one to build and share using our
new technology
Email to healthteam@simul8.com
SIMUL8 Corporation | SIMUL8.com | info@SIMUL8.com
QUESTIONS
Please forward any topics you would like to
see covered to claire.c@simul8.com
Continue the discussion on SIMUL8 in
Health – LinkedIn Group
September Workshop – “Optimizing
Outpatient Operations – Staffing &
Scheduling”.

Online Workshop: Improving Patient Care Pathways

  • 1.
    Improving Patient Care Pathways ClaireCordeaux: Executive Director, Healthcare
  • 2.
    SIMUL8 Corporation |SIMUL8.com | info@SIMUL8.com Presenter Claire Cordeaux Executive Director, Healthcare SIMUL8 SIMUL8 Corporation claire.c@SIMUL8.com
  • 3.
    SIMUL8 Corporation |SIMUL8.com | info@SIMUL8.com • Understanding patient care through pathways • How simulation can help • Examples • Standard of Care • Sharing across a community • How you can get involved Agenda
  • 4.
    Patient Care Pathways Routinelyused to understand and improve practice • Services • Clinical practice • Disease
  • 5.
    Patient Care Pathways:Services Process flow through services
  • 6.
    Patient Care Pathways:Clinical Practice Used to show best clinical practice. Map of Medicine
  • 7.
    Patient Care Pathways: DiseaseProgression Show progression through disease states over time.
  • 8.
    Our Approach toSimulating Pathways Combining disease state transitions with best practice and service access. Why? • Test impact of service redesign on disease progression • Genericized – can be used and localised by any group interested improving pathways for patients with the same condition
  • 9.
    SIMUL8 Corporation |SIMUL8.com | info@SIMUL8.com Disease Transitions: State Charts • Define all disease states patients can transition to. • Input the transitions between states. (Rates, %, Time) • As simulation runs patients will transition to an from states based on the inputted rules.
  • 10.
    SIMUL8 Corporation |SIMUL8.com | info@SIMUL8.com Service Model The disease transition model is linked to a service or treatment model. As patients transition into different states they use different service. They trigger events in a DES model.
  • 11.
    SIMUL8 Corporation |SIMUL8.com | info@SIMUL8.com Best Clinical Practice New interventions, best clinical practice, service redesign can all be tested for impact on: Cost, Resource, Activity, Waiting times AND Disease Progression
  • 12.
    SIMUL8 Corporation |SIMUL8.com | info@SIMUL8.com Case Study 1: HIV What is the impact of screening? What is the impact of increasing frequency of attendance to improve adherence? • on future burden of disease • projected treatment costs for the service
  • 13.
    SIMUL8 Corporation |SIMUL8.com | info@SIMUL8.com Age-banded population projections Age-banded disease prevalence Demand 1.23m x HIV 0.465% = 2531 Simulating Demand
  • 14.
    SIMUL8 Corporation |SIMUL8.com | info@SIMUL8.com Simulated Demand: Catchment Population The projected population is decreasing
  • 15.
    SIMUL8 Corporation |SIMUL8.com | info@SIMUL8.com 25% of patients are undiagnosed and use this pathway. Undiagnosed patients can infect others. Late diagnosis leads to becoming symptomatic and very sick. Diagnosis (Current State)
  • 16.
    SIMUL8 Corporation |SIMUL8.com | info@SIMUL8.com Diagnosis (Current State) Successful ART leads to near normal life expectancy Cost per year if symptomatic and AIDs 75% of patients are diagnosed and use this pathway. Diagnosed but untreated can infect others Late diagnosis leads to becoming symptomatic and very sick
  • 17.
    SIMUL8 Corporation |SIMUL8.com | info@SIMUL8.com Costs (indicative only) Cost $ Diagnosis 100 Follow up Appointment and Drug therapy every 6 months 9,000 HIV symptoms (annual) 25,000 AIDS (1 year only) 50,000
  • 18.
    SIMUL8 Corporation |SIMUL8.com | info@SIMUL8.com Activity Results These results represent no change for next 5 years. 0 2000 4000 6000 8000 10000 12000 14000 1 2 3 4 5 new infections ART Follow ups
  • 19.
    SIMUL8 Corporation |SIMUL8.com | info@SIMUL8.com What if screening reduces undiagnosed to 15%? Costs decrease over time as fewer patients develop HIV Symptoms and Aids and fewer are infected, although follow ups increase. 0 50000000 100000000 150000000 200000000 250000000 1 2 3 4 5 Screening Costs Costs 0 500 1000 1500 2000 2500 1 2 3 4 5 Screening Aids Aids Screening HIV Sympt HIV sympt 0 2000 4000 6000 8000 10000 12000 14000 1 2 3 4 5 Follow ups ScreeningFollow ups Scenario 1 Results
  • 20.
    SIMUL8 Corporation |SIMUL8.com | info@SIMUL8.com What if we see patients every 3 instead of very 6 months and this increases successful ART? Scenario 2
  • 21.
    SIMUL8 Corporation |SIMUL8.com | info@SIMUL8.com Scenario Results: Increasing Treatment Frequency Costs increase but infections reduce. Symptomatic patients reduce in years 4 and 5 0 50000000 100000000 150000000 200000000 250000000 1 2 3 4 5 Screening Costs Costs Supported ART Costs 0 50 100 150 200 250 1 2 3 4 5 New infection baseline New Infection Screening New infection Supported ART 0 500 1000 1500 2000 2500 1 2 3 4 5 Baseline HIV sympt Screening HIV Sympt Support ART HIV Sympt
  • 22.
    SIMUL8 Corporation |SIMUL8.com | info@SIMUL8.com What Resources are Required? 0 2000 4000 6000 8000 10000 12000 14000 16000 1 2 3 4 5 Baseline follow ups Sreening Follow ups Support ART Follow ups Follow ups increase in each scenario – with 100 weekly appointments wait times are unacceptable.
  • 23.
    SIMUL8 Corporation |SIMUL8.com | info@SIMUL8.com Resource requirements Increasing weekly appointments to 250 brings wait times in line with requirements
  • 24.
    SIMUL8 Corporation |SIMUL8.com | info@SIMUL8.com Case Study 2: Dementia
  • 25.
    SIMUL8 Corporation |SIMUL8.com | info@SIMUL8.com Results after multiple runs
  • 26.
    SIMUL8 Corporation |SIMUL8.com | info@SIMUL8.com Template Simulations What are the key features of any disease pathway? Share your thoughts via our survey monkey and we will report back.
  • 27.
    SIMUL8 Corporation |SIMUL8.com | info@SIMUL8.com Standard of Care Imagine a simulated pathway including: • Expected demand from population health predictions and disease progression • Evidence-based best clinical practice • Localizable to individual providers and populations Answering questions: • What if I implement best practice? • What will this look like in 3-5 years time? • What resources will I need? • How much will it cost/what income will I earn? • Will I have patients waiting if I don’t increase staffing? • What will patient outcomes be?
  • 28.
    SIMUL8 Corporation |SIMUL8.com | info@SIMUL8.com Share and Manage Pathways on the Web Have multiple user logins to access a suite of simulation models.
  • 29.
    SIMUL8 Corporation |SIMUL8.com | info@SIMUL8.com Create Simulation Suites Upload multiple models which user can run, change, SAVE and EXPORT results from. These users can also share these with others.
  • 30.
    SIMUL8 Corporation |SIMUL8.com | info@SIMUL8.com Manage Access Create localized simulations and assign them so that only specific users can view particular simulations.
  • 31.
    SIMUL8 Corporation |SIMUL8.com | info@SIMUL8.com Do Once and Share Our offer to you Help us build pathways we can share. Send us your pathway suggestions and we will choose one to build and share using our new technology Email to healthteam@simul8.com
  • 32.
    SIMUL8 Corporation |SIMUL8.com | info@SIMUL8.com QUESTIONS Please forward any topics you would like to see covered to claire.c@simul8.com Continue the discussion on SIMUL8 in Health – LinkedIn Group September Workshop – “Optimizing Outpatient Operations – Staffing & Scheduling”.