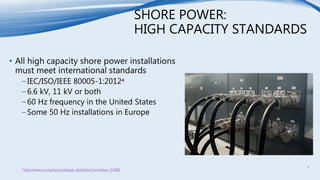
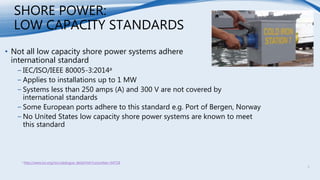
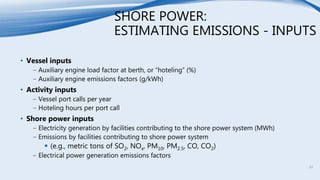
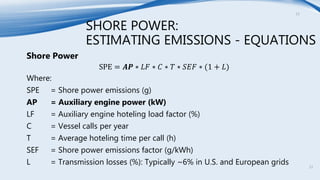
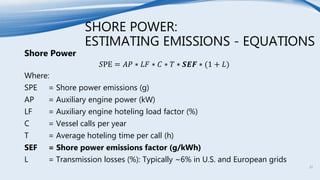
Shore power systems allow ocean-going vessels to plug into the local electricity grid while at berth to power auxiliary systems like lighting and air conditioning, rather than using onboard diesel engines. This reduces port emissions. There are two main types: high capacity for large vessels and low capacity for smaller ships. High capacity systems must meet international standards, while standards are less consistent for low capacity. Shore power installation costs can range from $1-12 million depending on the port. Estimating emissions reductions requires data on vessel size, calls, hoteling time, engine load factors, and grid emissions factors.
1. SHORE POWER IN THE
UNITED STATES
Richard Billings, ERG
Developed in Partnership with EERA
2. SHORE POWER:
OVERVIEW
• Ocean-going vessels plug in to the
local electricity grid and turn off
auxiliary engines while at-berth
2
• Auxiliary systems, such as lighting, air conditioning, and crew
berths are run using energy from the local grid
• Shore power can reduce diesel emissions in port communities
• Sometimes also referred to as Alternative Maritime Power (AMP),
Onshore Power Supply (OPS), or Cold Ironing
3. SHORE POWER:
TYPES OF SYSTEMS
• Two main categories
−High Capacity
Typically service large cruise, container, and refrigerated
vessels
> 6.6 kilovolts (kV)
~10 high capacity systems in the United States (~2 in
Canada)
−Low Capacity
Typically service smaller vessels such as fishing fleets and
tugs
Most in United States are 220 – 480 volts (V)
~6 low capacity systems in the United States
3
4. SHORE POWER:
HIGH CAPACITY STANDARDS
• All high capacity shore power installations
must meet international standards
−IEC/ISO/IEEE 80005-1:2012a
−6.6 kV, 11 kV or both
−60 Hz frequency in the United States
−Some 50 Hz installations in Europe
a http://www.iso.org/iso/catalogue_detail.htm?csnumber=53588
4
5. SHORE POWER:
LOW CAPACITY STANDARDS
• Not all low capacity shore power systems adhere to an
international standard
−IEC/ISO/IEEE 80005-3:2014a
−Applies to installations up to 1 MW
−Systems less than 250 amps (A) and 300 V are not covered by
international standards
−Some European ports adhere to this standard e.g. Port of Bergen, Norway
−No United States low capacity shore power systems are known to meet
this standard
a http://www.iso.org/iso/catalogue_detail.htm?csnumber=64718
5
7. SHORE POWER:
TYPES OF SYSTEMS
Dock Mounted Containerized Barge Mounted
Dock mounted shore power
connection Long Beach, California
http://www.cochranmarine.com/installations/long-beach/
Container installation on board vessel
http://www.sam-
electronics.de/fileadmin/user_upload/Broschueren_PDF_Dateien_Energie___Antriebe/DS_1.090
.11_2015.pdf
Hummel LNG Barge, Hamburg, Germany
http://www.ship-technology.com/projects/hummel-lng-hybrid-barge/hummel-
lng-hybrid-barge3.html
7
8. SHORE POWER:
INSTALLATION COSTS
• Example: Brooklyn Cruise Terminal
− $12.1 million from Port Authority of New York and New Jersey
− $2.9 million grant from U.S. Environmental Protection Agency
− $4.3 million from Empire State Development Corporation
• Example: Juneau, Alaska
− Princess Cruises spent approximately $5.5 million
Improvements to the dockside infrastructure
5 Vessel retrofits: ~ $500,000 each
• Shore power installations in the United States are often assisted by grants
− Typically $1 million – $2 million, but some are higher
Federal: e.g. Diesel Emissions Reduction Act (DERA)a
State: e.g. Carl Moyer Program (California)b
a https://www.epa.gov/cleandiesel
b http://www.baaqmd.gov/grant-funding/funding-sources/carl-moyer-program
8
9. SHORE POWER:
ELECTRICITY COSTS
• Electricity costs can vary widely from port to port and between terminals within
ports
Examples
• Brooklyn: $0.12/kWh
− Total delivery cost = $0.26/kWh, New York City Economic Development Corporation
covers the difference so cruise operator pays $0.12/kWh
• Port of Oakland: $267/hr
• Juneau: $4000-$5000/day
− ~$0.03-0.04/kWh for 11,000 kW auxiliary berthed for 12 hours
9
10. SHORE POWER:
ESTIMATING EMISSIONS - INPUTS
• Vessel inputs
− Auxiliary engine load factor at berth, or “hoteling” (%)
− Auxiliary engine emissions factors (g/kWh)
• Activity inputs
− Vessel port calls per year
− Hoteling hours per port call
• Shore power inputs
− Electricity generation by facilities contributing to the shore power system (MWh)
− Emissions by facilities contributing to shore power system
(e.g., metric tons of SO2, NOx, PM10, PM2.5, CO, CO2)
− Electrical power generation emissions factors
10
11. SHORE POWER:
ESTIMATING EMISSIONS - EQUATIONS
Vessel Power
VE = 𝐴𝑃 ∗ 𝐿𝐹 ∗ 𝐶 ∗ 𝑇 ∗ 𝑉𝐸𝐹
Where:
VE = Vessel emissions (g)
AP = Auxiliary engine power (kW)
LF = Auxiliary engine hoteling load factor (%)
C = Vessel calls per year
T = Average hoteling time per call (h)
VEF = Vessel emissions factor (g/kWh)
11
12. SHORE POWER:
ESTIMATING EMISSIONS - EQUATIONS
Shore Power
SPE = 𝐴𝑃 ∗ 𝐿𝐹 ∗ 𝐶 ∗ 𝑇 ∗ 𝑆𝐸𝐹 ∗ (1 + 𝐿)
Where:
SPE = Shore power emissions (g)
AP = Auxiliary engine power (kW)
LF = Auxiliary engine hoteling load factor (%)
C = Vessel calls per year
T = Average hoteling time per call (h)
SEF = Shore power emissions factor (g/kWh)
L = Transmission losses (%): Typically ~6% in U.S. and European grids
12
13. SHORE POWER:
ESTIMATING EMISSIONS - EQUATIONS
Shore Power
SPE = 𝑨𝑷 ∗ 𝐿𝐹 ∗ 𝐶 ∗ 𝑇 ∗ 𝑆𝐸𝐹 ∗ (1 + 𝐿)
Where:
SPE = Shore power emissions (g)
AP = Auxiliary engine power (kW)
LF = Auxiliary engine hoteling load factor (%)
C = Vessel calls per year
T = Average hoteling time per call (h)
SEF = Shore power emissions factor (g/kWh)
L = Transmission losses (%): Typically ~6% in U.S. and European grids
13
13
14. SHORE POWER:
AUXILIARY POWER• Shore power replaces on-board auxiliary engines
• Auxiliary engine size can vary greatly by vessel size and class
Aux. engine load
(kW)
Aux. engine load
(kW)
Ship class Capacity At berth Ship class Capacity At berth
Bulk carrier 0–9,999 280 General cargo 0–4,999 120
10,000–34,999 280 5,000–9,999 330
35,000–59,999 370 10,000–+ 970
60,000–99,999 600 Container 0–999 340
100,000–199,999 600 1,000–1,999 600
200,000–+ 600 2,000–2,999 700
Chemical tanker 0–4,999 160 3,000–4,999 940
5,000–9,999 490 5,000–7,999 970
10,000–19,999 490 8,000–11,999 1,000
20,000–+ 1,170 12,000–14,500 1,200
Oil tanker 0–4,999 250 14,500–+ 1,320
5,000–9,999 375 Liquefied gas tanker 0–49,999 240
10,000–19,999 625 50,000–199,999 1,710
20,000–59,999 750 200,000–+ 1,710
60,000–79,999 750 Refrigerated bulk 0–1,999 1,080
80,000–119,999 1,000 Cruise 0–1,999 450
120,000–199,999 1,250 2,000–9,999 450
200,000–+ 1,500 10,000–59,999 3,500
Ro-ro 0–4,999 800 60,000–99,999 11,480
5,000–+ 1,200 100,000–+ 11,480
Adapted from the Third IMO Greenhouse Gas Report.
http://www.imo.org/en/OurWork/Environment/PollutionPrevention/AirPollution/Documents/Third%20Greenhouse%20Gas%20Study/GHG3%20Executive%20Summary%20and%20Report.pdf
14
18. SHORE POWER:
ESTIMATING EMISSIONS - EQUATIONS
Shore Power
𝑆PE = 𝐴𝑃 ∗ 𝐿𝐹 ∗ 𝐶 ∗ 𝑻 ∗ 𝑆𝐸𝐹 ∗ (1 + 𝐿)
Where:
SPE = Shore power emissions (g)
AP = Auxiliary engine power (kW)
LF = Auxiliary engine hoteling load factor (%)
C = Vessel calls per year
T = Average hoteling time per call (h)
SEF = Shore power emissions factor (g/kWh)
L = Transmission losses (%): Typically ~6% in U.S. and European grids
18
19. SHORE POWER:
HOTELING TIME PER CALL (T)
• Frequent callers, with longer berth times more likely to benefit financially from shore
power
− Studies indicate shore power is most cost-effective when hoteling hours are
1.8 million kWh/yr or morea
a http://www.polb.com/civica/filebank/blobdload.asp?BlobID=7718
Hours per Visit
Vessel Type POLB NY/NJ Seattle/Tacoma POLA
Container 68 26 31 48
Tanker 35 29 21 39
General Cargo 31 14 41 53
RORO 12 12 16 17
Cruise 12 10 10 10
Reefer - 8 - 27
Dry Bulk 54 35 89 70
19
20. SHORE POWER:
ESTIMATING EMISSIONS - EQUATIONS
Shore Power
𝑆PE = 𝐴𝑃 ∗ 𝐿𝐹 ∗ 𝐶 ∗ 𝑇 ∗ 𝑺𝑬𝑭 ∗ (1 + 𝐿)
Where:
SPE = Shore power emissions (g)
AP = Auxiliary engine power (kW)
LF = Auxiliary engine hoteling load factor (%)
C = Vessel calls per year
T = Average hoteling time per call (h)
SEF = Shore power emissions factor (g/kWh)
L = Transmission losses (%): Typically ~6% in U.S. and European grids
20
22. SHORE POWER:
EMISSION BENEFITS
Tons/yr 2,000 Passenger 3,500 Passenger
Shore Power Vessel Power Shore Power Vessel Power
CO 0.16 5.06 0.24 7.58
NOx 0.80 63.9 1.20 95.8
PM10 0.48 1.15 0.72 1.72
PM2.5 0.30 1.06 0.46 1.58
SO2 1.36 1.95 2.04 2.92
CO2 2,033 3,171 3,049 4,755
Corbett, J. J., & Comer, B. (2013). Clearing the air: Would shoreside power reduce air pollution emissions from cruise ships calling on the Port of Charleston, SC? Pittsford, NY: Energy
and Environmental Research Associates. Retrieved from http://coastalconservationleague.org/wp-content/uploads/2010/01/EERA-Charleston-Shoreside-Power-Report-.pdf
22
24. SHORE POWER EXPERIENCES:
CALIFORNIA
• At berth Regulationa requires the use of shore power
(or equivalent reduction) by Cruise, Container, and
Refrigerated vessels
• ~23 Terminals
• ~63 Berths
• 2,750 out of 4,400 (62.5%) of calls in 2014 were
expected shore power calls
− Challenges
Shore power berth availability
Vessel commissioning for shore power use
Shore power connection times
Shore power installation delays
a https://www.arb.ca.gov/ports/shorepower/shorepower.htm
https://www.portoflosangeles.org/environment/amp.asp 24
25. SHORE POWER EXPERIENCES:
U.S. NAVY
• Incentivized Shipboard Energy Conservation (iENCON)a
• Naval vessels have used shore power, where available, for decades
a http://www.i-encon.com/PDF_FILES/ssem_handbook/SSEM_Handbook.pdf
− Lower electrical power demand at berth than
commercial vessels
− Longer berthing periods than commercial vessels
Weeks to months vs. 1 to 3 days
− Shore power is cost-effective from a fuel
consumption standpoint
Additional costs of shore power installation
are offset by the difference in cost between
electricity and marine fuels while at berth
https://www.navy.com/about/equipment/vessels/cruisers.html
25
26. SHORE POWER:
TECHNOLOGY AND ALTERNATIVES
• Advanced Maritime Emission Control (AMEC) systems
− Barge mounted apparatus affixed over the vessel stack at berth to scrub exhaust gases
• Exhaust Gas Cleaning Systems (EGCS)
− Also referred to as scrubbers
− Permanently installed equipment also used to comply with ECA sulfur limits
• Hydrogen Fuel Cell Shore Power System
− Prototype in use at Port of Honolulu, Hawaii
• Liquefied Natural Gas
− LNG shore power barge in use at Port of Hamburg, Germany
− Current and future LNG-powered vessels may negate the need for shore power for those
vessels
26
27. SUMMARY
• Shore power becomes most economically attractive when bunker fuel costs are high
relative to electricity costs
• Relatively new technology, but shore power has been effectively employed by the
State of California, the U.S. Navy, and a range of individual ports
• Air emissions reductions can be significant, depending on regional electricity grids
− NOX: up to 99%
− SO2: ~31%
− CO2: ~36%
− PM10: ~58%
27
Editor's Notes
Slides are all presented on white background to allow for ERG themes/formatting if desired. Otherwise a plain white background works with most systems regardless of lighting/contrast in the room
Notes accompanying each slide give guidelines for how the presentation flows
A brief overview of shore power, describing how the system works.
Simplified, ocean going vessels plug in to the local electricity grid while at berth, enabling them to turn off auxiliary engines and reduce emissions from the vessel while in port. This is beneficial because ports are often located close to population centers, where emissions can harm human health
Vessel auxiliary systems that can be run via shore power include lighting, air conditions, and crew berths. Due to different vessel spec. the electrical loads of these operations can vary greatly
Point to alternate names for shore power
Describe the two main types of shore power system, High Capacity and Low Capacity
Highlight which types of vessels each system serves and the differences between them
Now more detail on each
First, high capacity systems
Note universal compliance with IEC/ISO/IEEE 80005-1:2014 standard
6.6, 11kV, or both
And frequency differences between European and US grids, which can be either 50 of 60 Hz power. This can be a challenge for a global fleet, but many shore power systems are able to convert between the two frequencies
Now, low capacity systems
Highlight that there is a standard for low voltage systems, IEC/ISO/IEEE 80005-3:2014, that applies to systems up to 1MW of capacity. Smaller systems do not adhere to this standard, especially in the US, and so the result is a mix of low power systems and standards for fishing fleets and tugs
For the remainder of the talk, we focus on High Capacity systems
Map highlights shore power installations in the US
Green shows high voltage installations. Draw focus to California, where the majority of installations are, and Seattle/Tacoma.
- Not only one east coast high capacity shore power installation at Brooklyn cruise terminal
- If desired, speak to the capacities of these systems
Blue shows low capacity systems
Hybrid battery/diesel tugs in LA/Long Beach – Campbell Foss and Carolyn Dorothy, FOSS Marine vessels
Fishing fleets in Seattle, New Bedford, Boston
Standard tugs in Baltimore and Philadelphia
Also note shore power installations not shown on map
Vancouver, BC
Halifax, NS
Shore power systems can be deployed in three main ways
Dock mounted, as shown here in Long Beach, California
Container installation
barge – in this case an LNG barge, pulls alongside offering shore power plug
All three require significant modifications to the electrical system of the vessel in order to receive the shore power connection
Highlight two case studies on installation costs
Both examples are dock-mounted as far as I know
Mention the proliferation of grants to support shore power development. Shore power adoption is not something that has happened organically, or driven by market factors, but that has been facilitated by grants to assist development
Brief overview of different electricity costs
Challenges as costs are not standardised, operators and terminals frequently develop their own tariff schemes
Briefly cover these three to give an idea of what vessels pay for electricity on top of installation costs
Brooklyn example for a 11,000kW auxiliary engine on a cruise vessel, would result in ~$16,000 for a 12 hour berth
As mentioned earlier, one of the major benefits of shore power is emissions reductions
List the inputs needed
Vessel inputs can be obtained from Lloyd’s when available, but also estimated, as follows
Activity inputs ideally obtained from port entrances and clearances, but can be generalised/estimated as follows
For shore power inputs, the first two bullets combine to give the electrical power generation emissions factors
Walk through the equation. Note that this is a simplified version, which can be adapted to include multiple vessels of different classes.
Next few sections cover different aspects of the inputs
Note that this equation is very similar, with the exception of different emission factors for shore power generation facilities/grids and includes L, local grid transmission losses
Focusing on Aux. Power
Explain that these are generalized for the global fleet, as reported in the Third IMO Greenhouse Gas study.
Areas will be subsequently highlighted, but this table shows fleet and class aux. power can be approximated for a variety of vessel types and classes when Lloyd’s or vessel-specific data are unavailable
Highlighting cruise as having the largest aux. power loads
Followed by reefers
And then containers.
This is important because engine load is a major input and determining factor of shore power emissions
Focus on average hoteling time
Table shows average berthing times for 4 major US ports
Highlight differences between different vessel types, longest vs. shortest
Again, ideally this would be derived from port information, but in the absence it can be approximated as such
Mention that longer hoteling times may be economically beneficial for shore power as offsetting initial CAPEX with lower at-berth energy costs compared to bunker fuels
Focus on emission factors
Highlight differences between the two tables, esp. re criteria pollutants
NOx
SOx
CO2
Highlight differences between eGRID regions in the lower table
Emission factors strongly dependent on the regional electricity generation grid mix
More renewables/nuclear lower emissions rates not constant among regions
Which results in the following benefits in terms of emission reductions
Mention that this is for a cruise vessel at Port of Charleston
Highlight percent reductions
NOx: ~99%
SOx: ~30%
PM10: ~58%
CO2: ~36%
Describe California experience w. At-Berth Regulation, approved in 2007 to reduce at-berth emissions associated with high sulfur fuels at California ports
23 terminals, 63 berths at the Ports of Los Angeles, Long Beach, Oakland, San Diego, San Francisco, and Hueneme.
Good rate of compliance, but describe some of the challenges faced by ports and vessels, primarily lack of availability of shore power berths and commissioning challenges
US Navy has used shore power for a while.
Represent a different case to commercial vessels as their vessels can be berthed for weeks to months, as opposed to commercial vessels which berth only during loading and unloading, typically for less, or much less, than 3 days
Alternatives to shore power, as mentioned in the At-Berth regulation section
Can use sniffers and scrubbers to reduce emissions from vessels operating using high sulfur fuels
Hydrogen fuel cells are in the prototype stages to produce a near-zero emissions alternative to LNG barges and traditional shore power
LNG: shifts in the industry toward LNG adoption may negate the need for shore power for those vessels as their emissions are typically equivalent to, or cleaner than, local electricity grids in terms of criteria pollutants