Downloaded 101 times


![Figure 1. (Zoom in for details.) Aging a 400x400 face with Deep Feature Interpolation, before and after the artifact removal step,
showcasing the quality of our method. In this figure (and no other) a mask was applied to preserve the background. Although the input
image was 400x400, all source and target images used in the transformation were only 100x100.
olderinput mouth open eyes open smiling facial hair spectacles
Figure 2. (Zoom in for details.) An example Deep Feature Interpolation transformation of a test image (Silvio Berlusconi, left) towards six
categories. Each transformation was performed via linear interpolation in deep feature space composed of pre-trained VGG features.
images. It also requires that sample images with and without
the desired attribute are otherwise similar to the target image
(e.g. in the case of Figure 1 they consist of images of other
caucasian males).
age transformations. Works by Reed et al. [29, 30] propose
content change models for challenging tasks (identity and
viewpoint changes) but do not demonstrate photo-realistic
results. A contemporaneous work [4] edits image content by](https://image.slidesharecdn.com/deeplearningreinforcementlearning-170217114831/75/Deep-Learning-and-Reinforcement-Learning-31-2048.jpg)


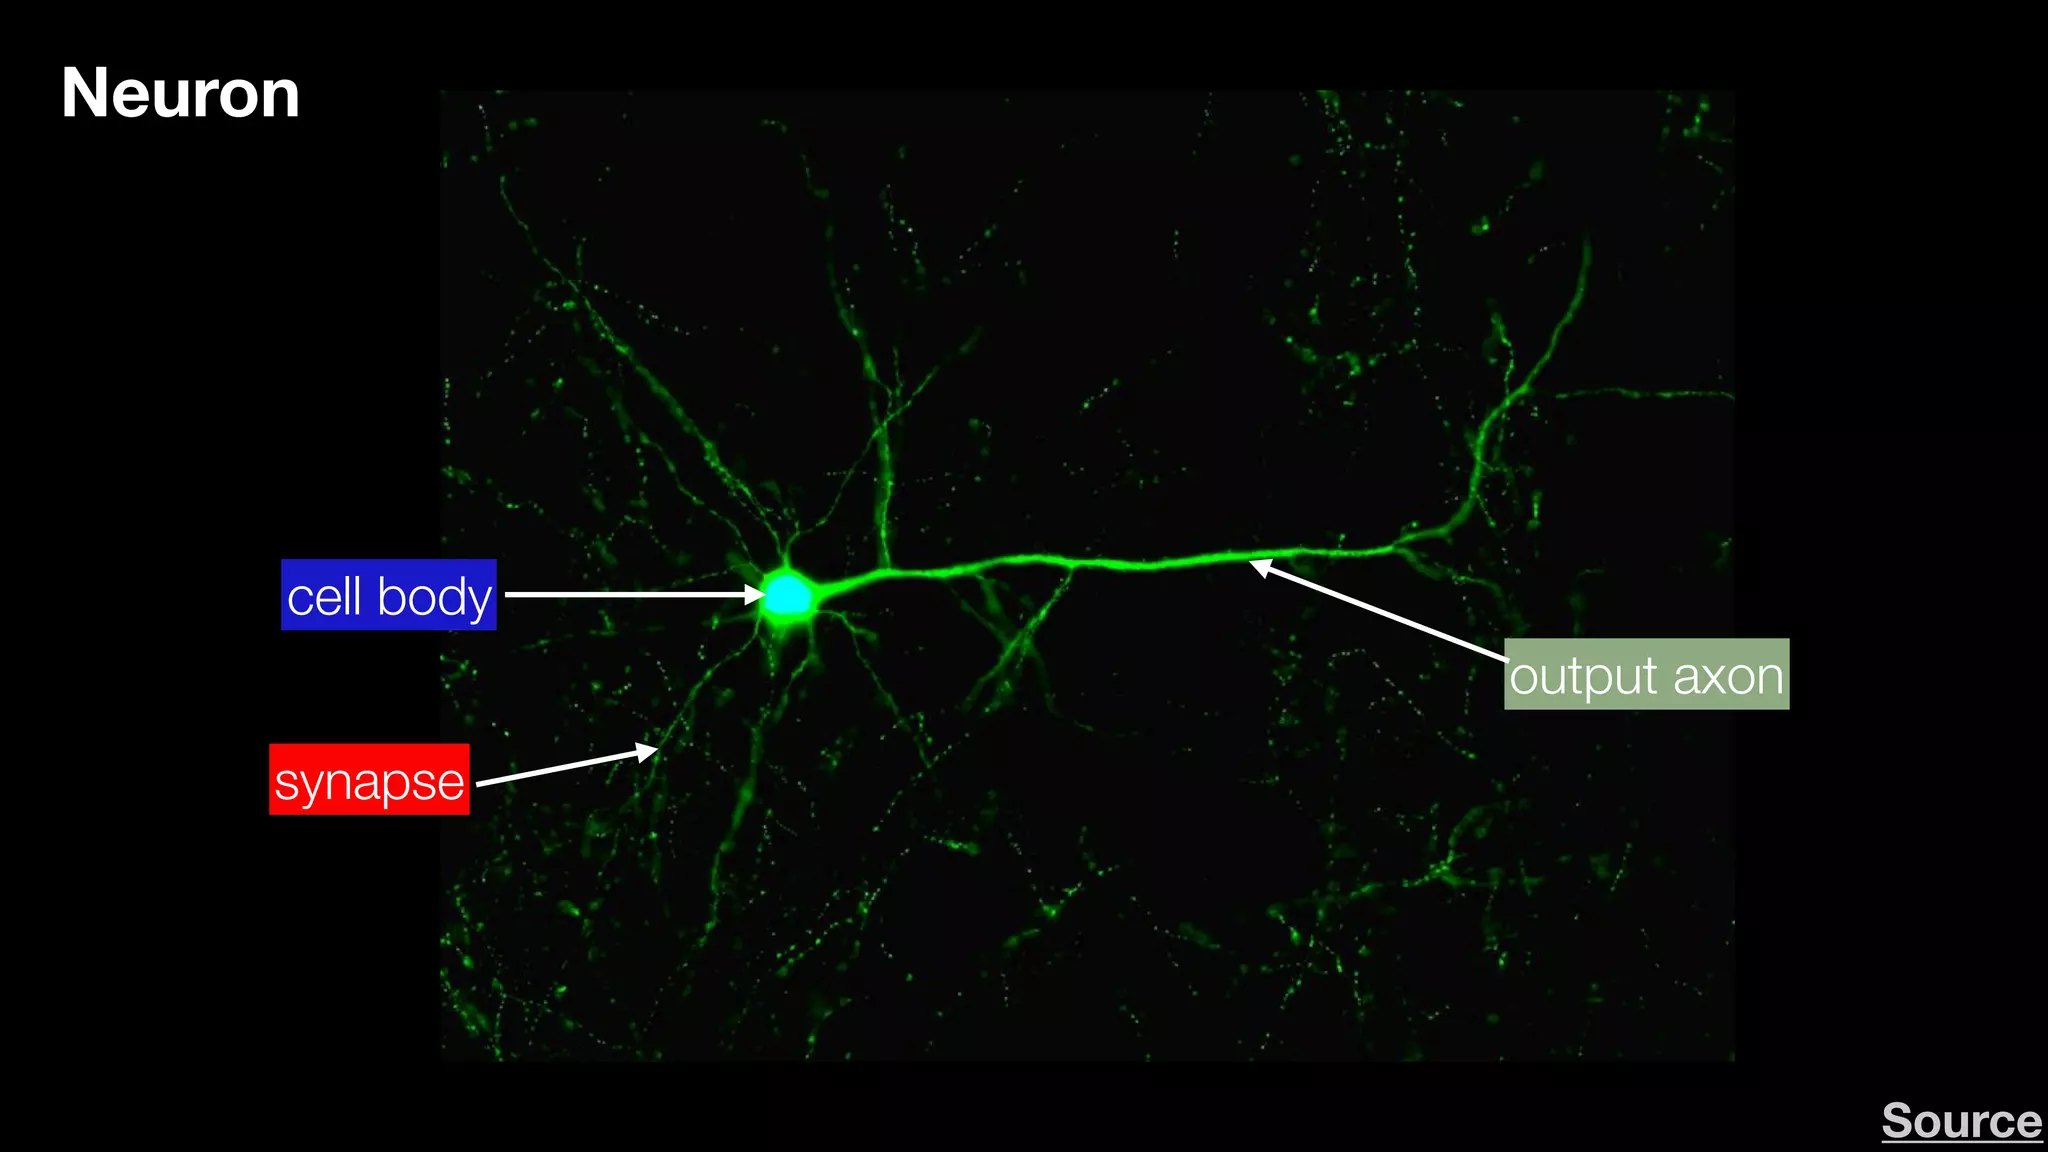
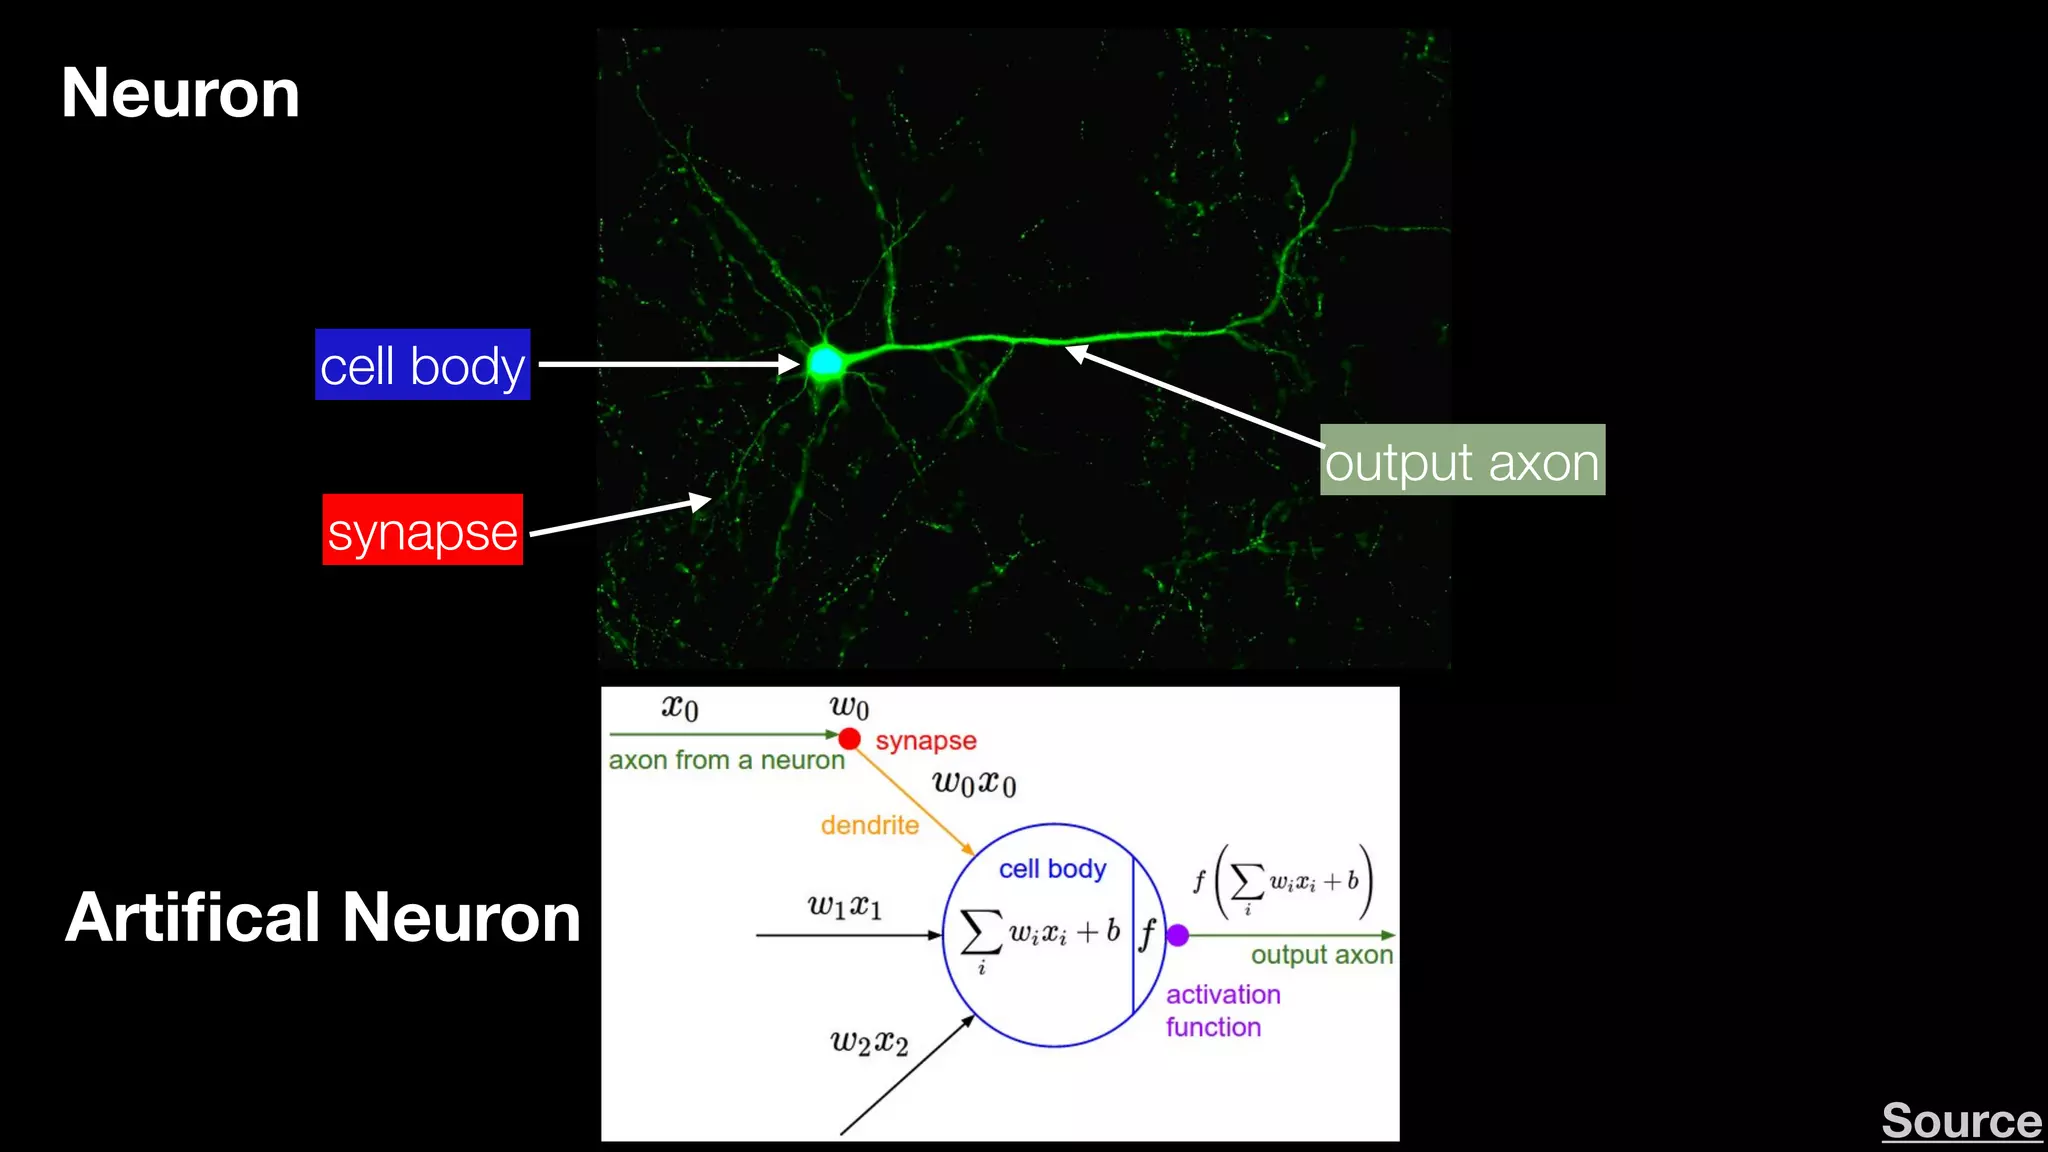
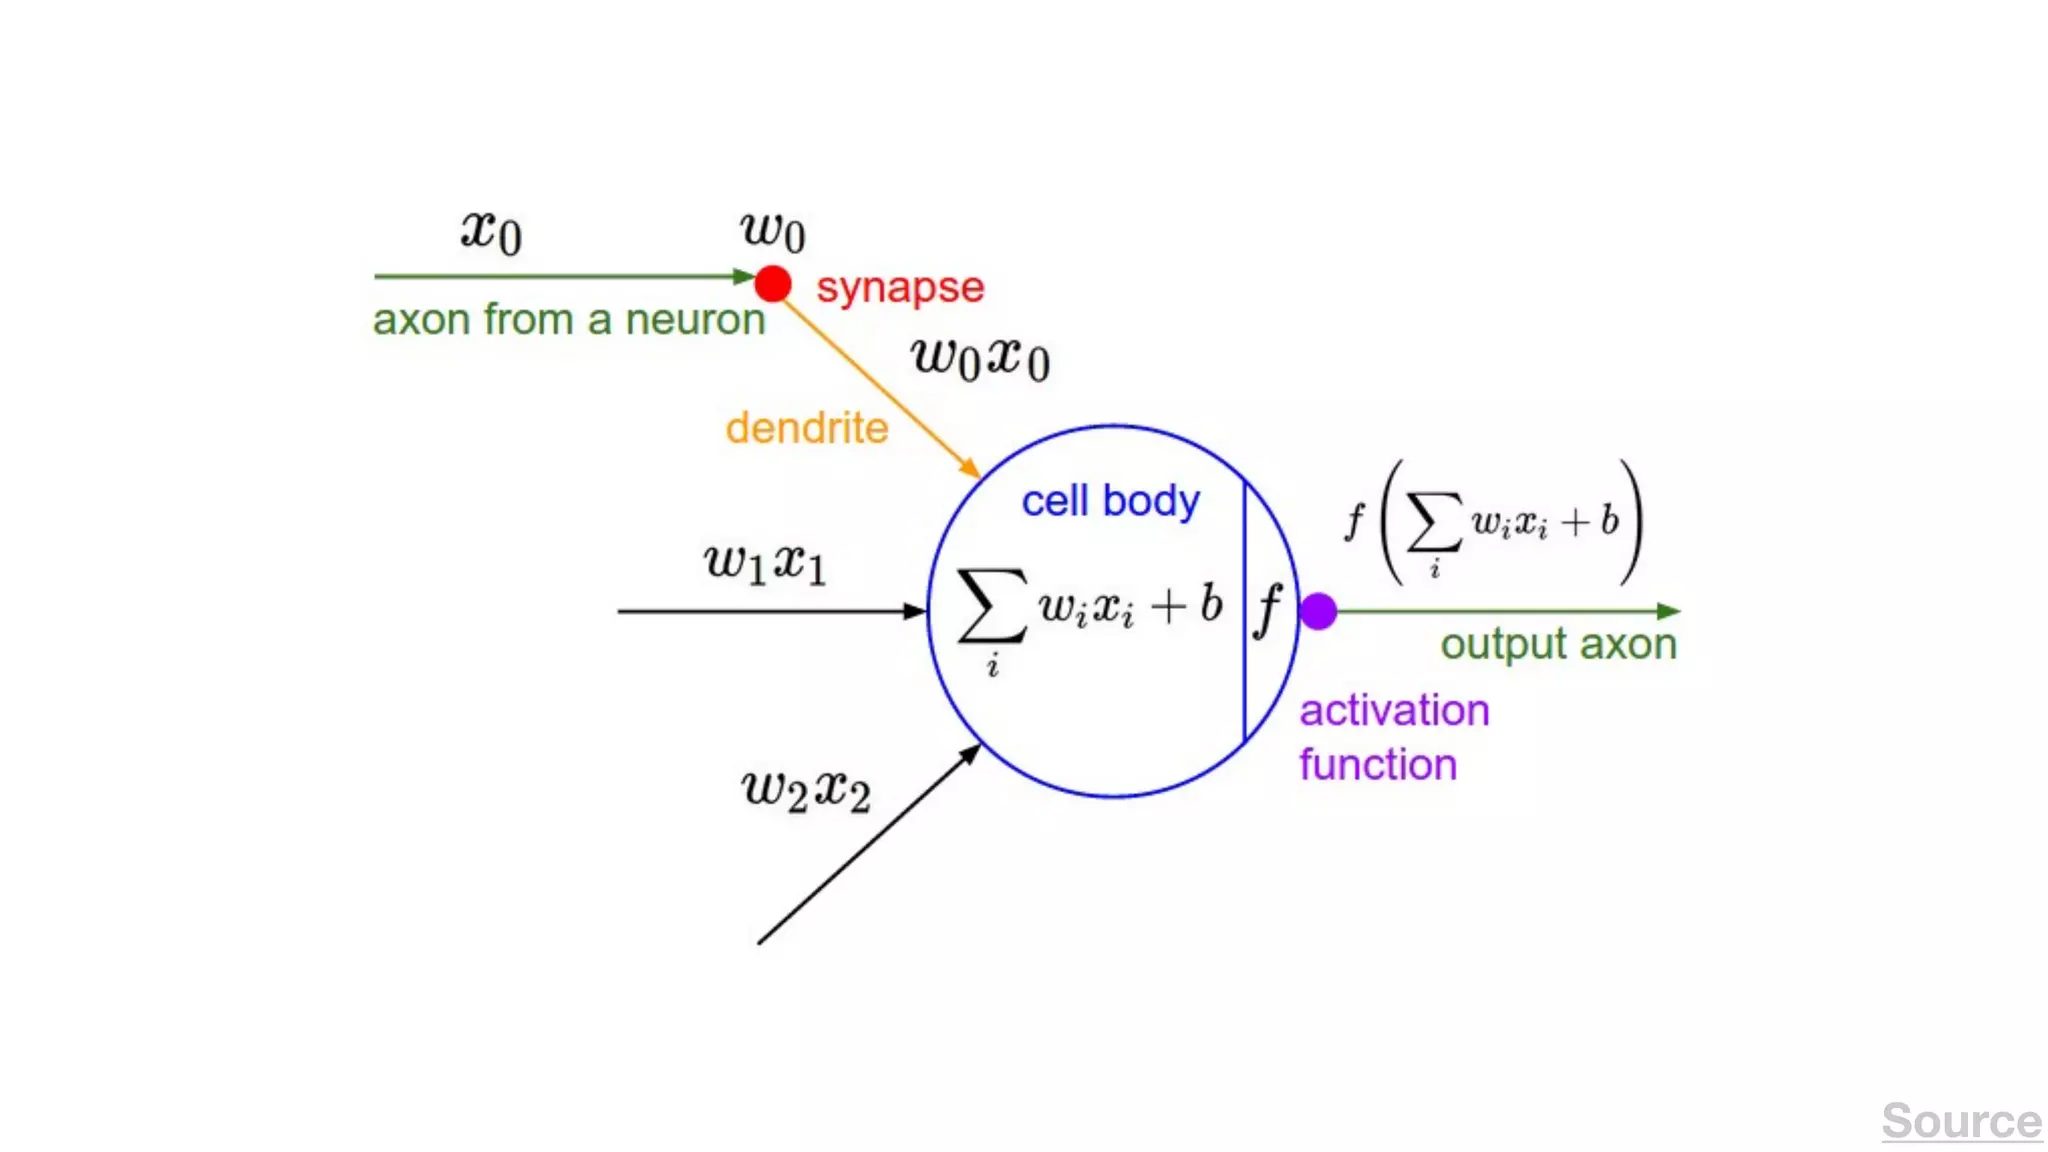
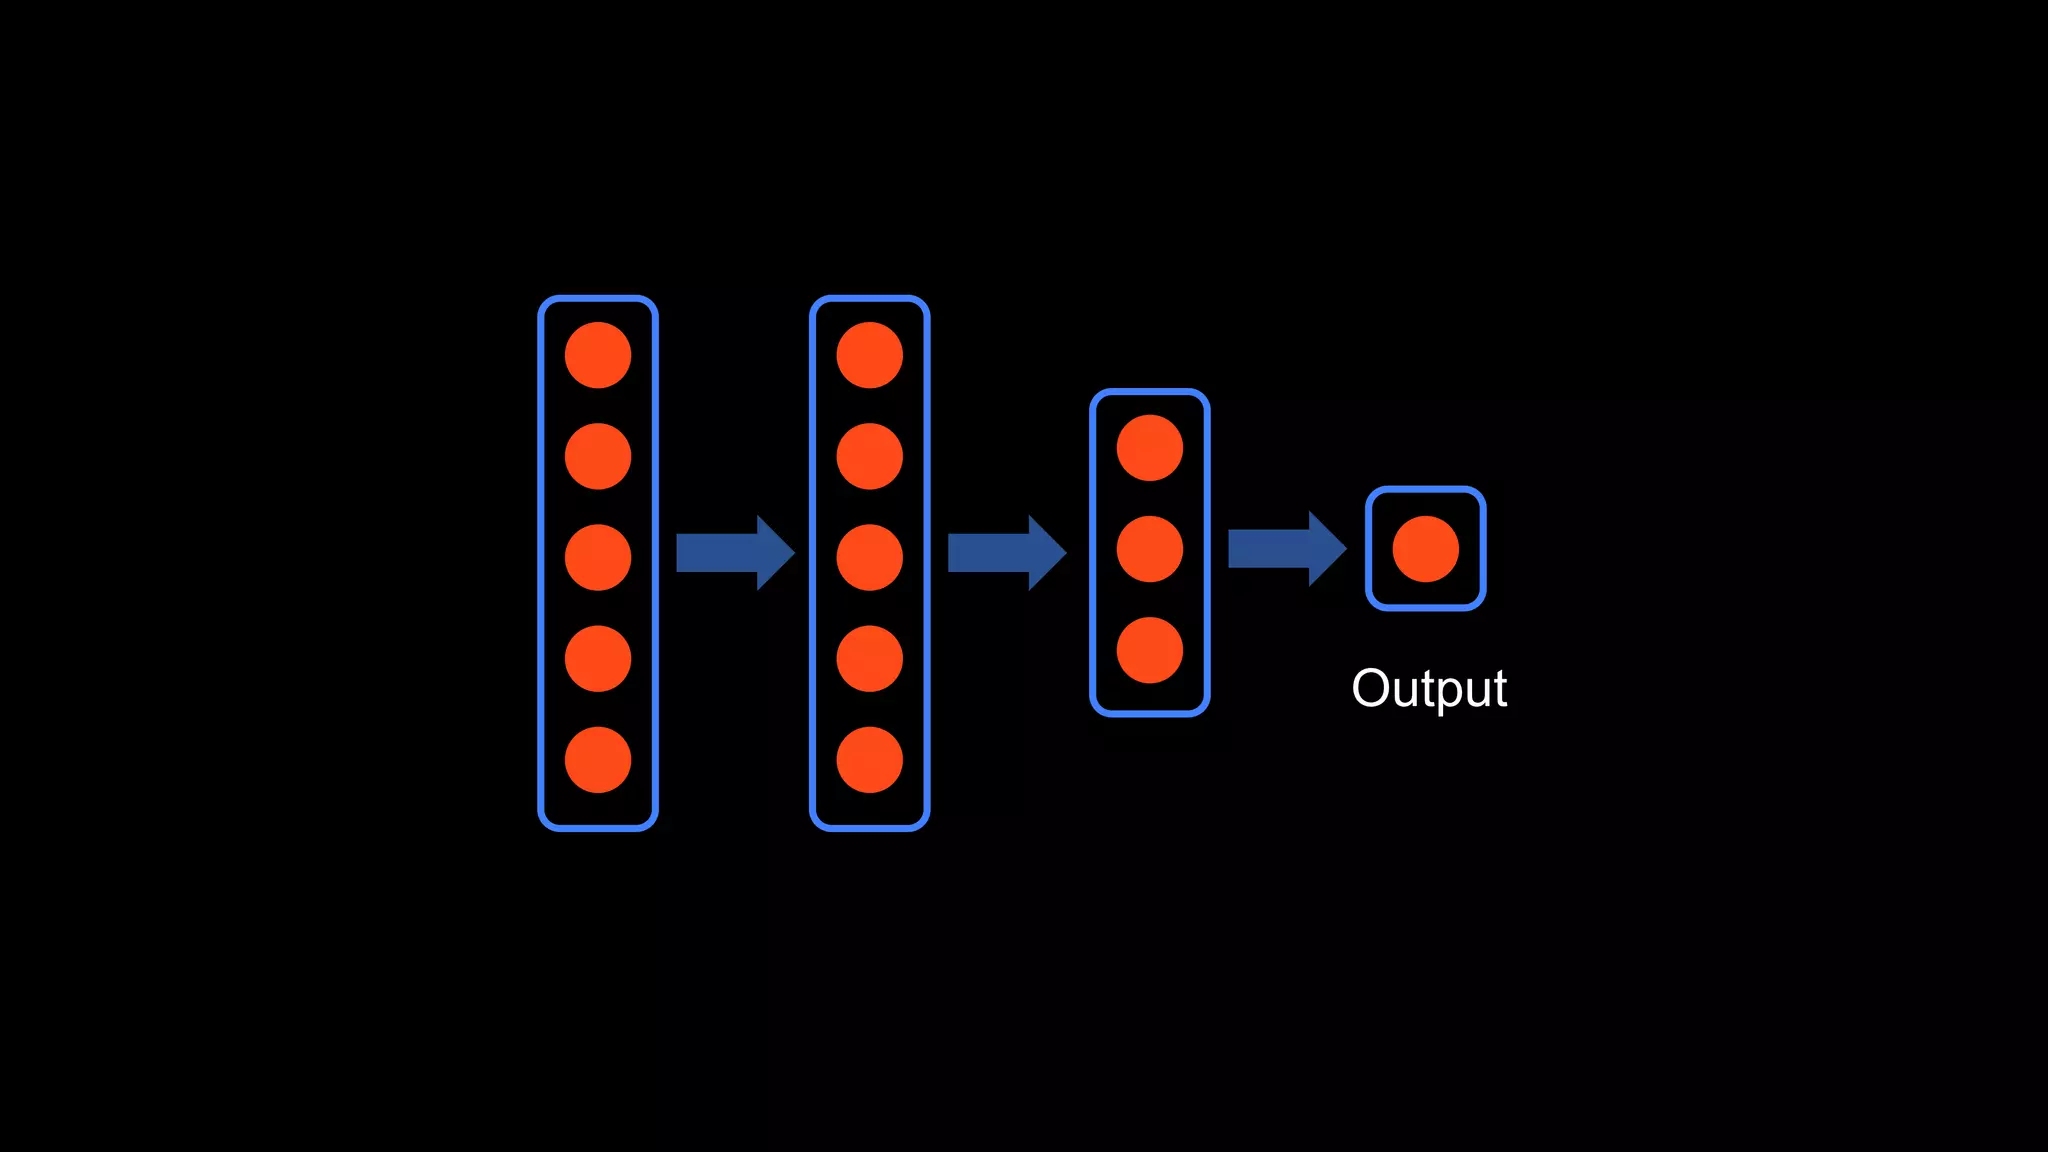
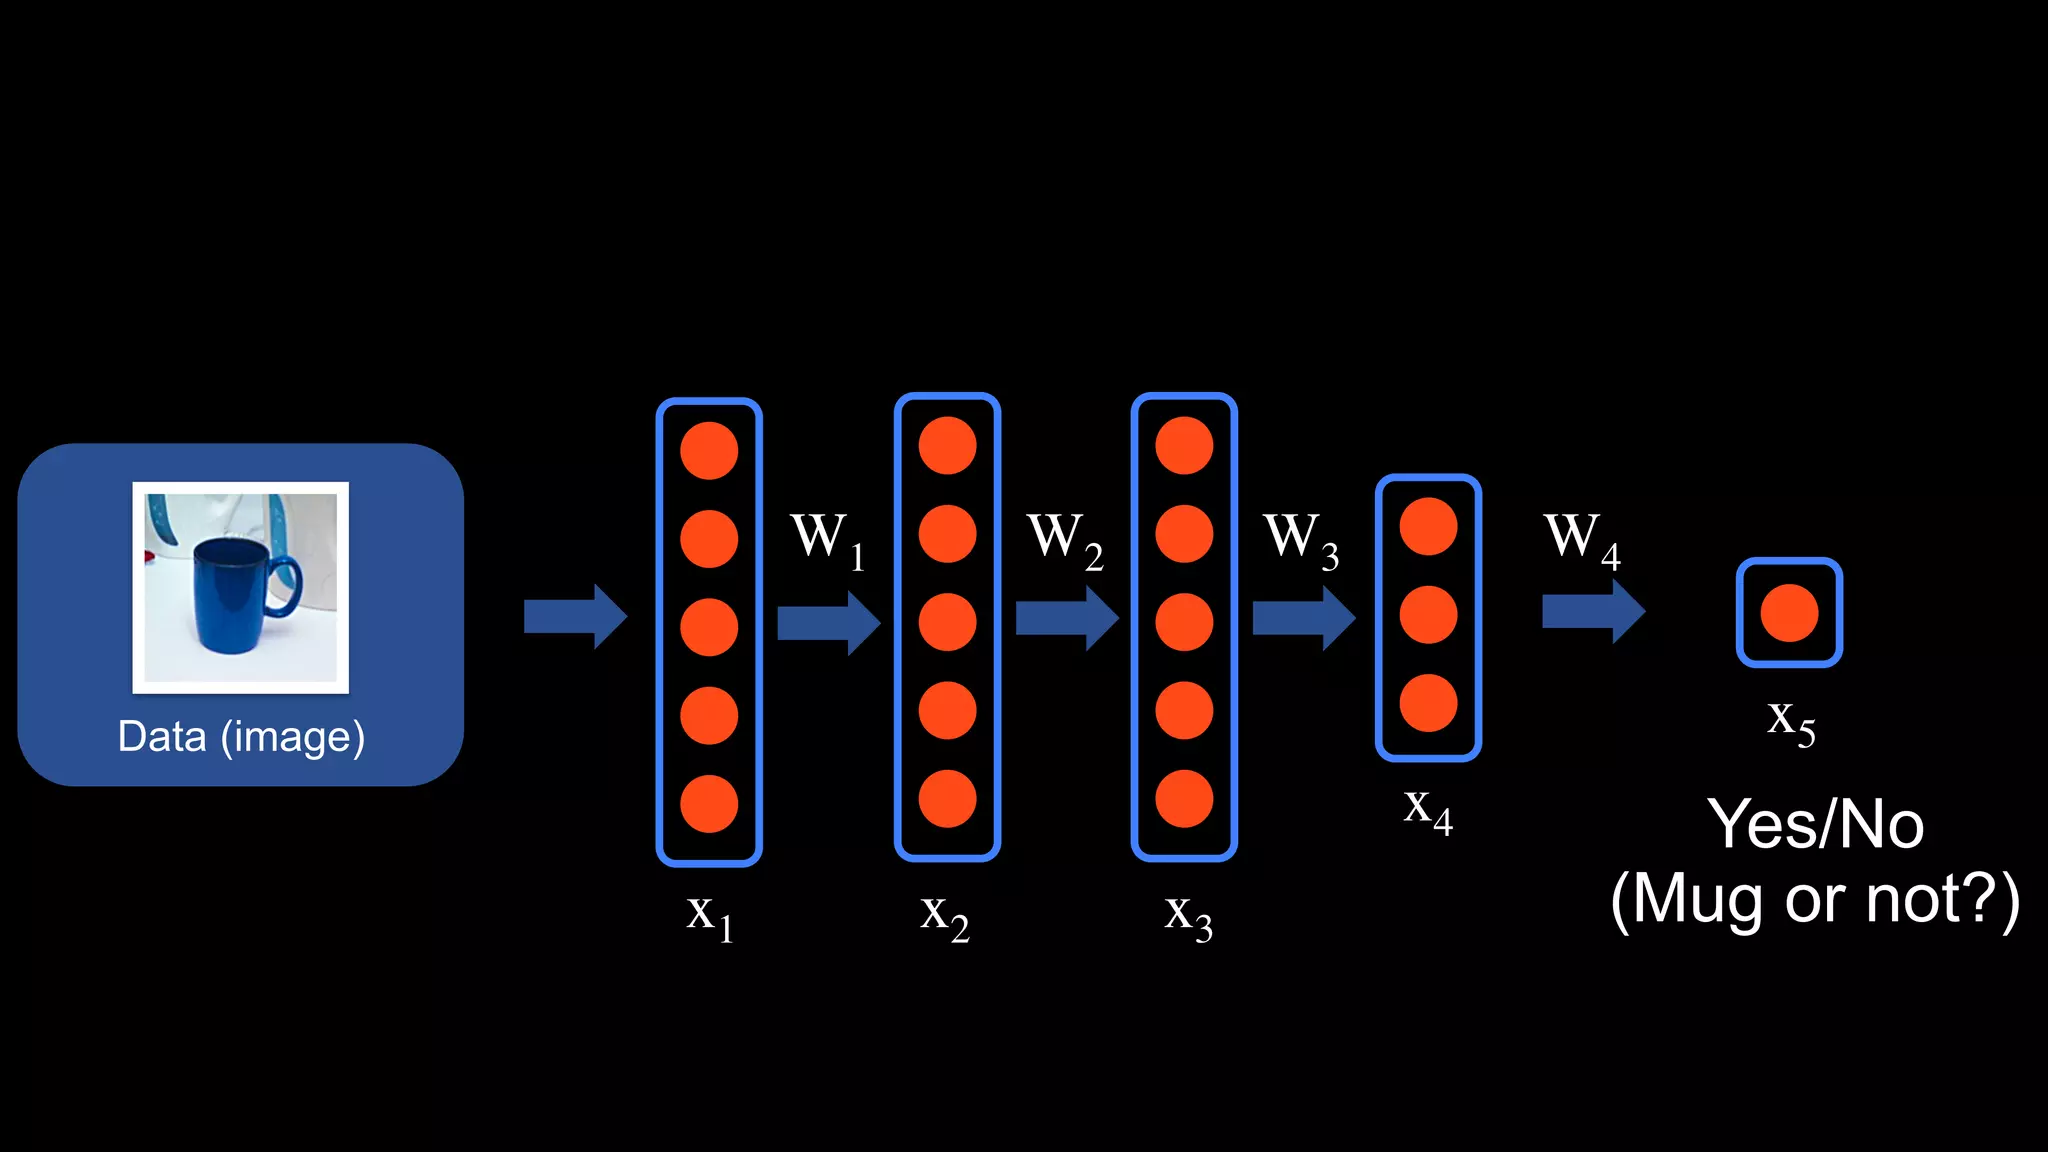
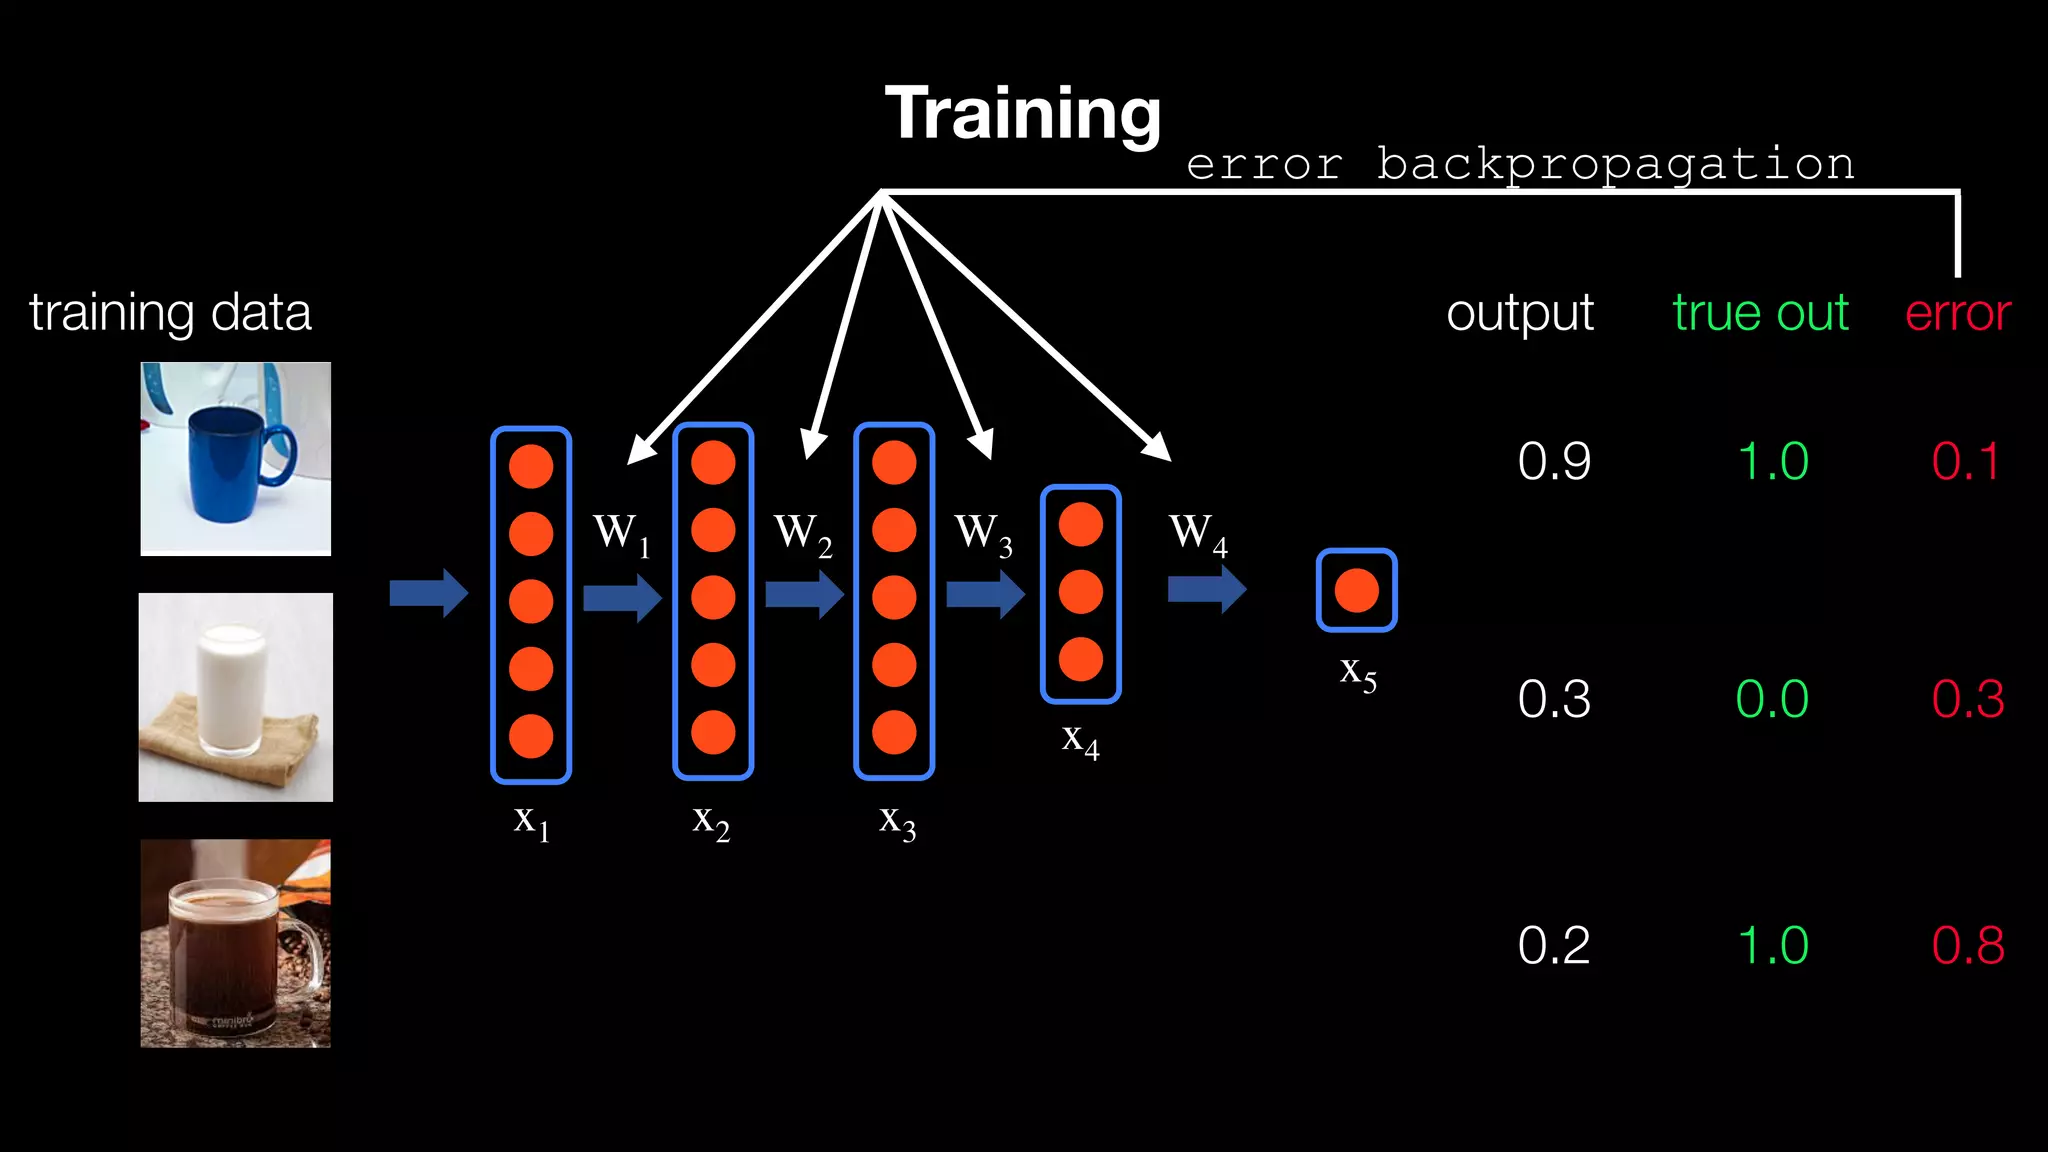


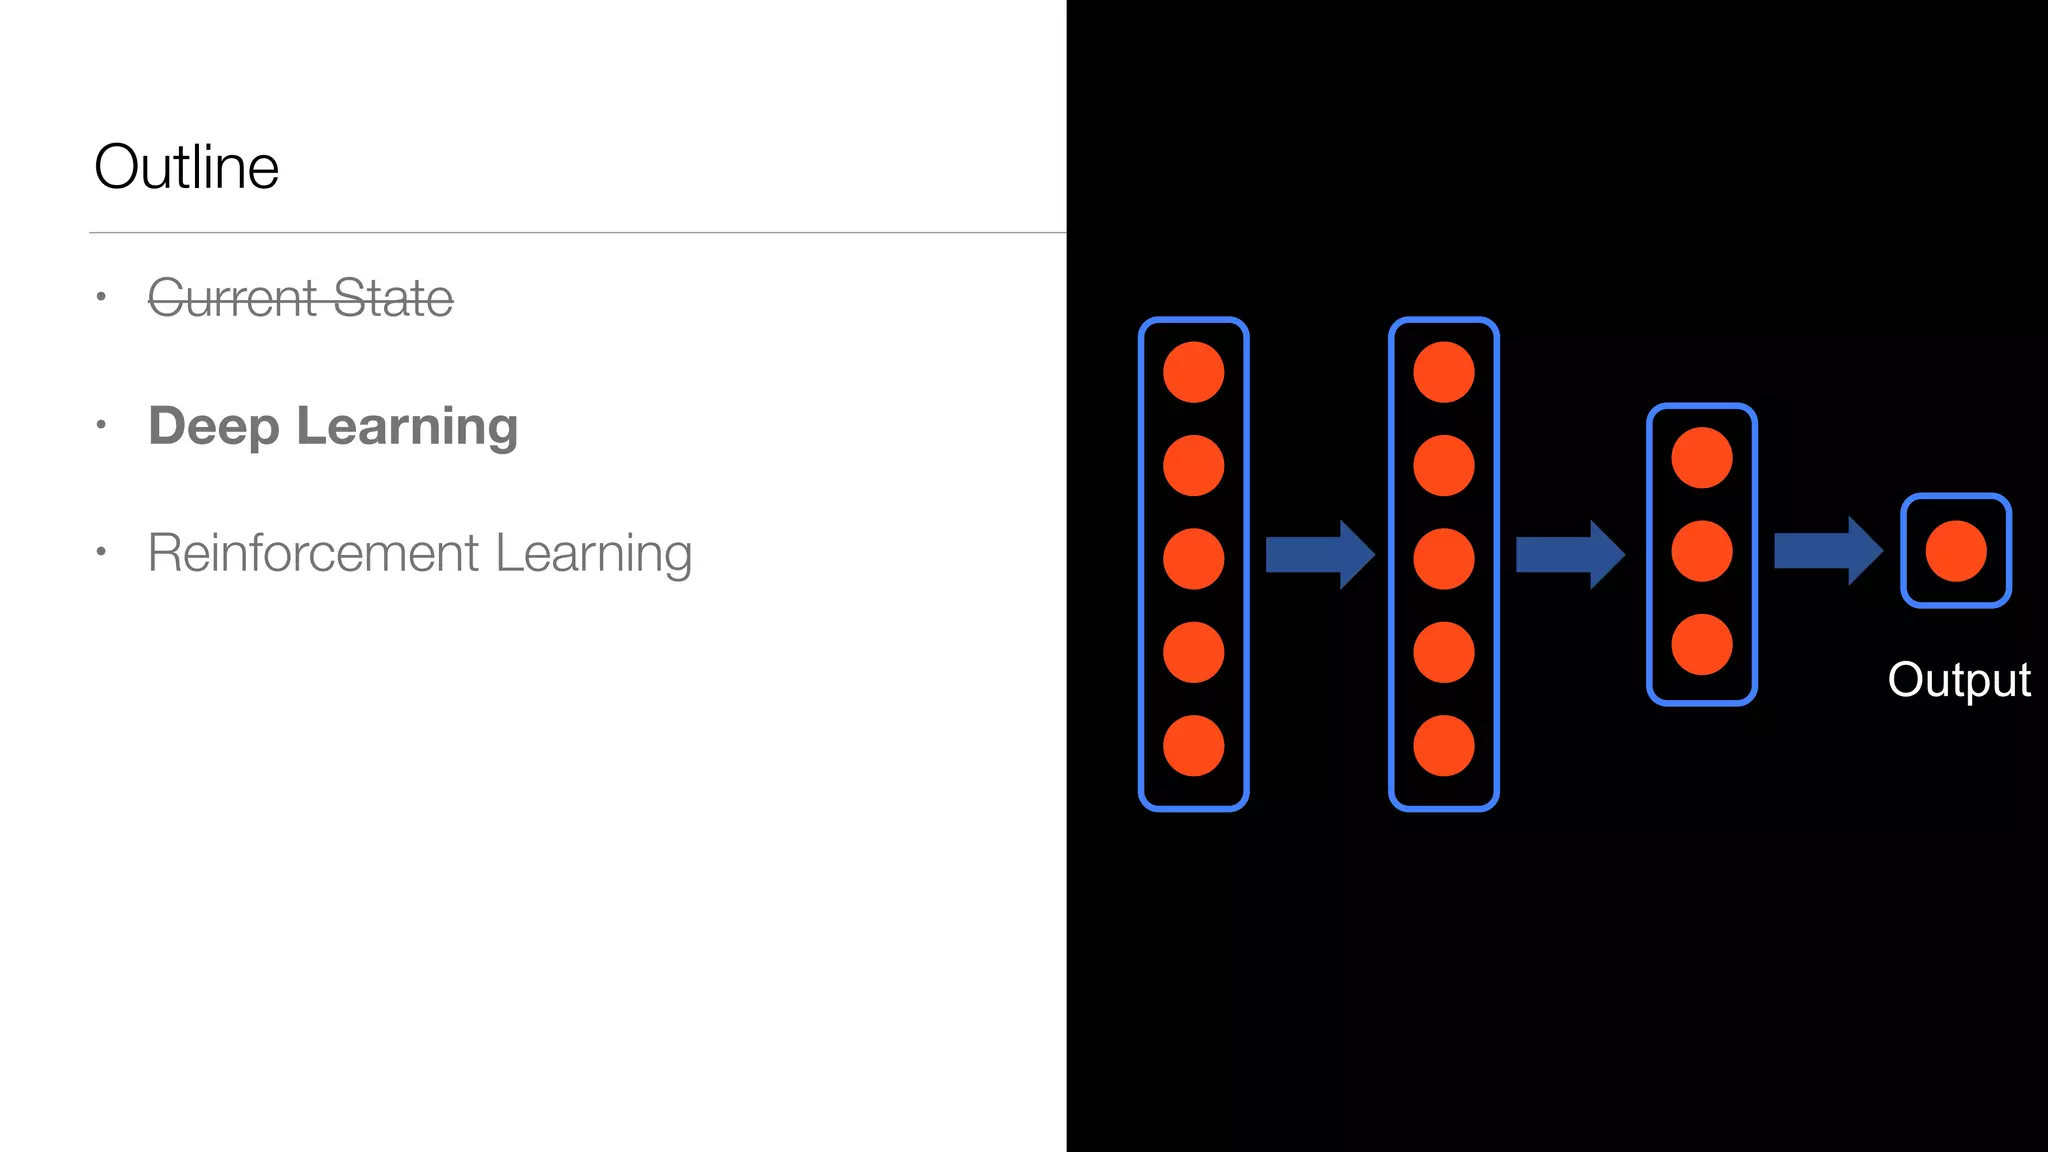
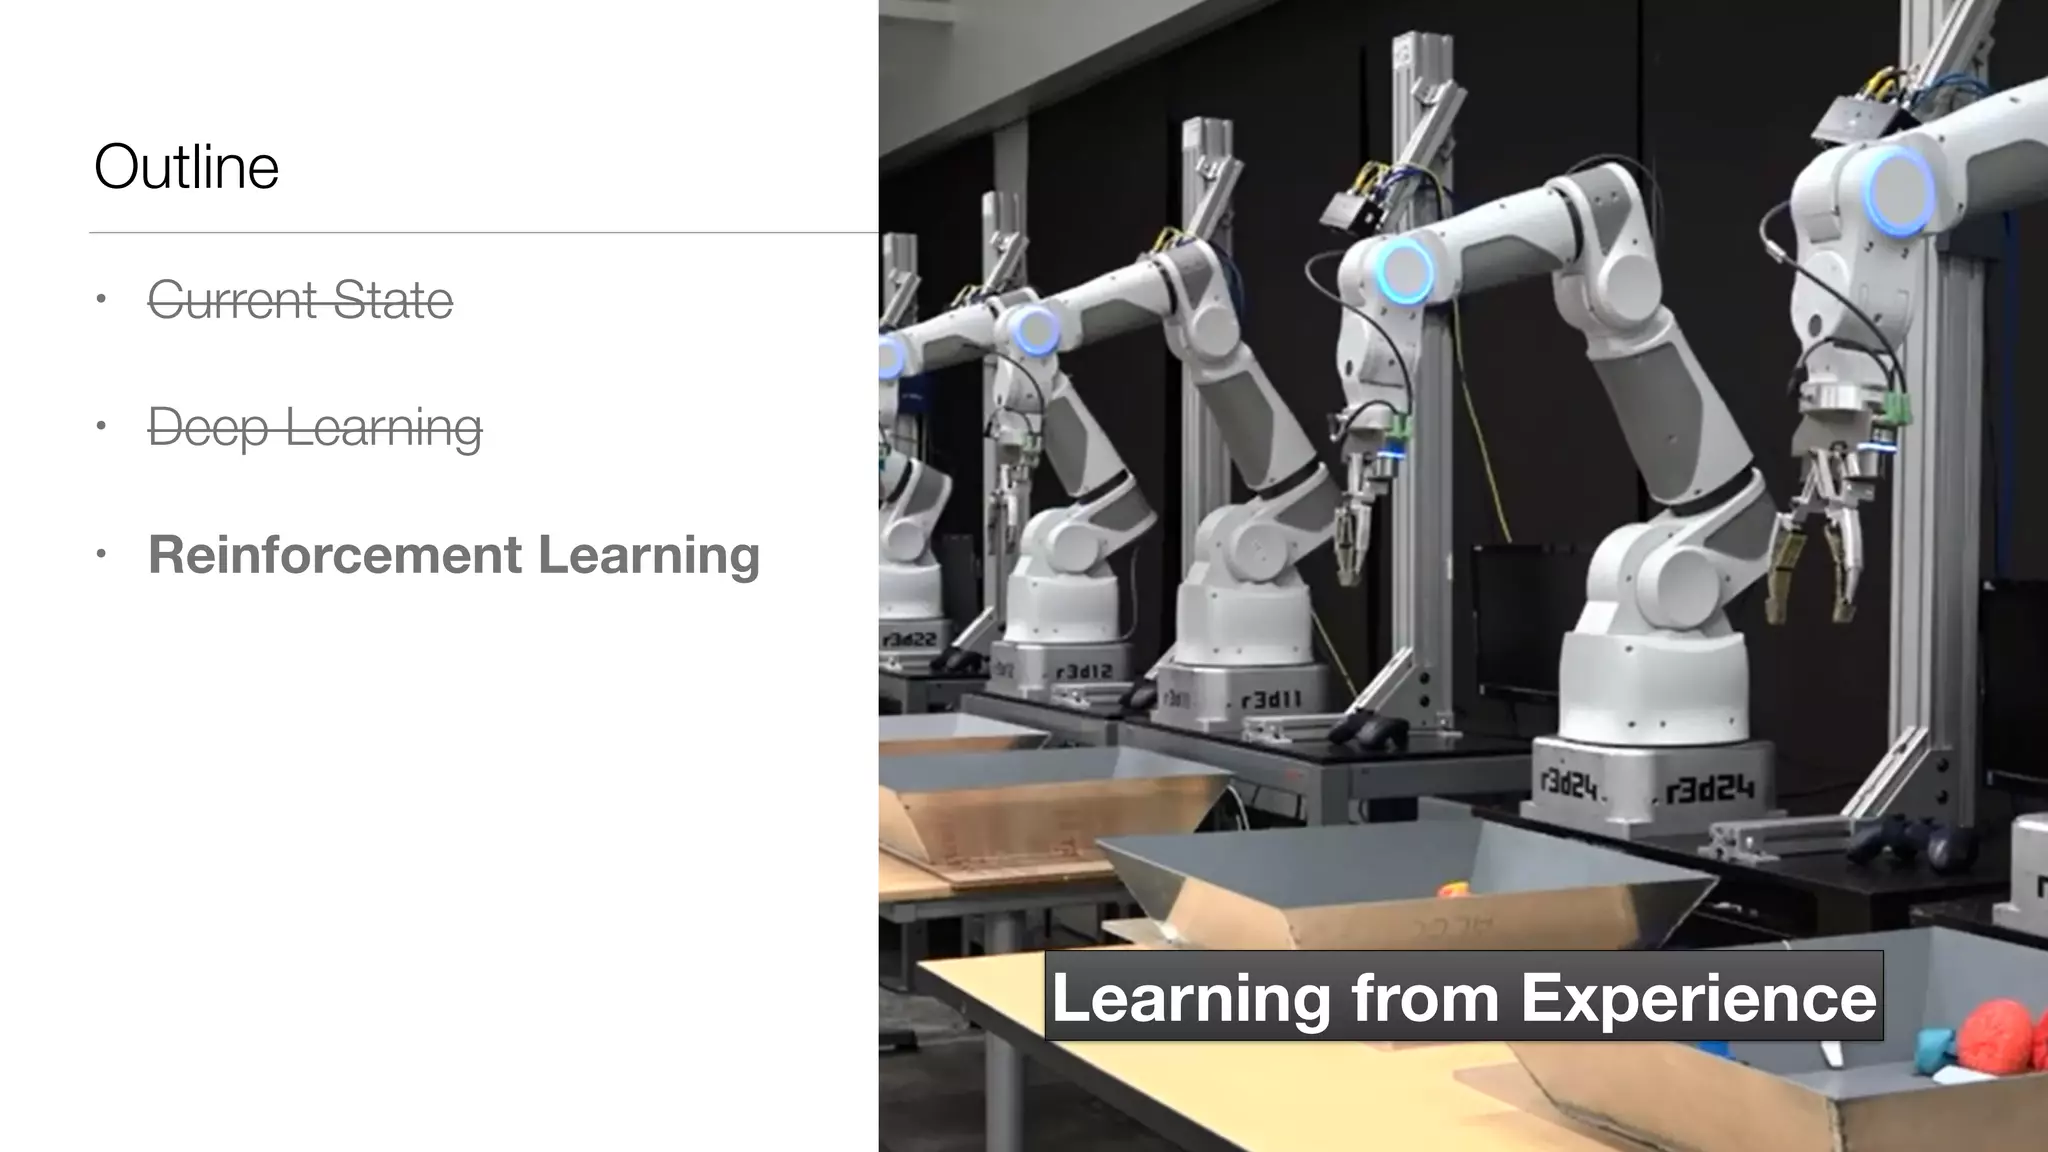
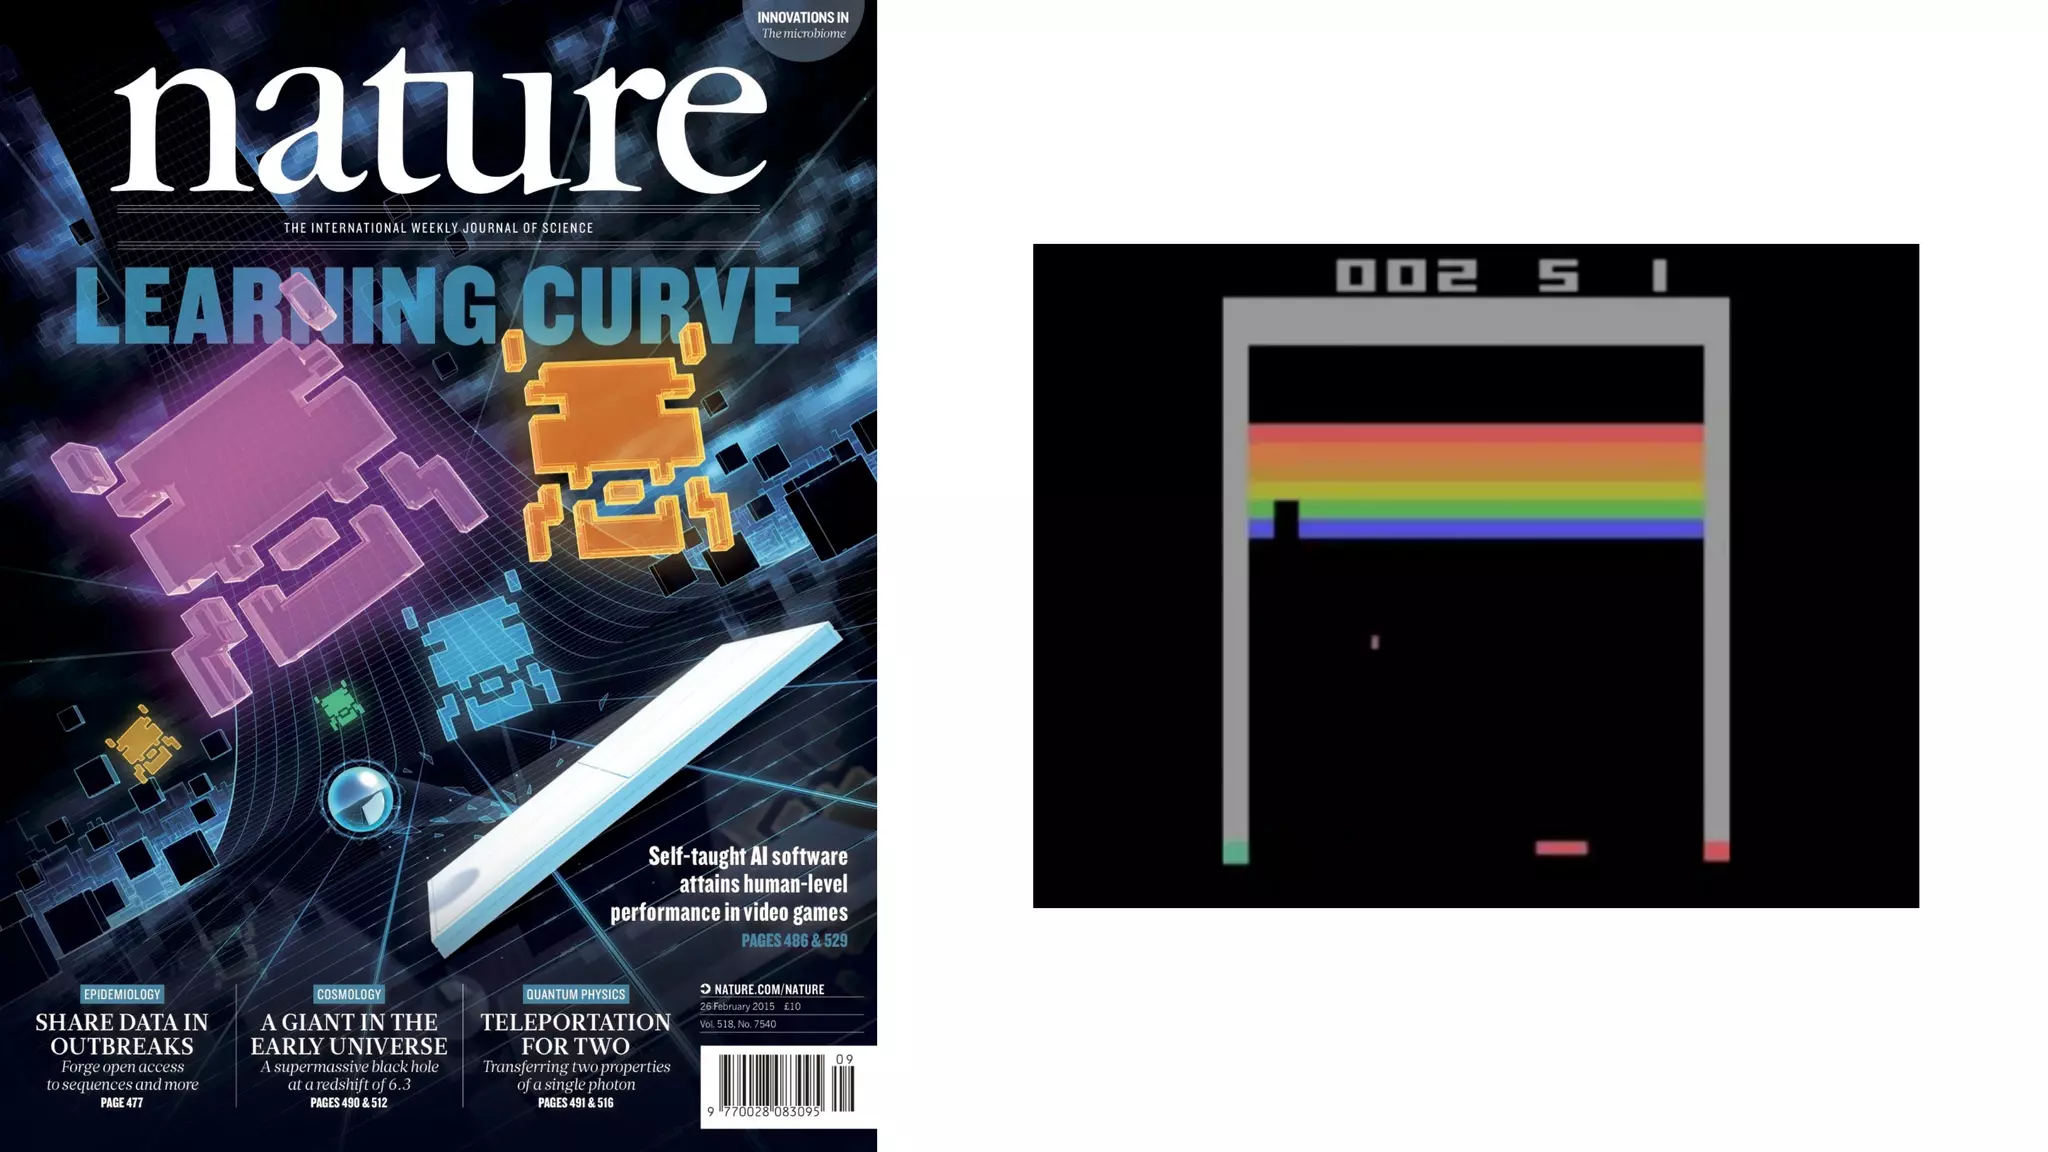

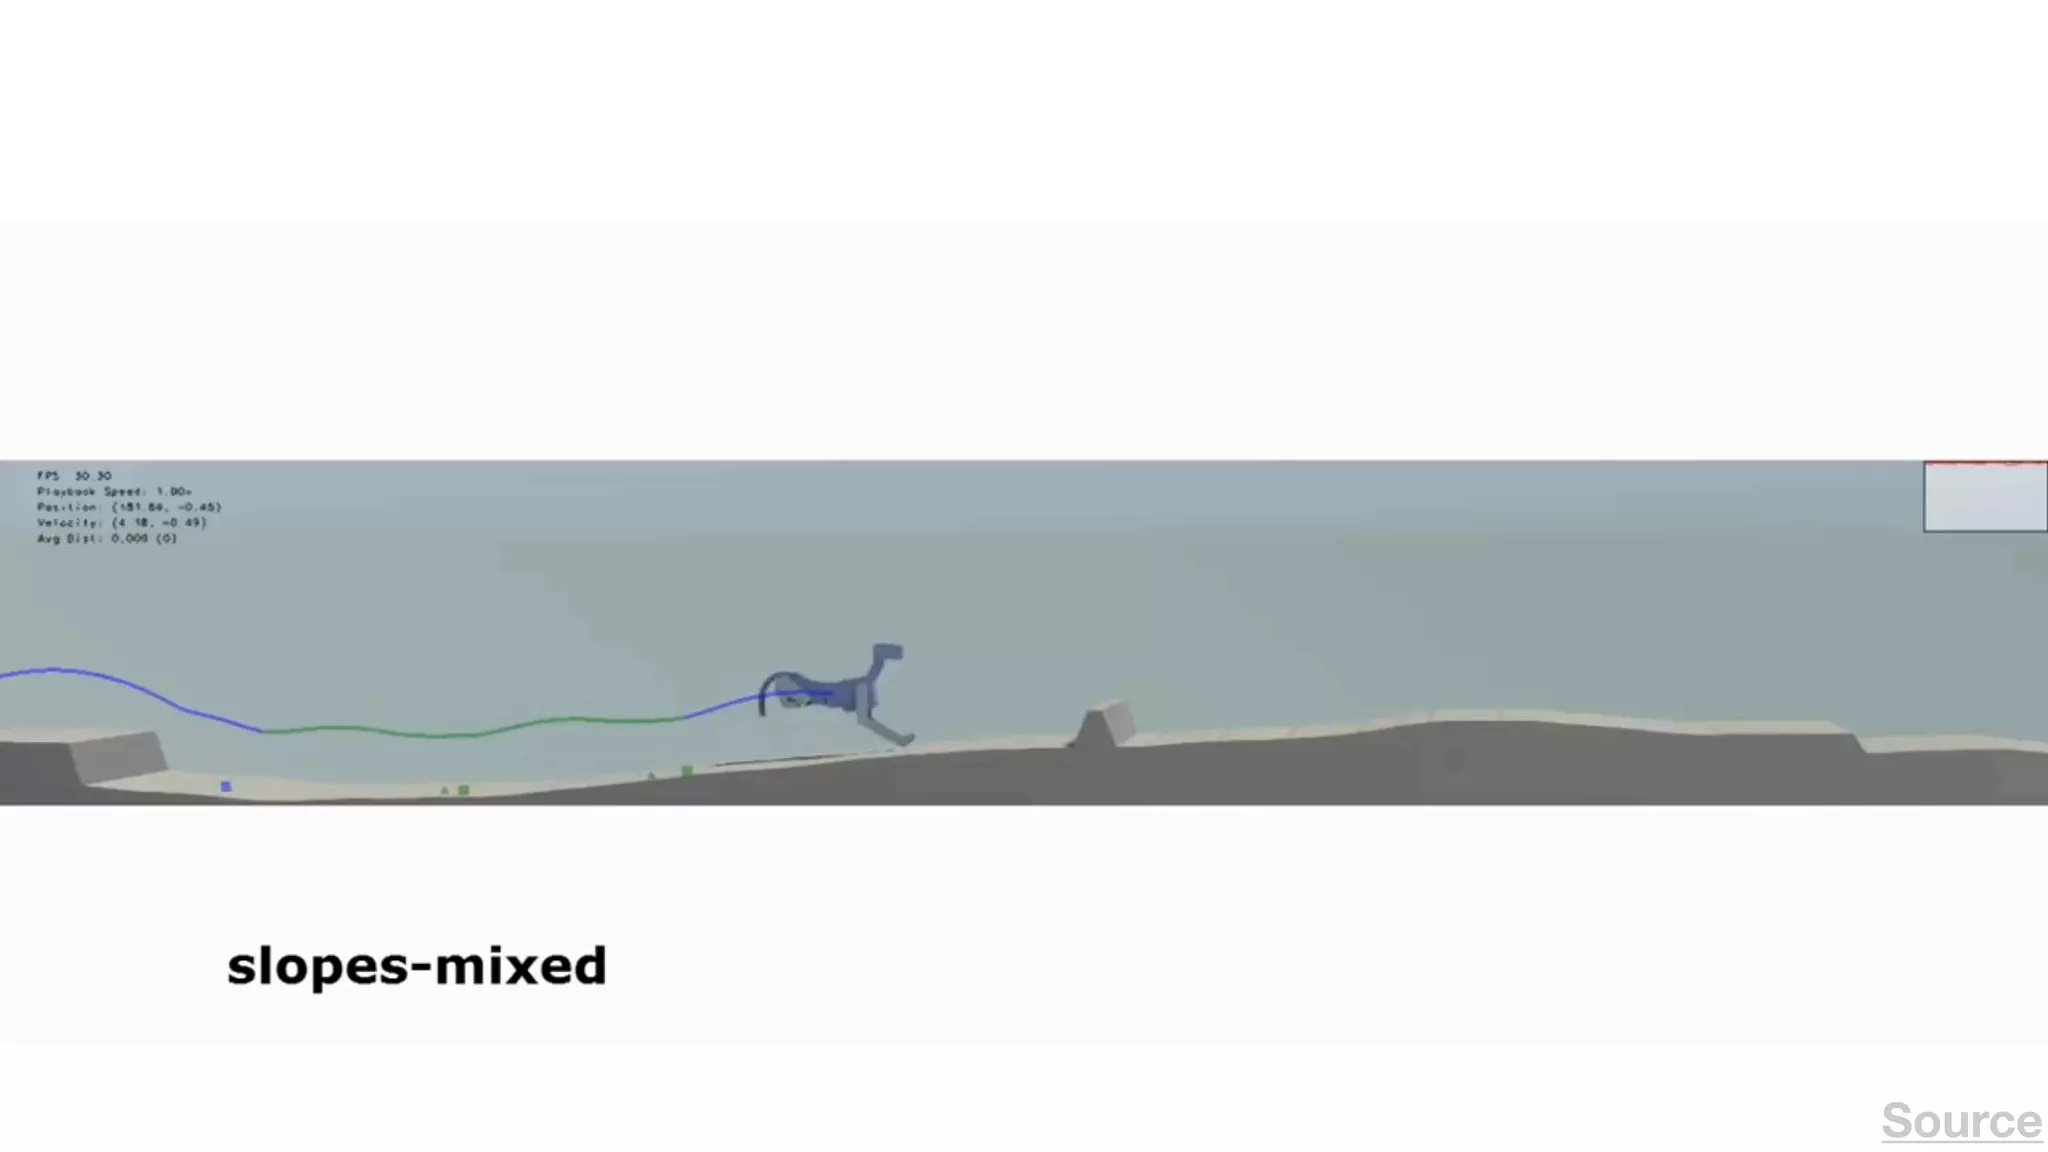

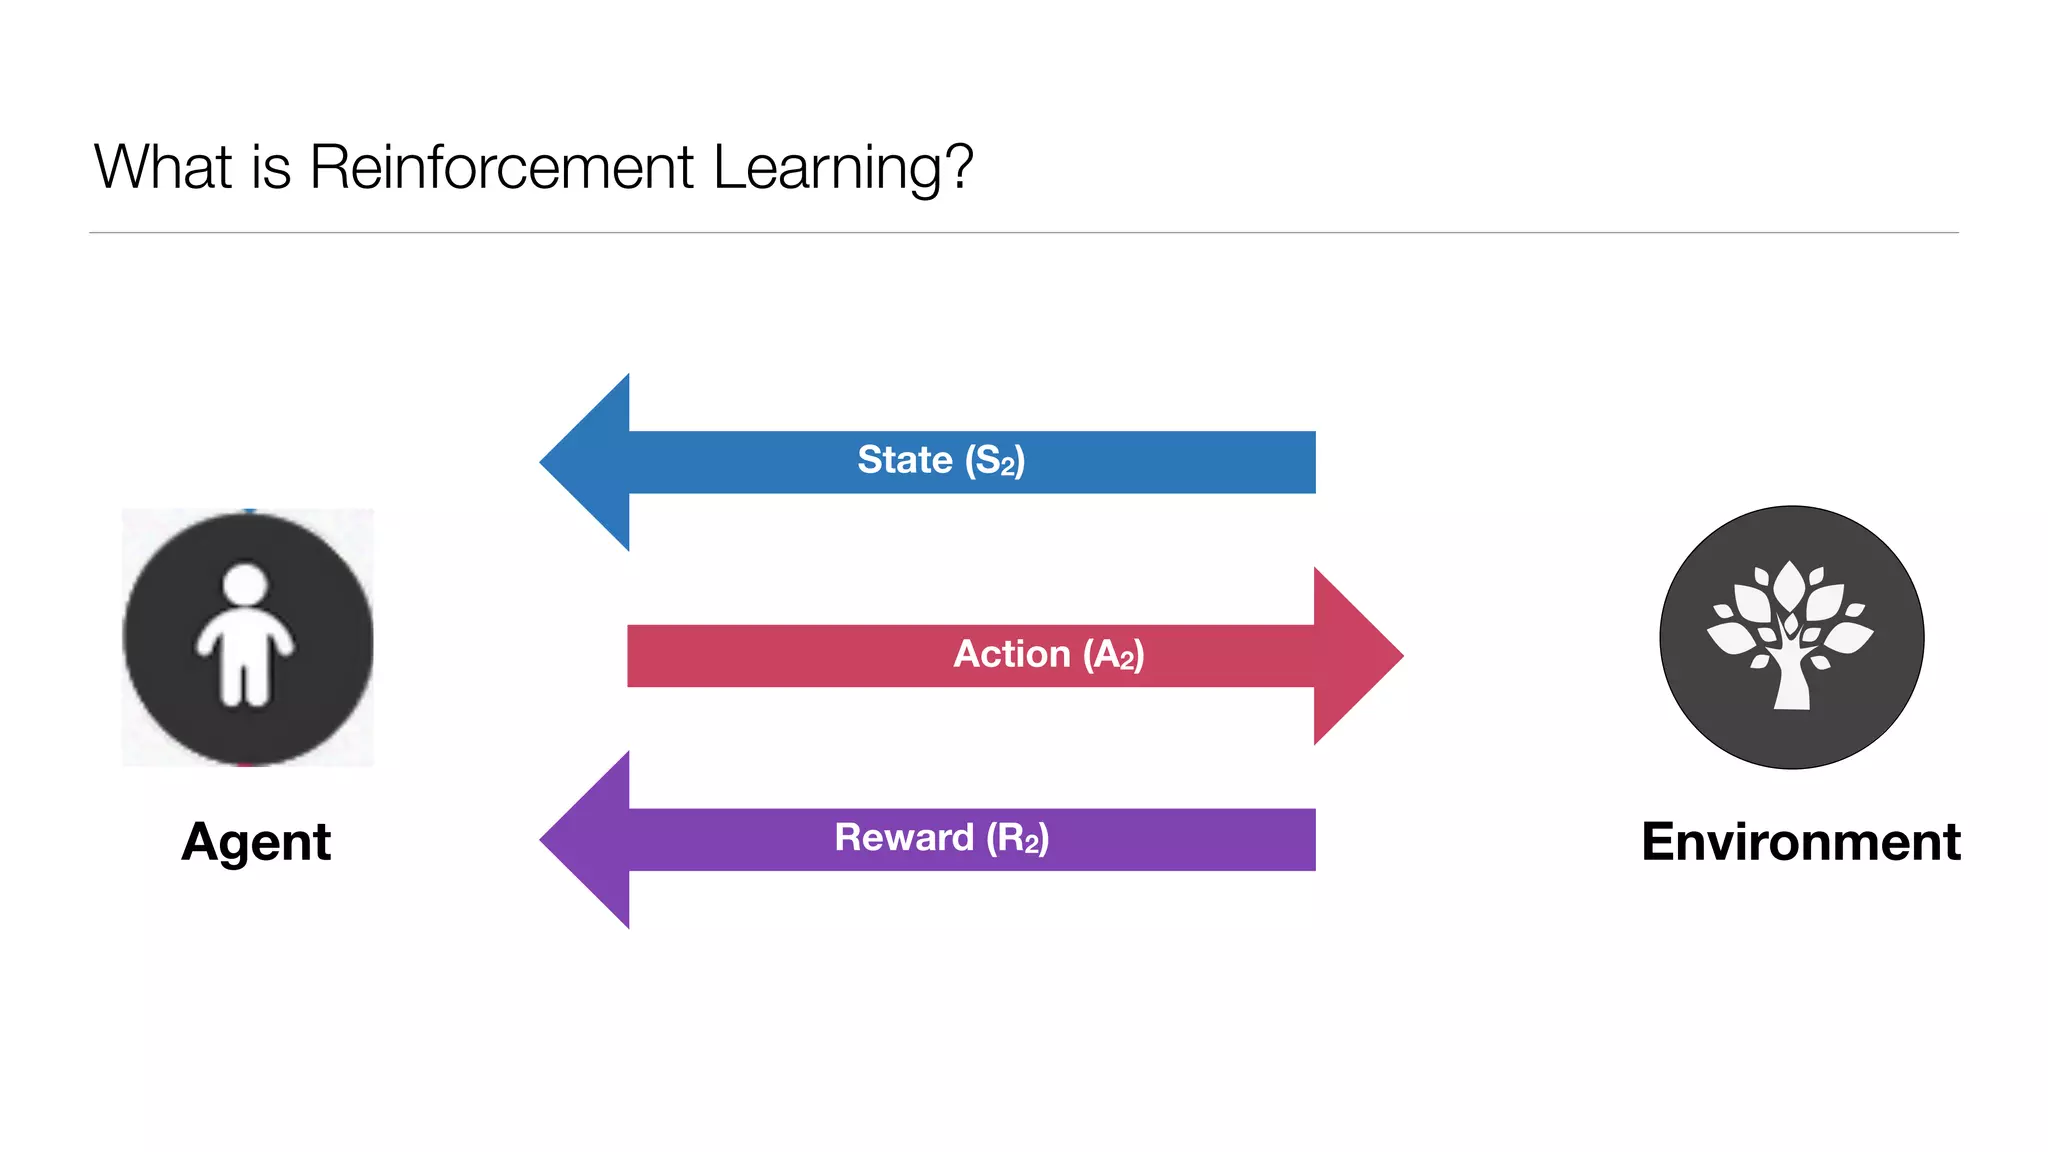

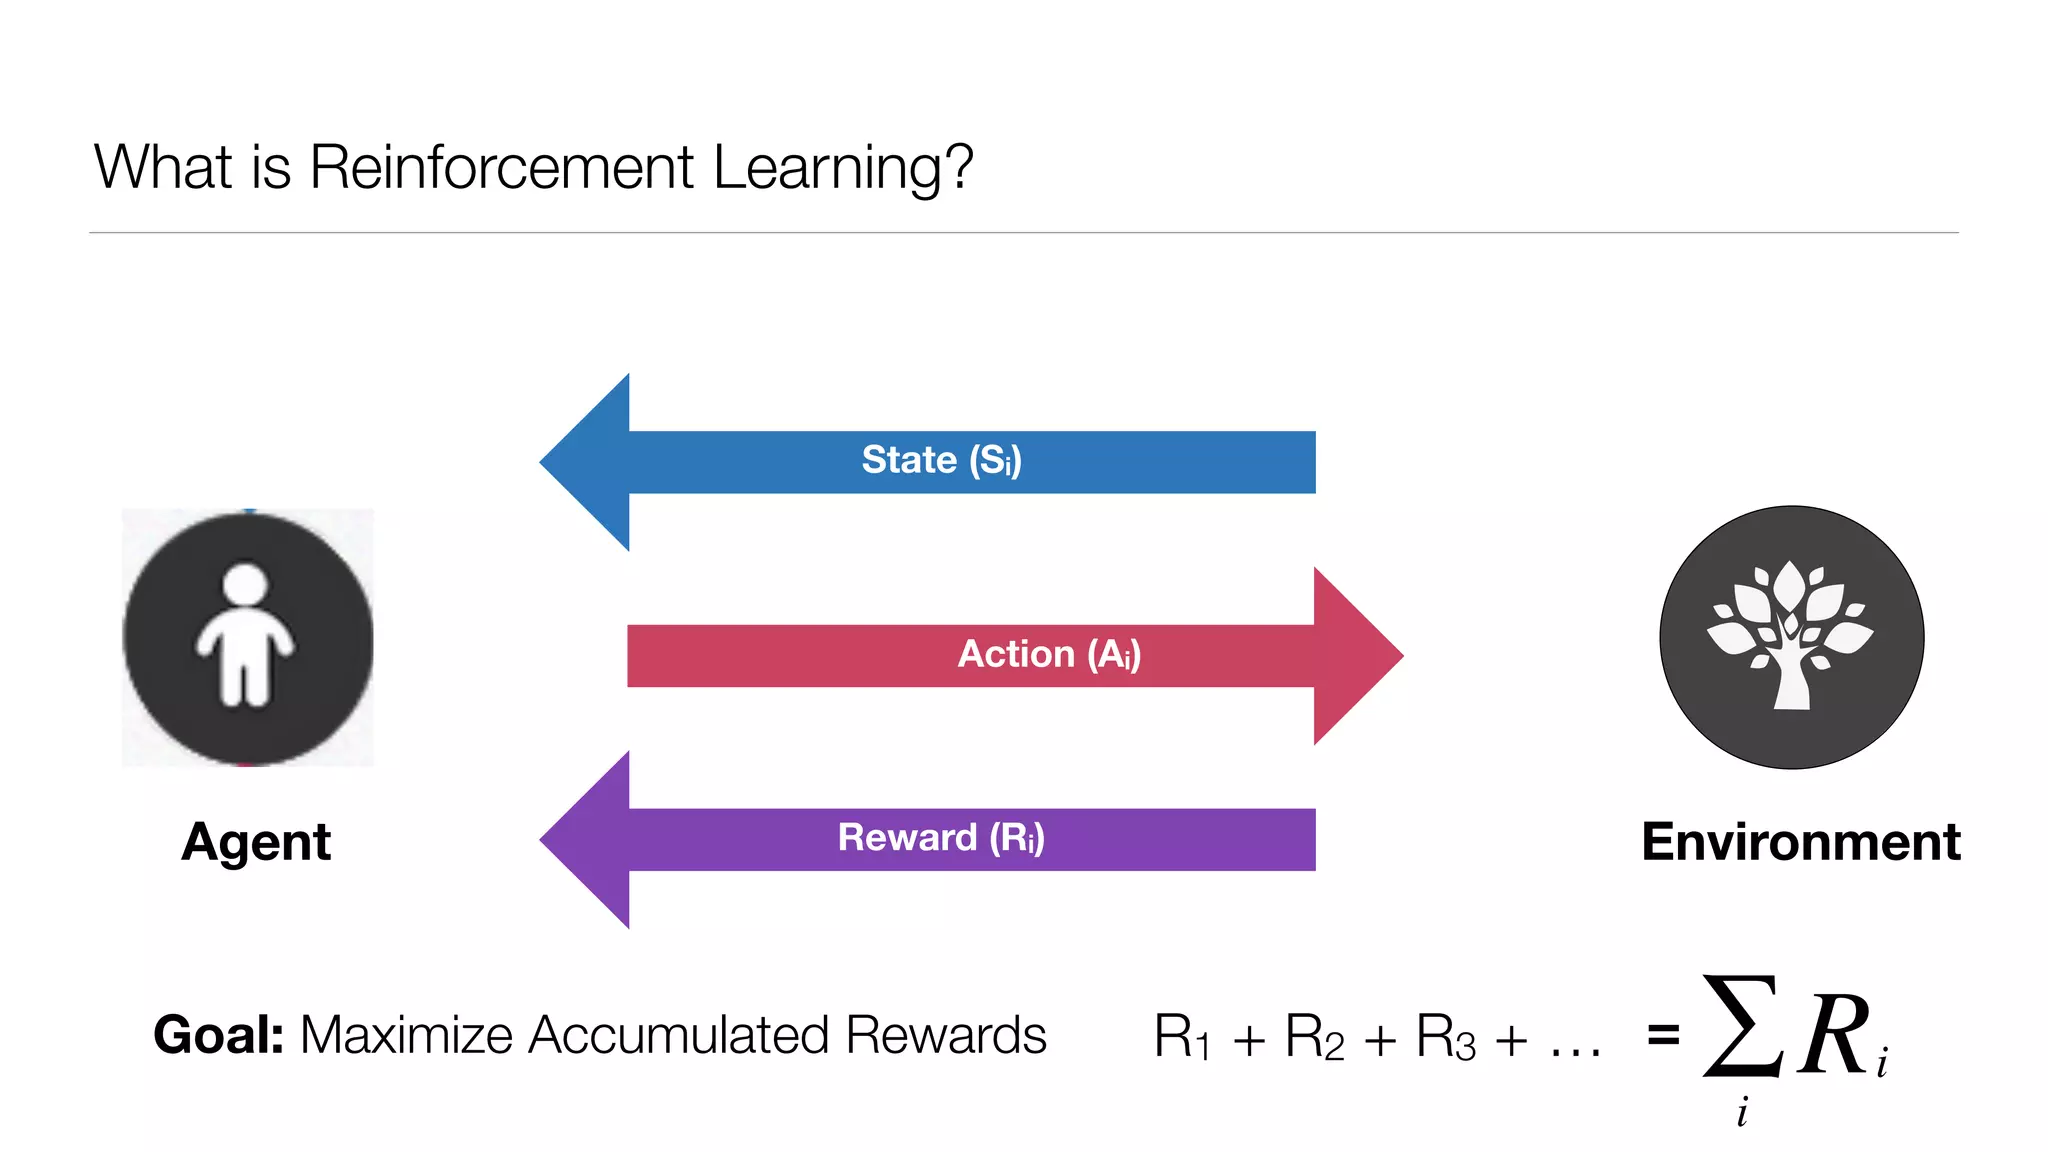


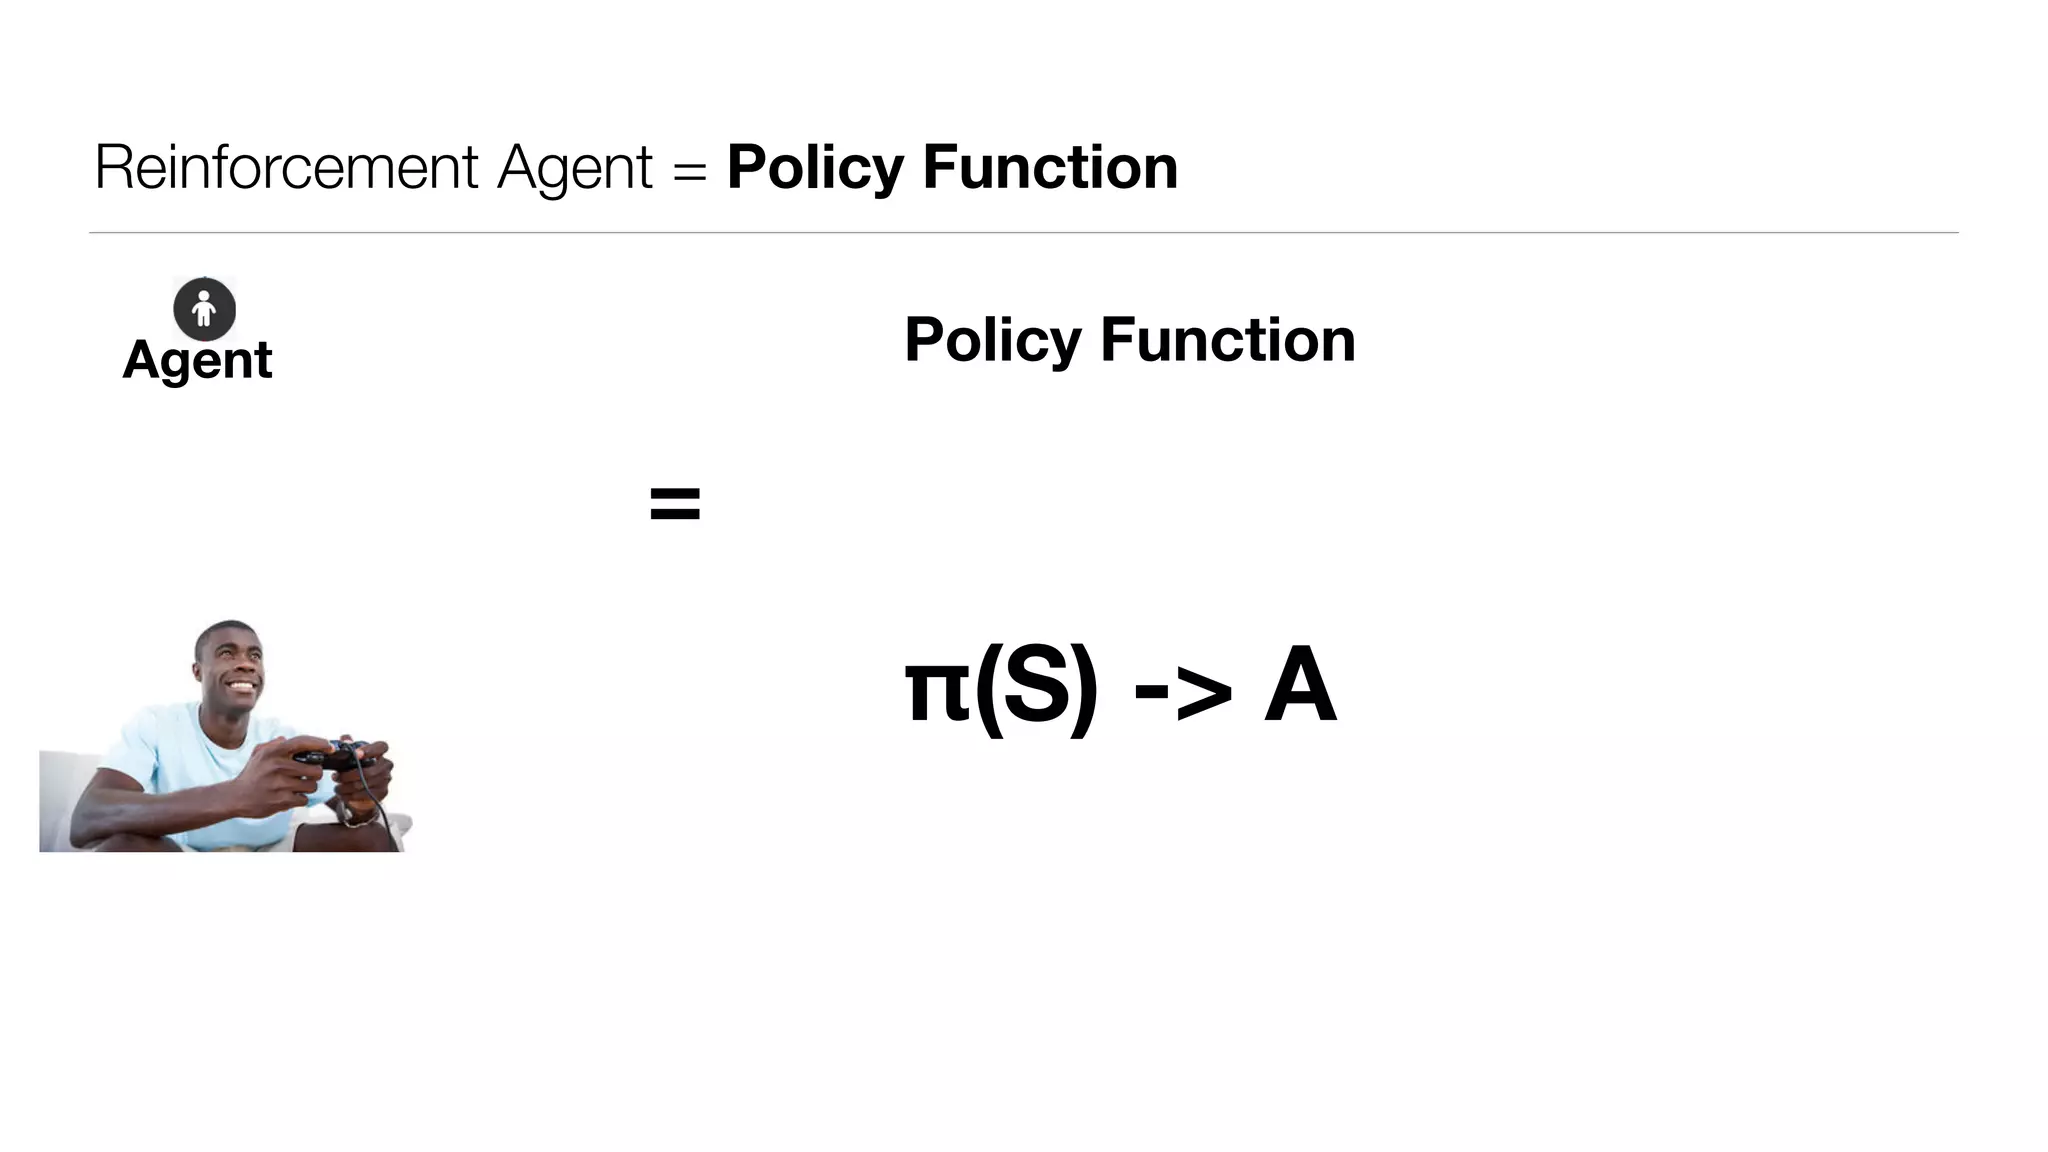
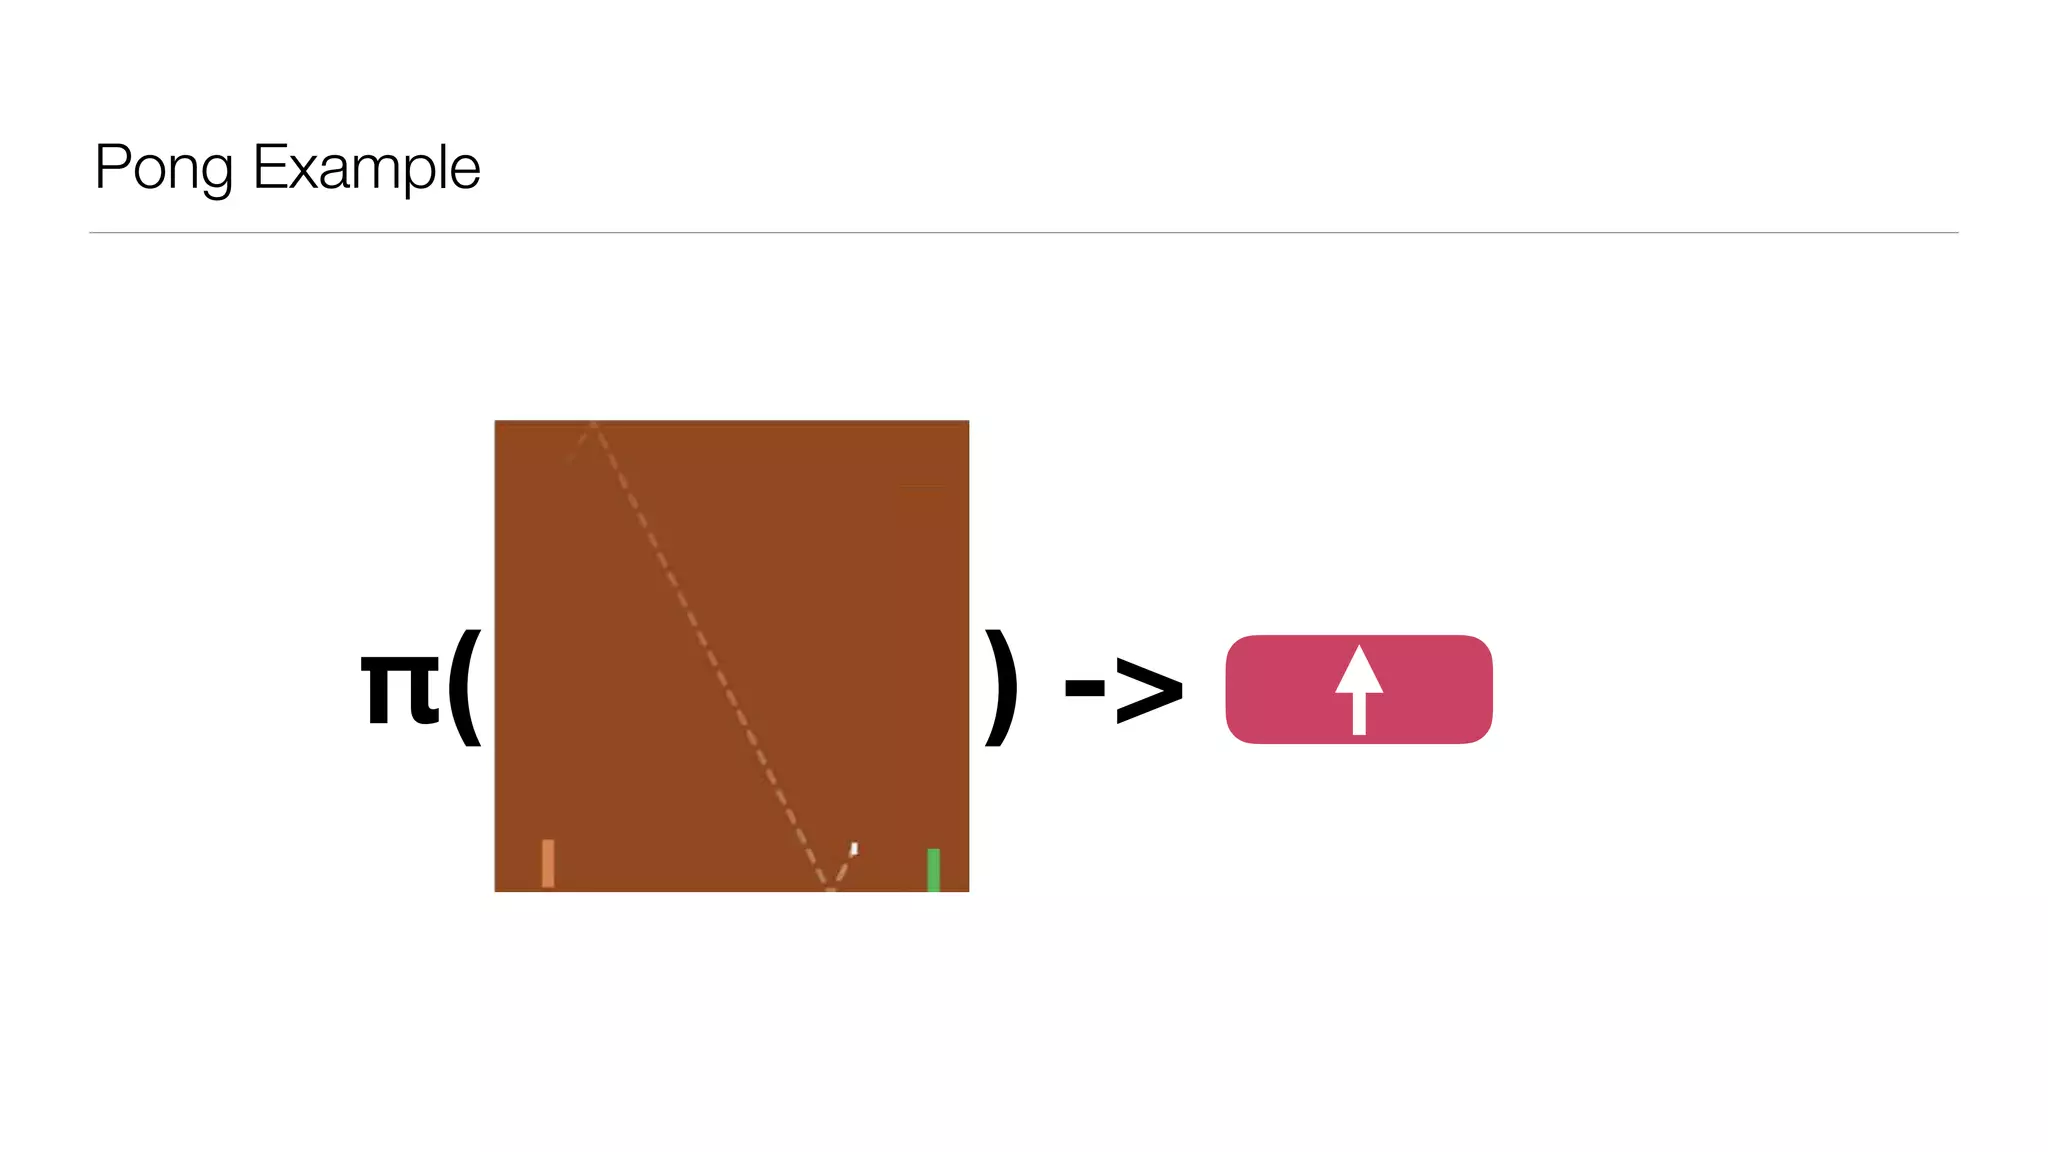
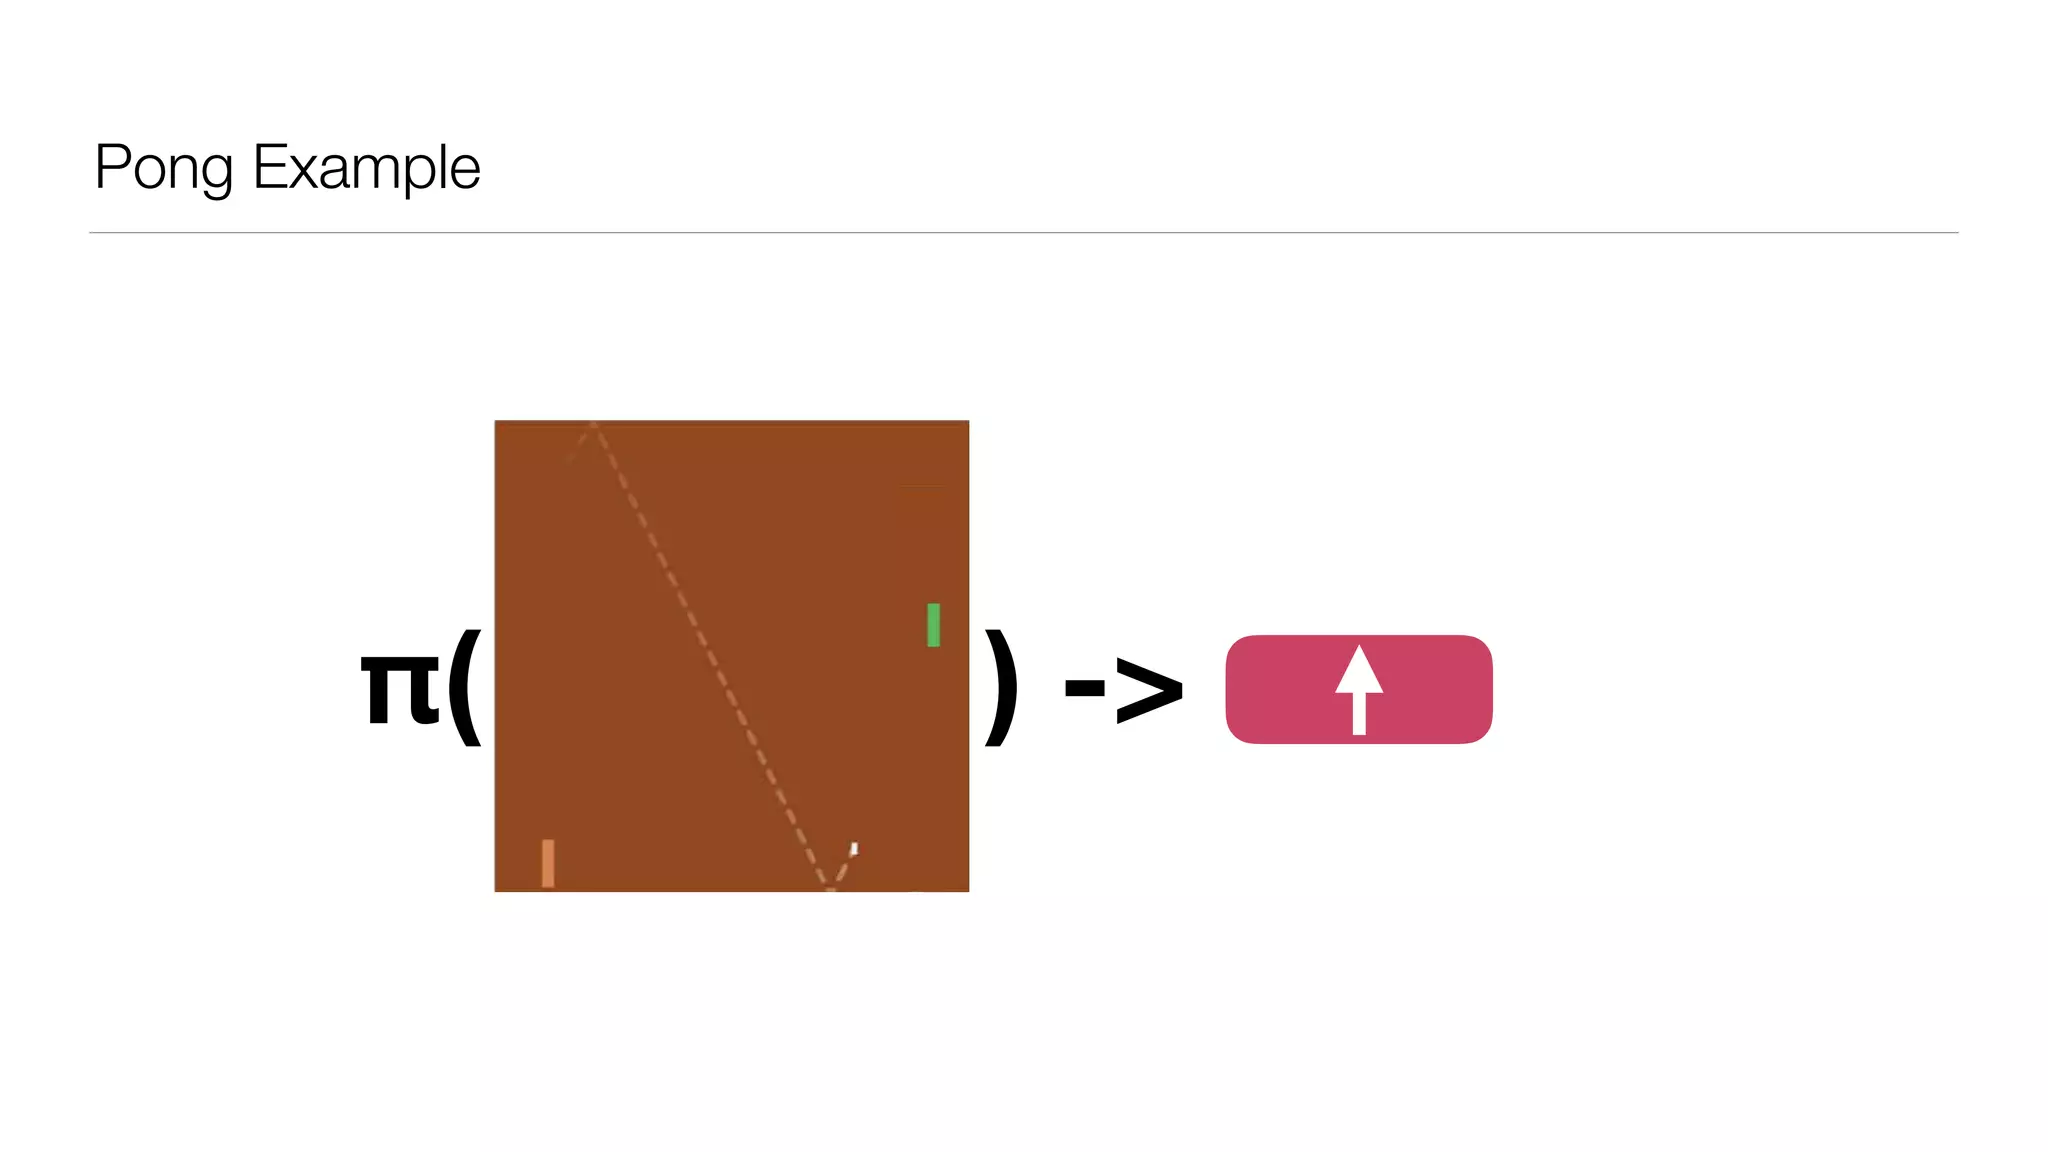

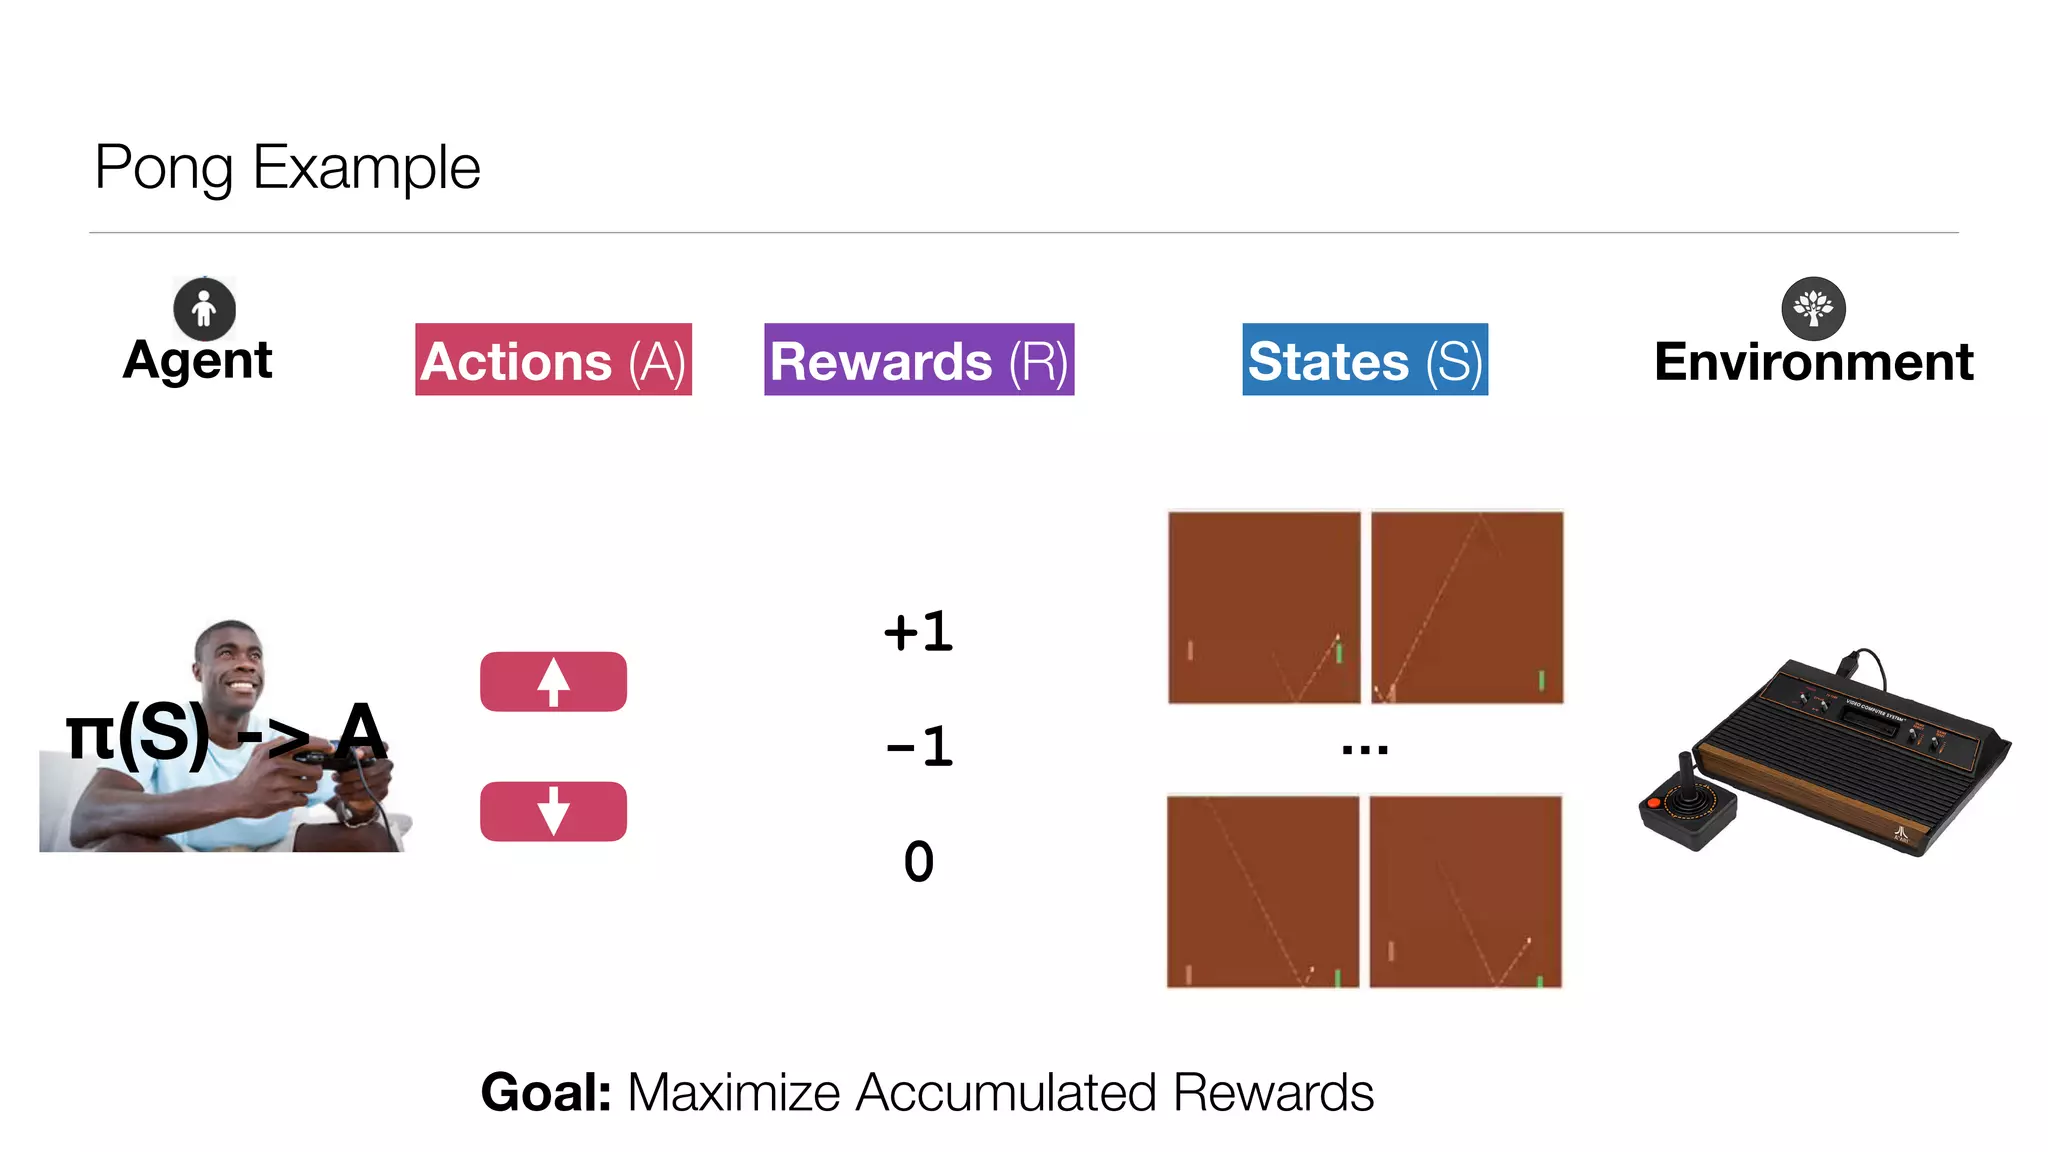
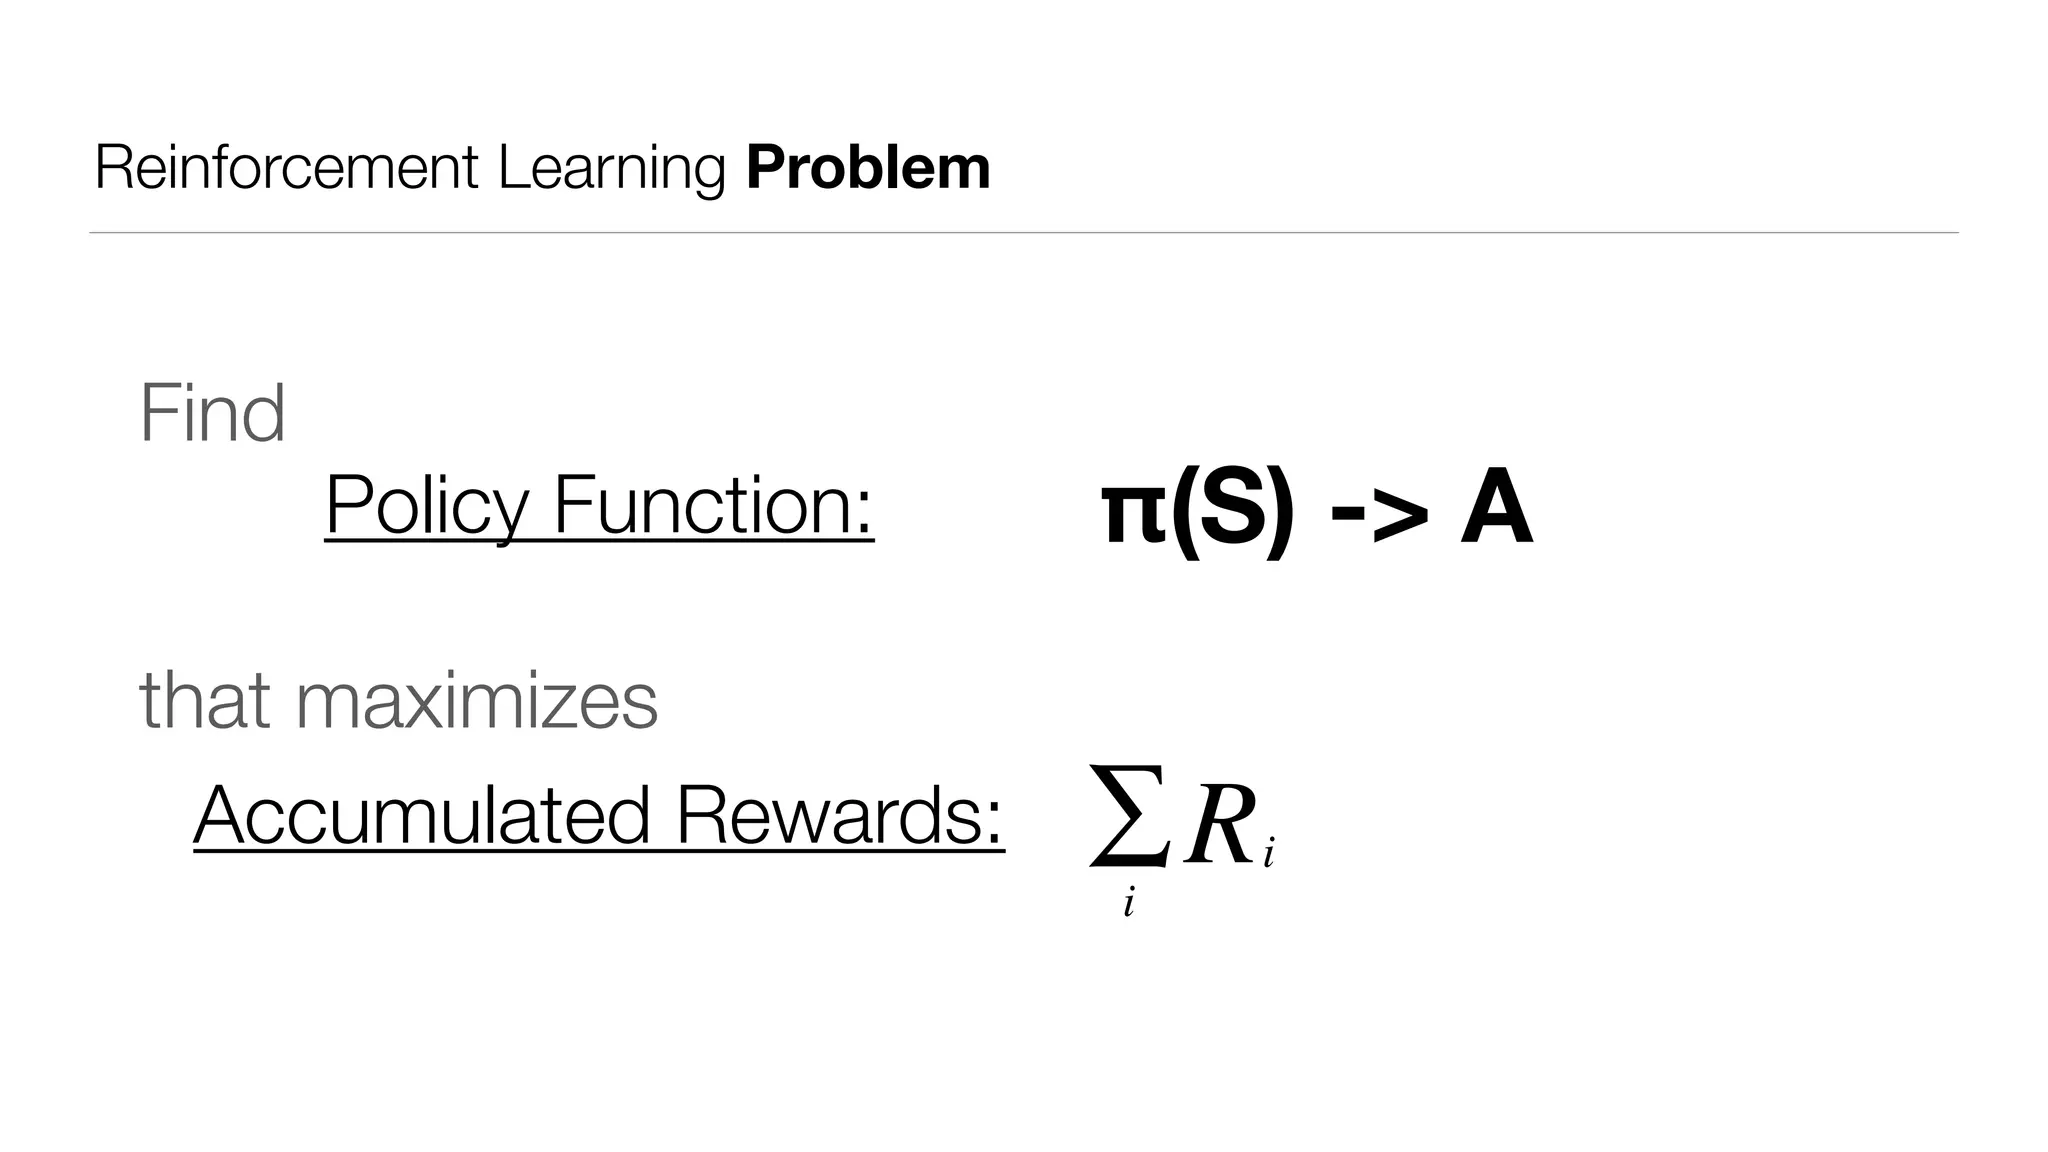

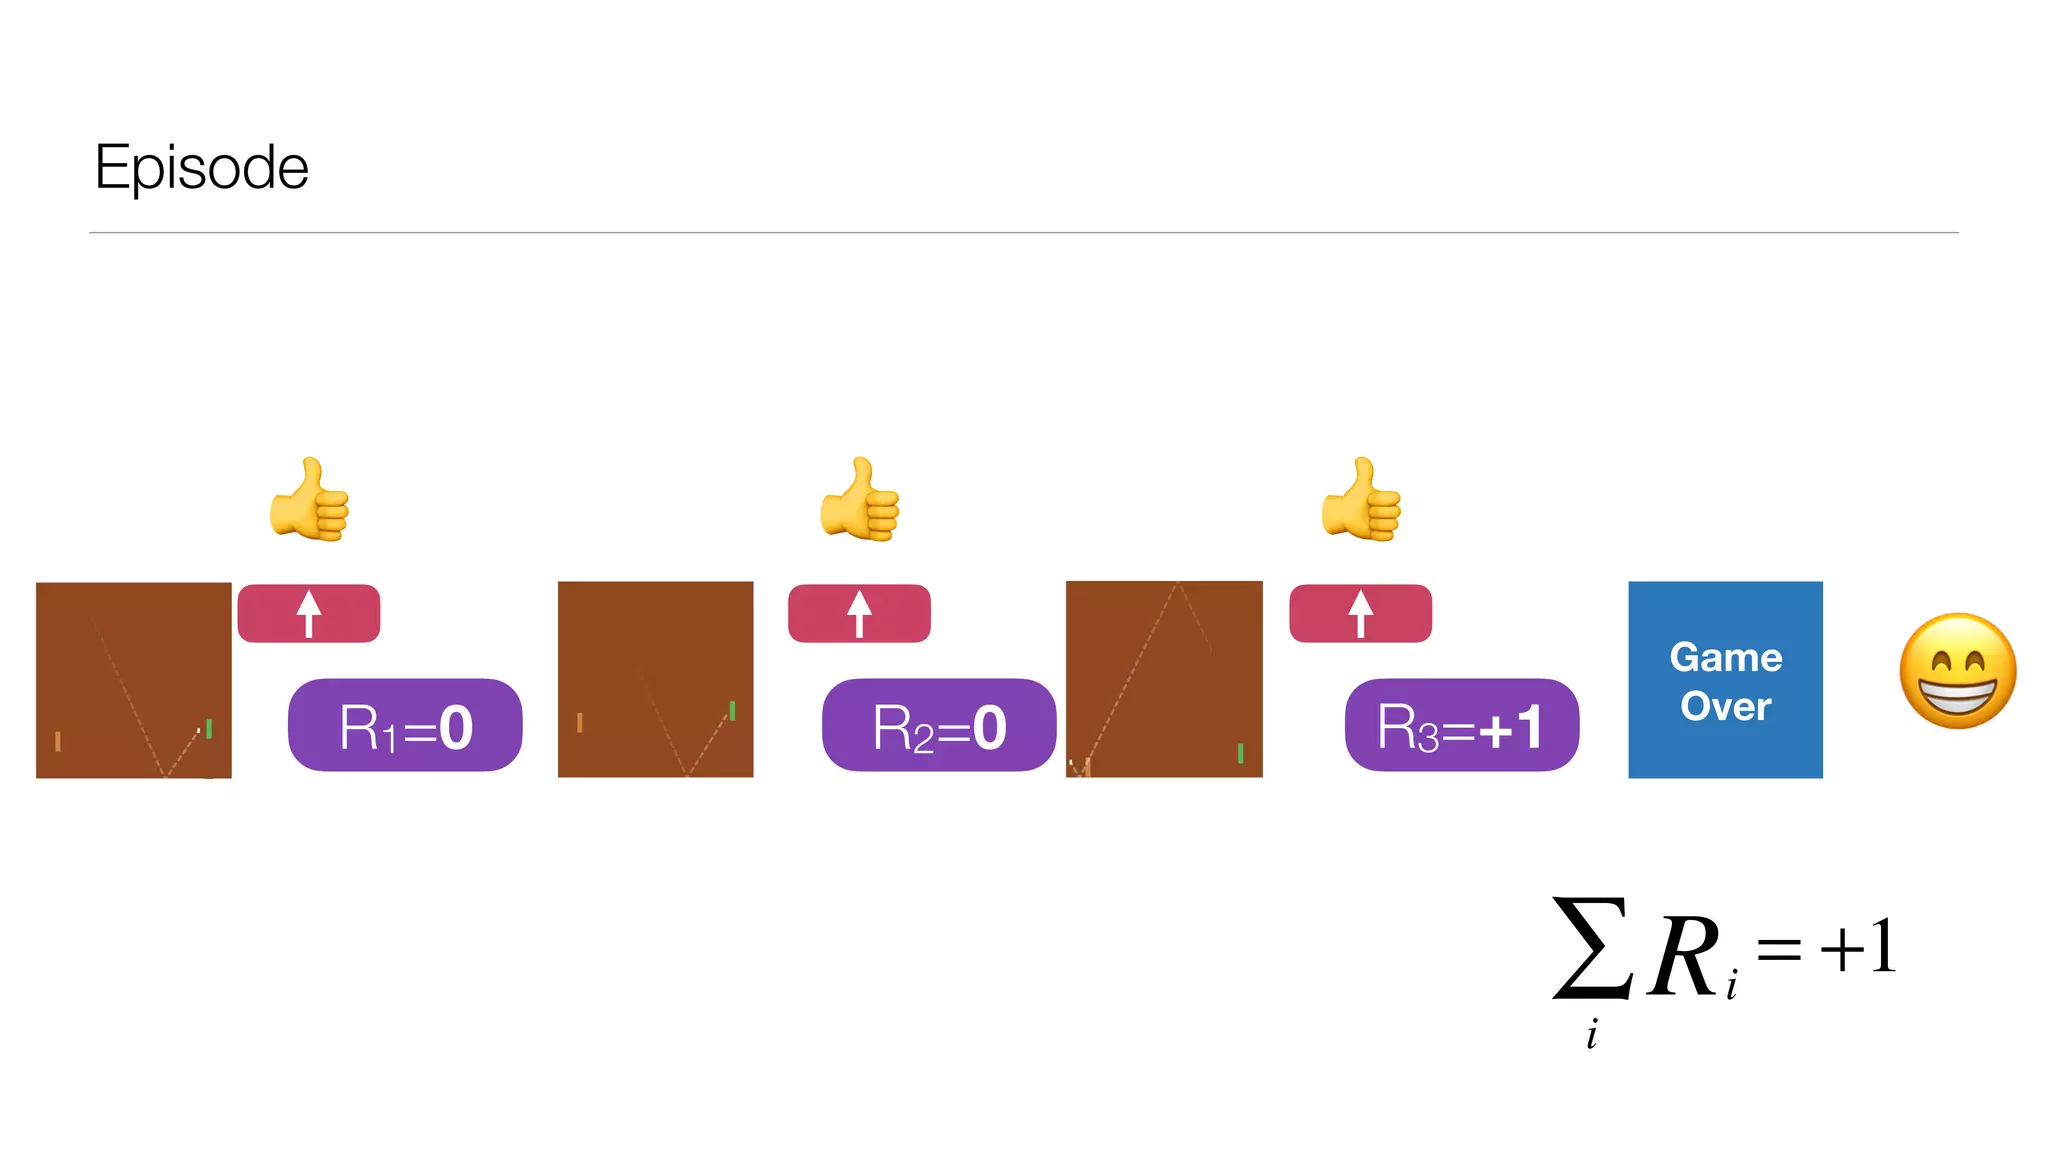
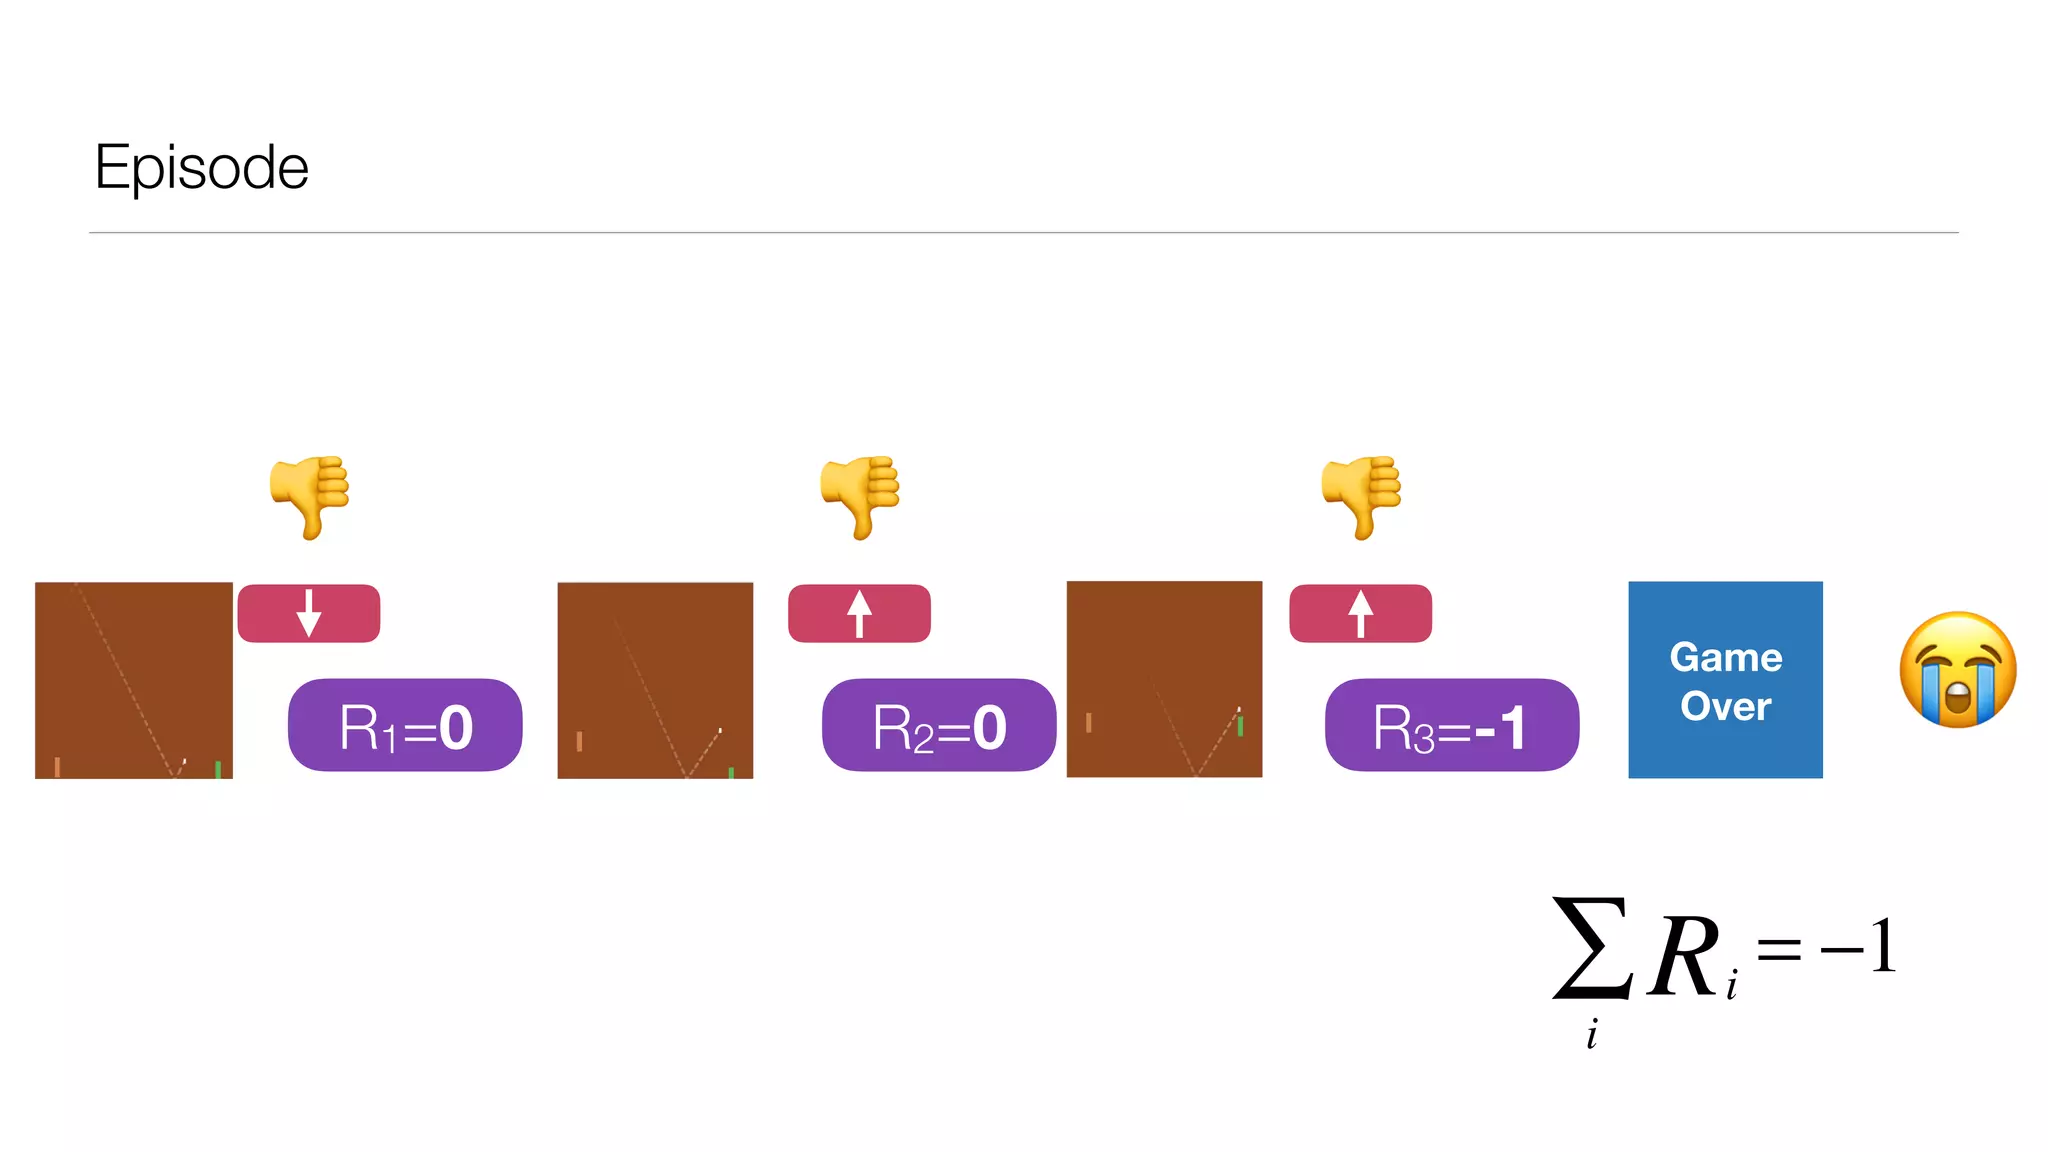
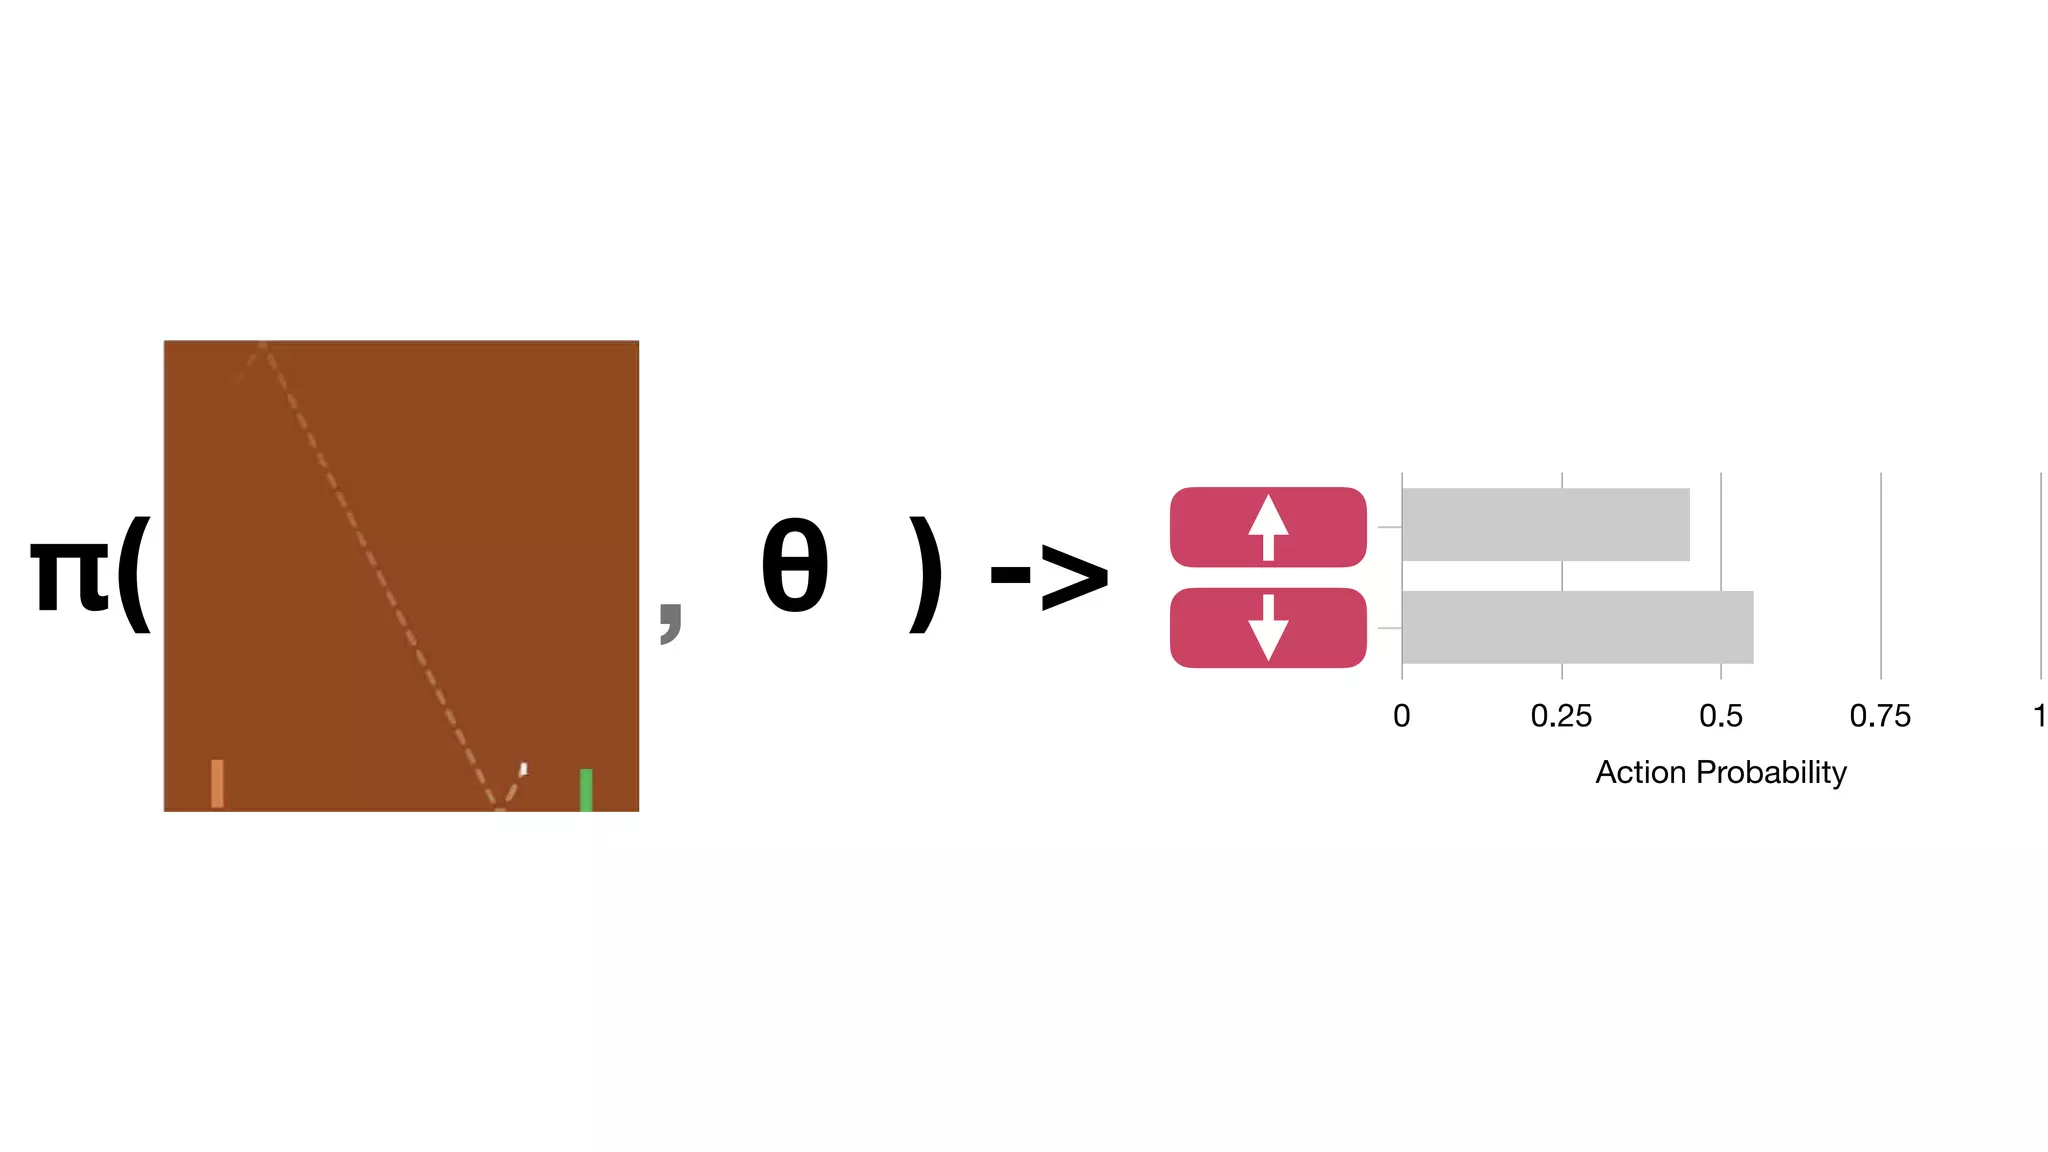
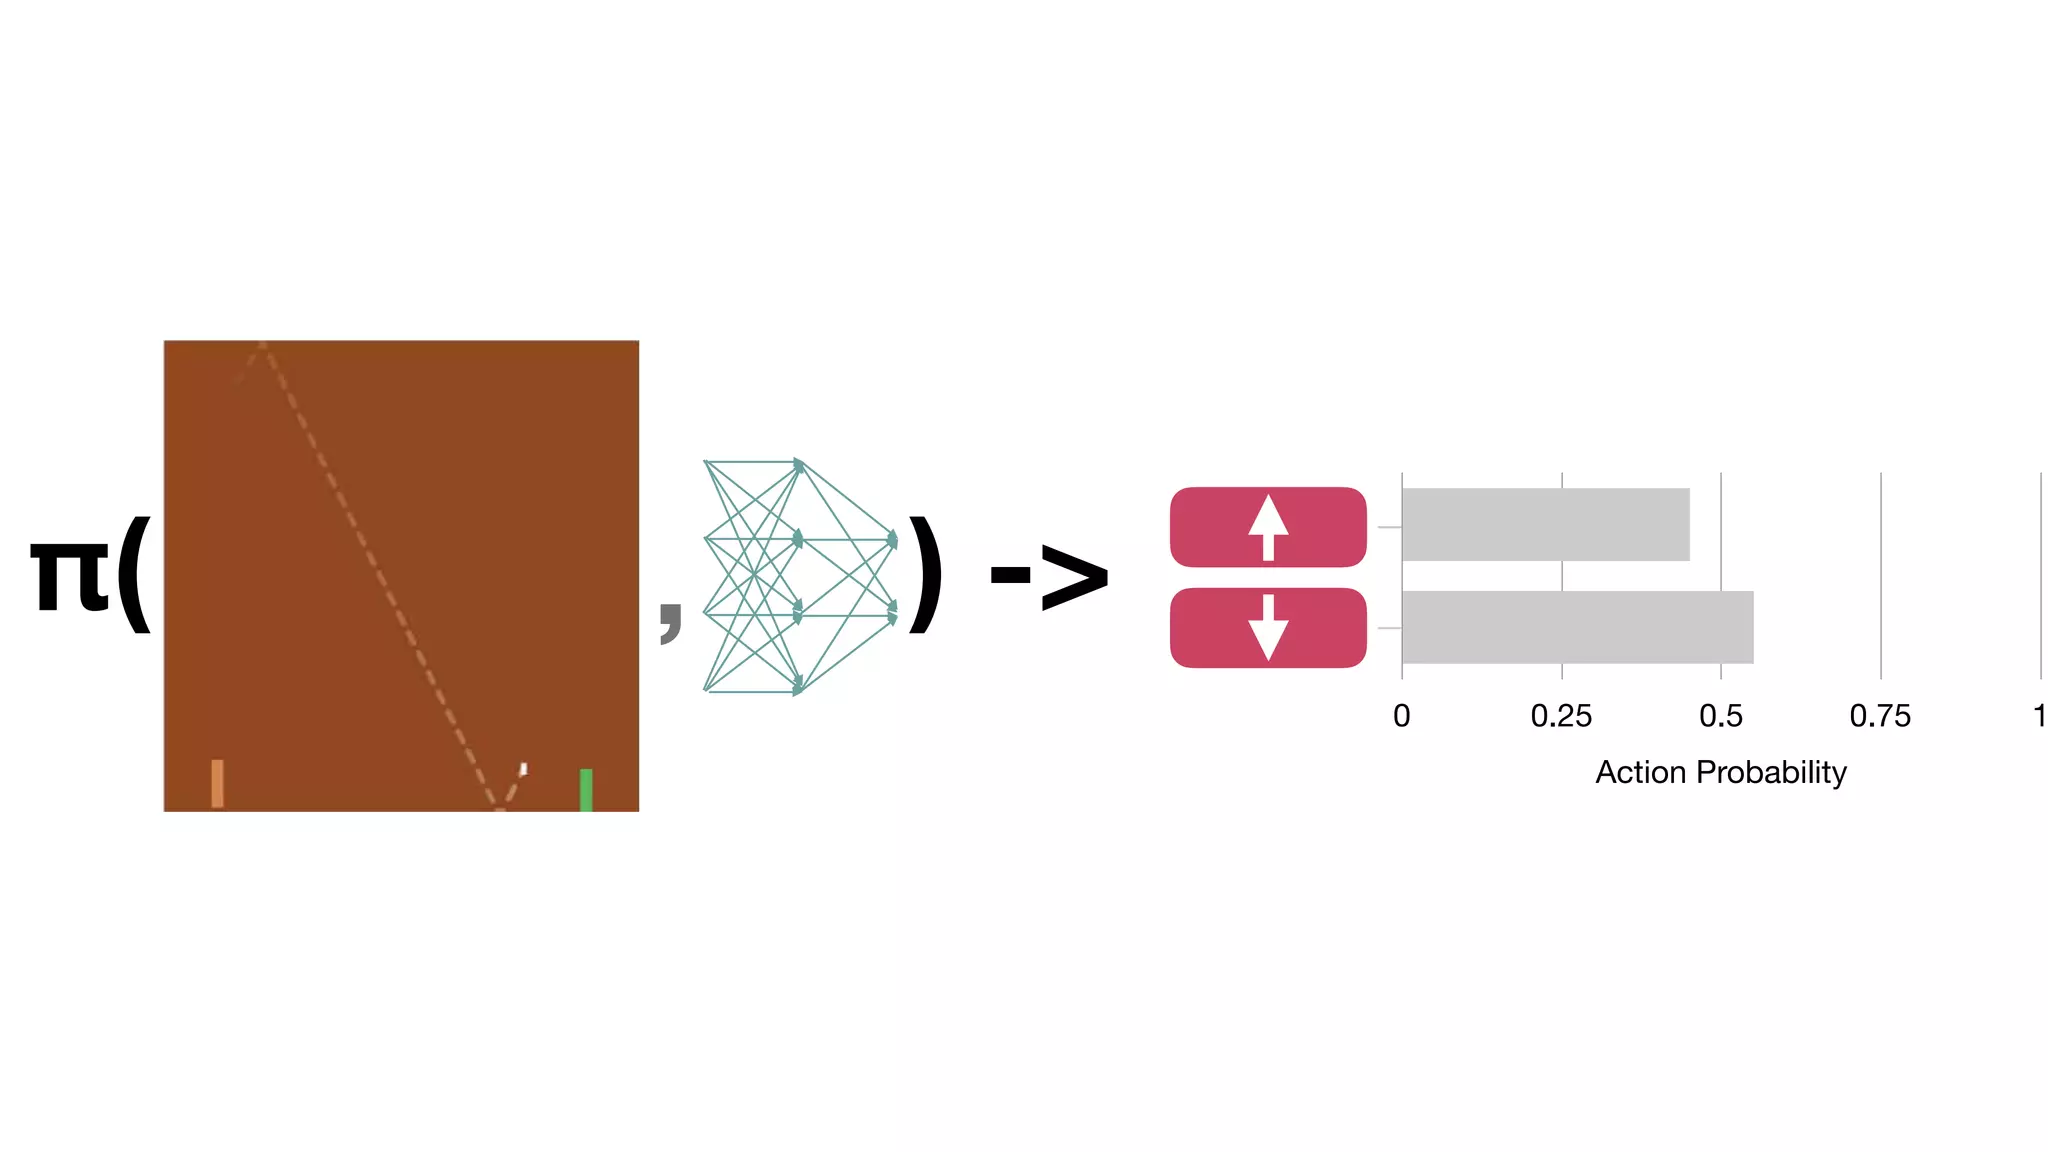
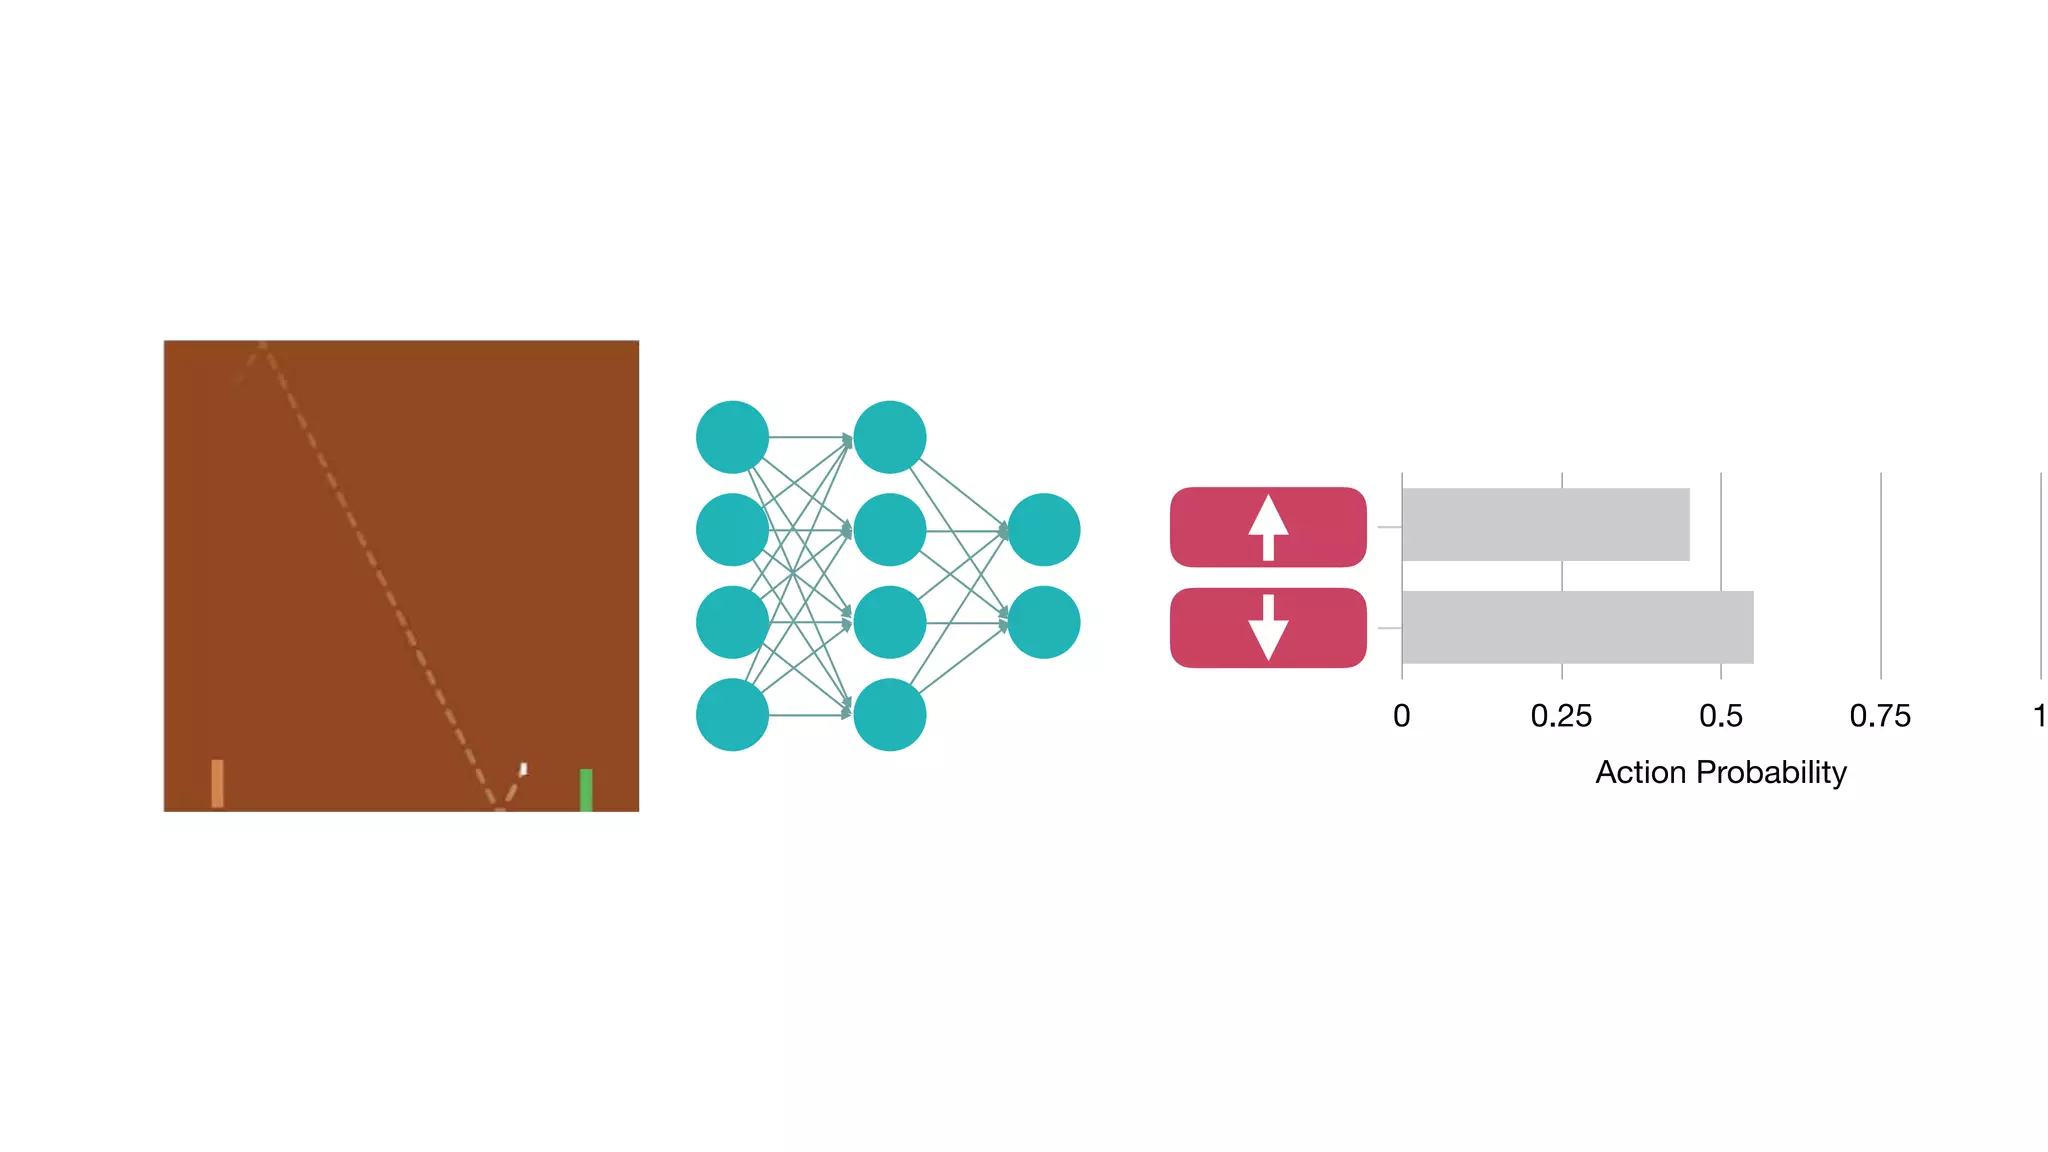
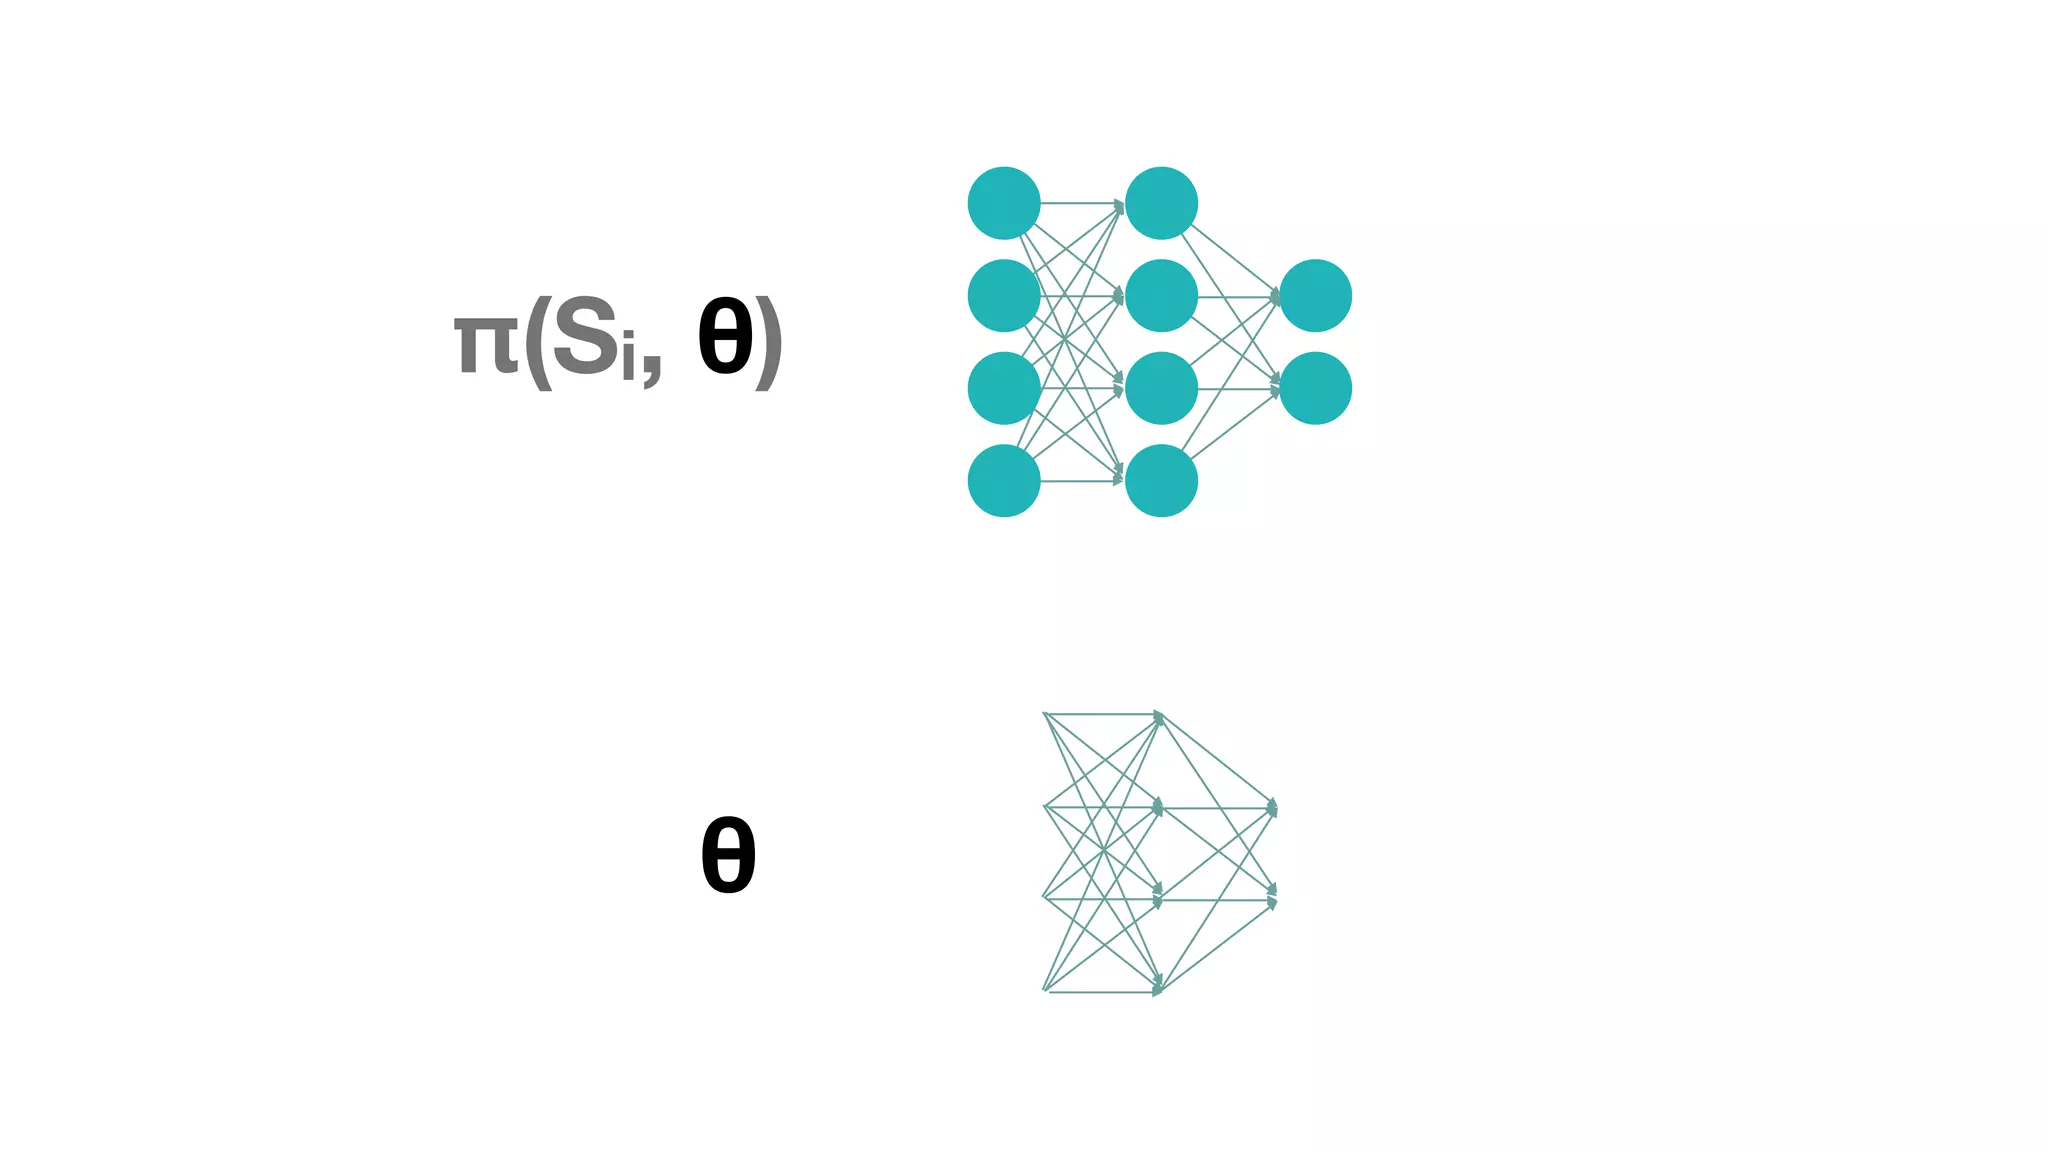


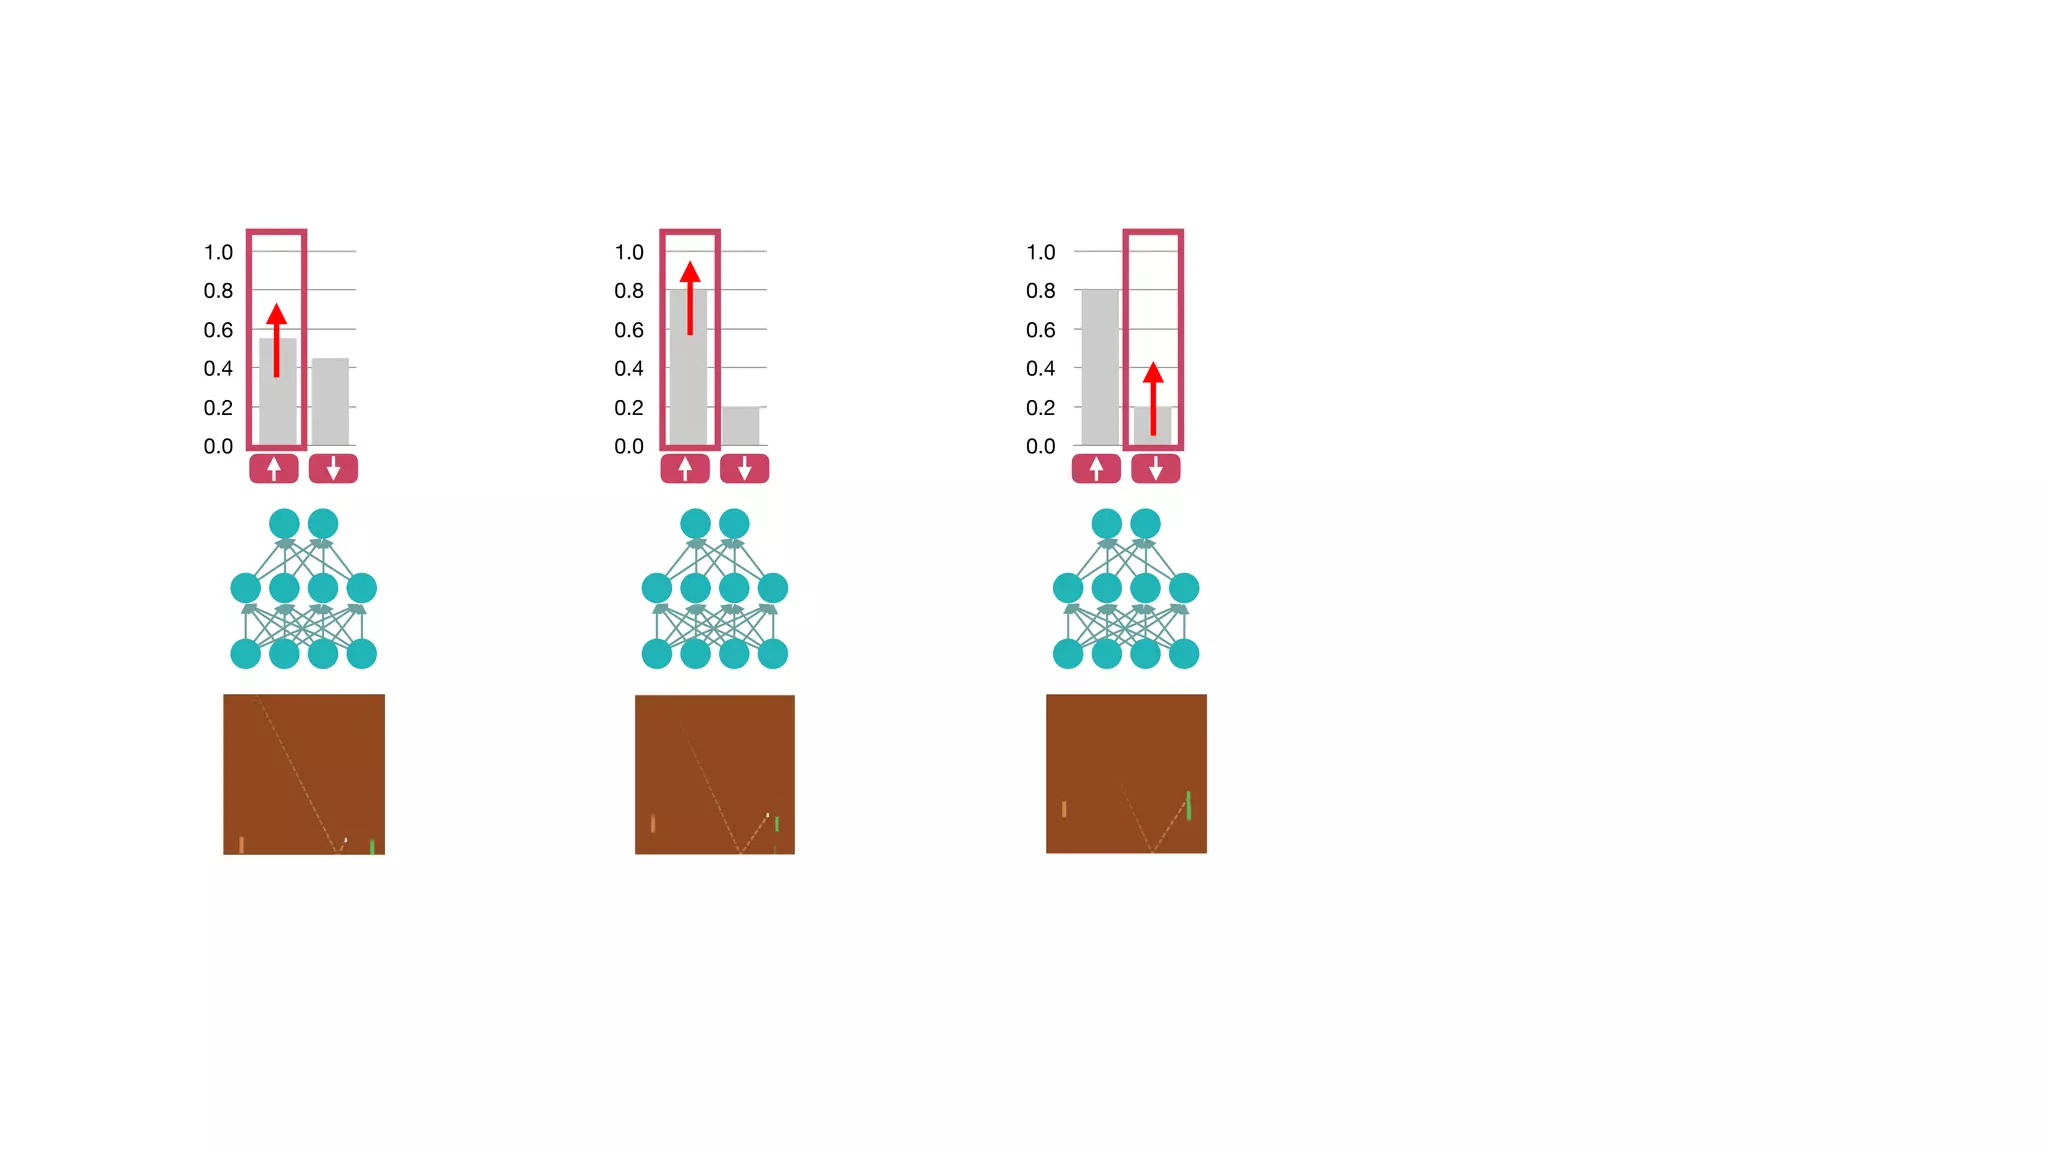
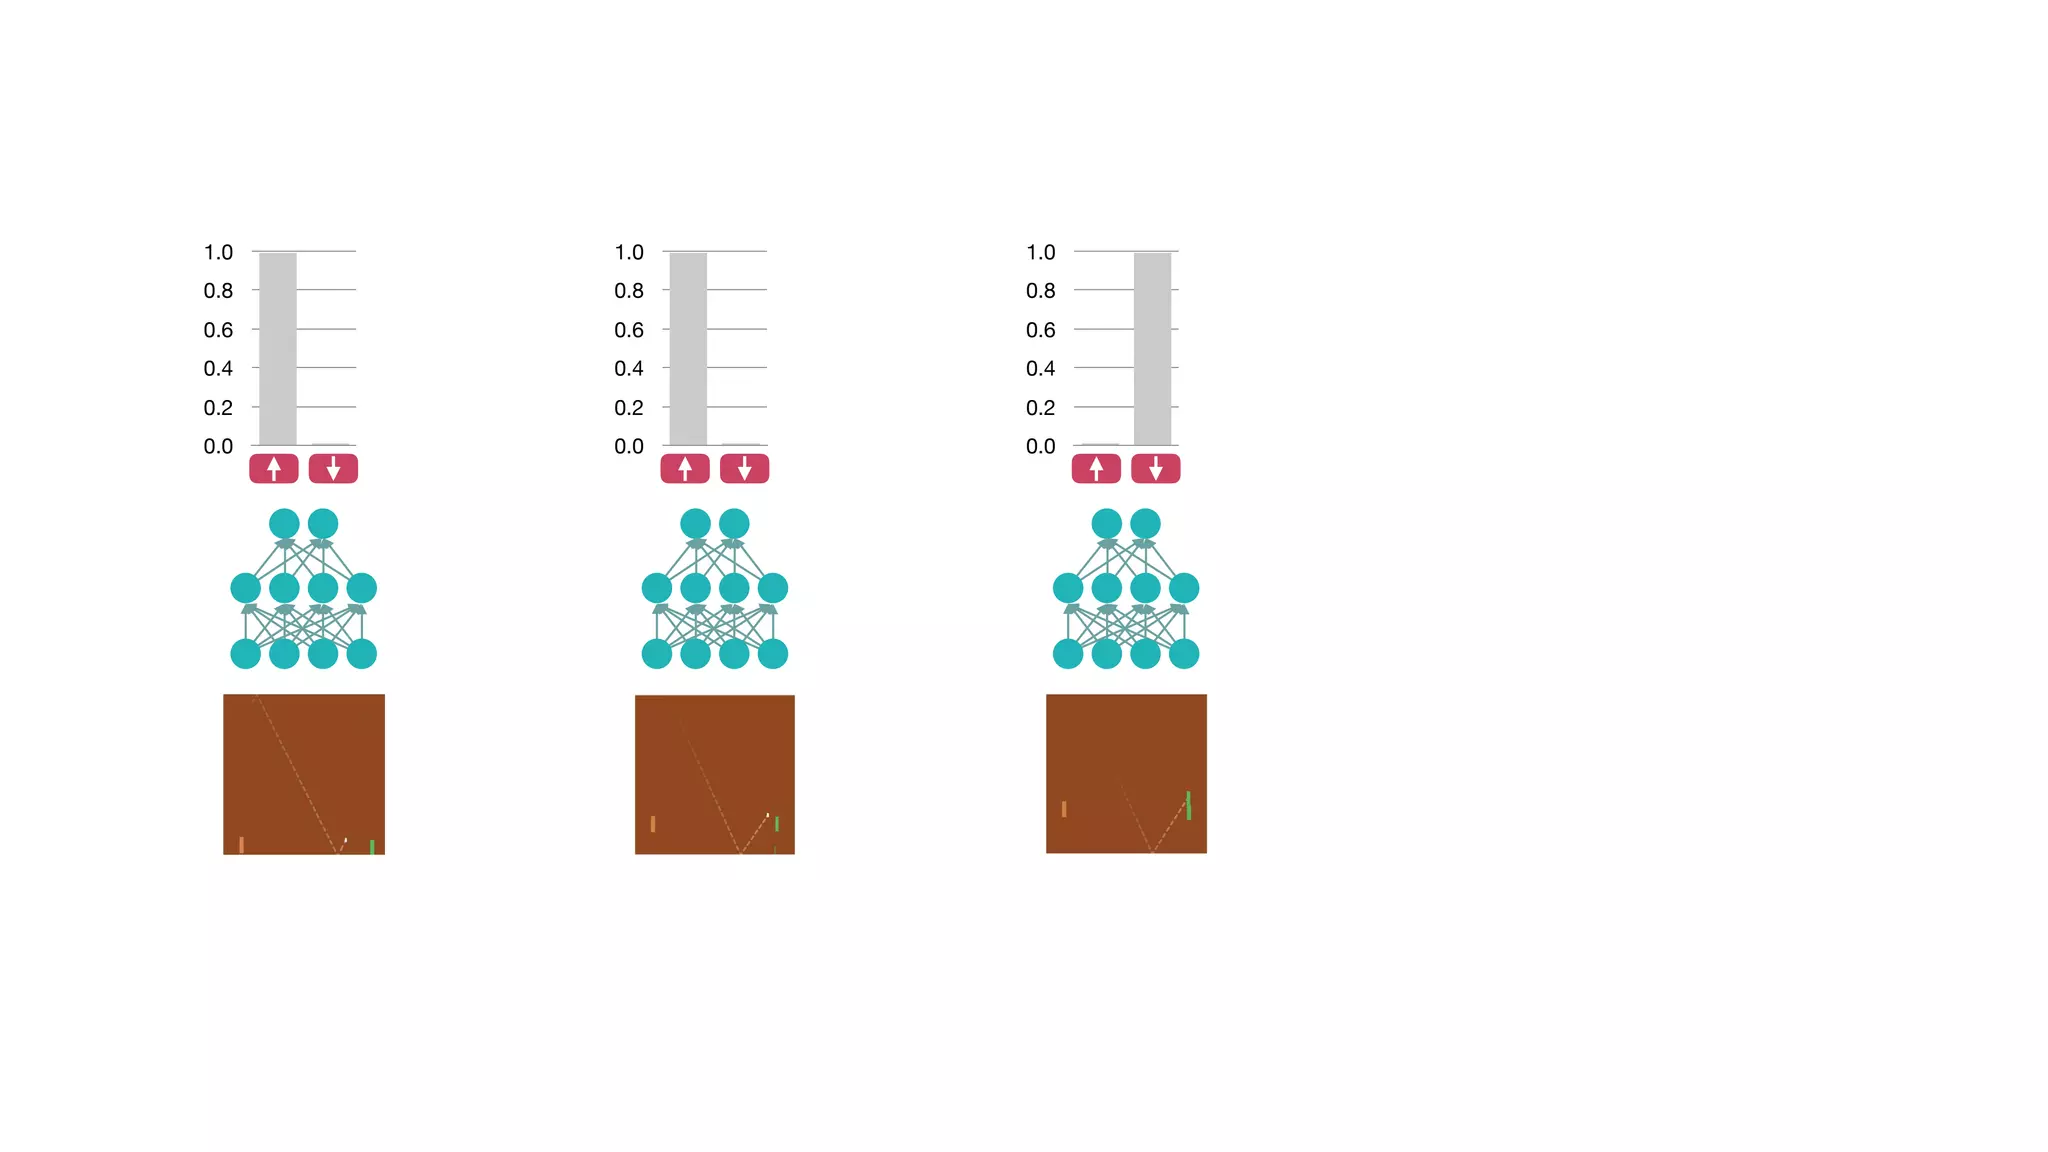
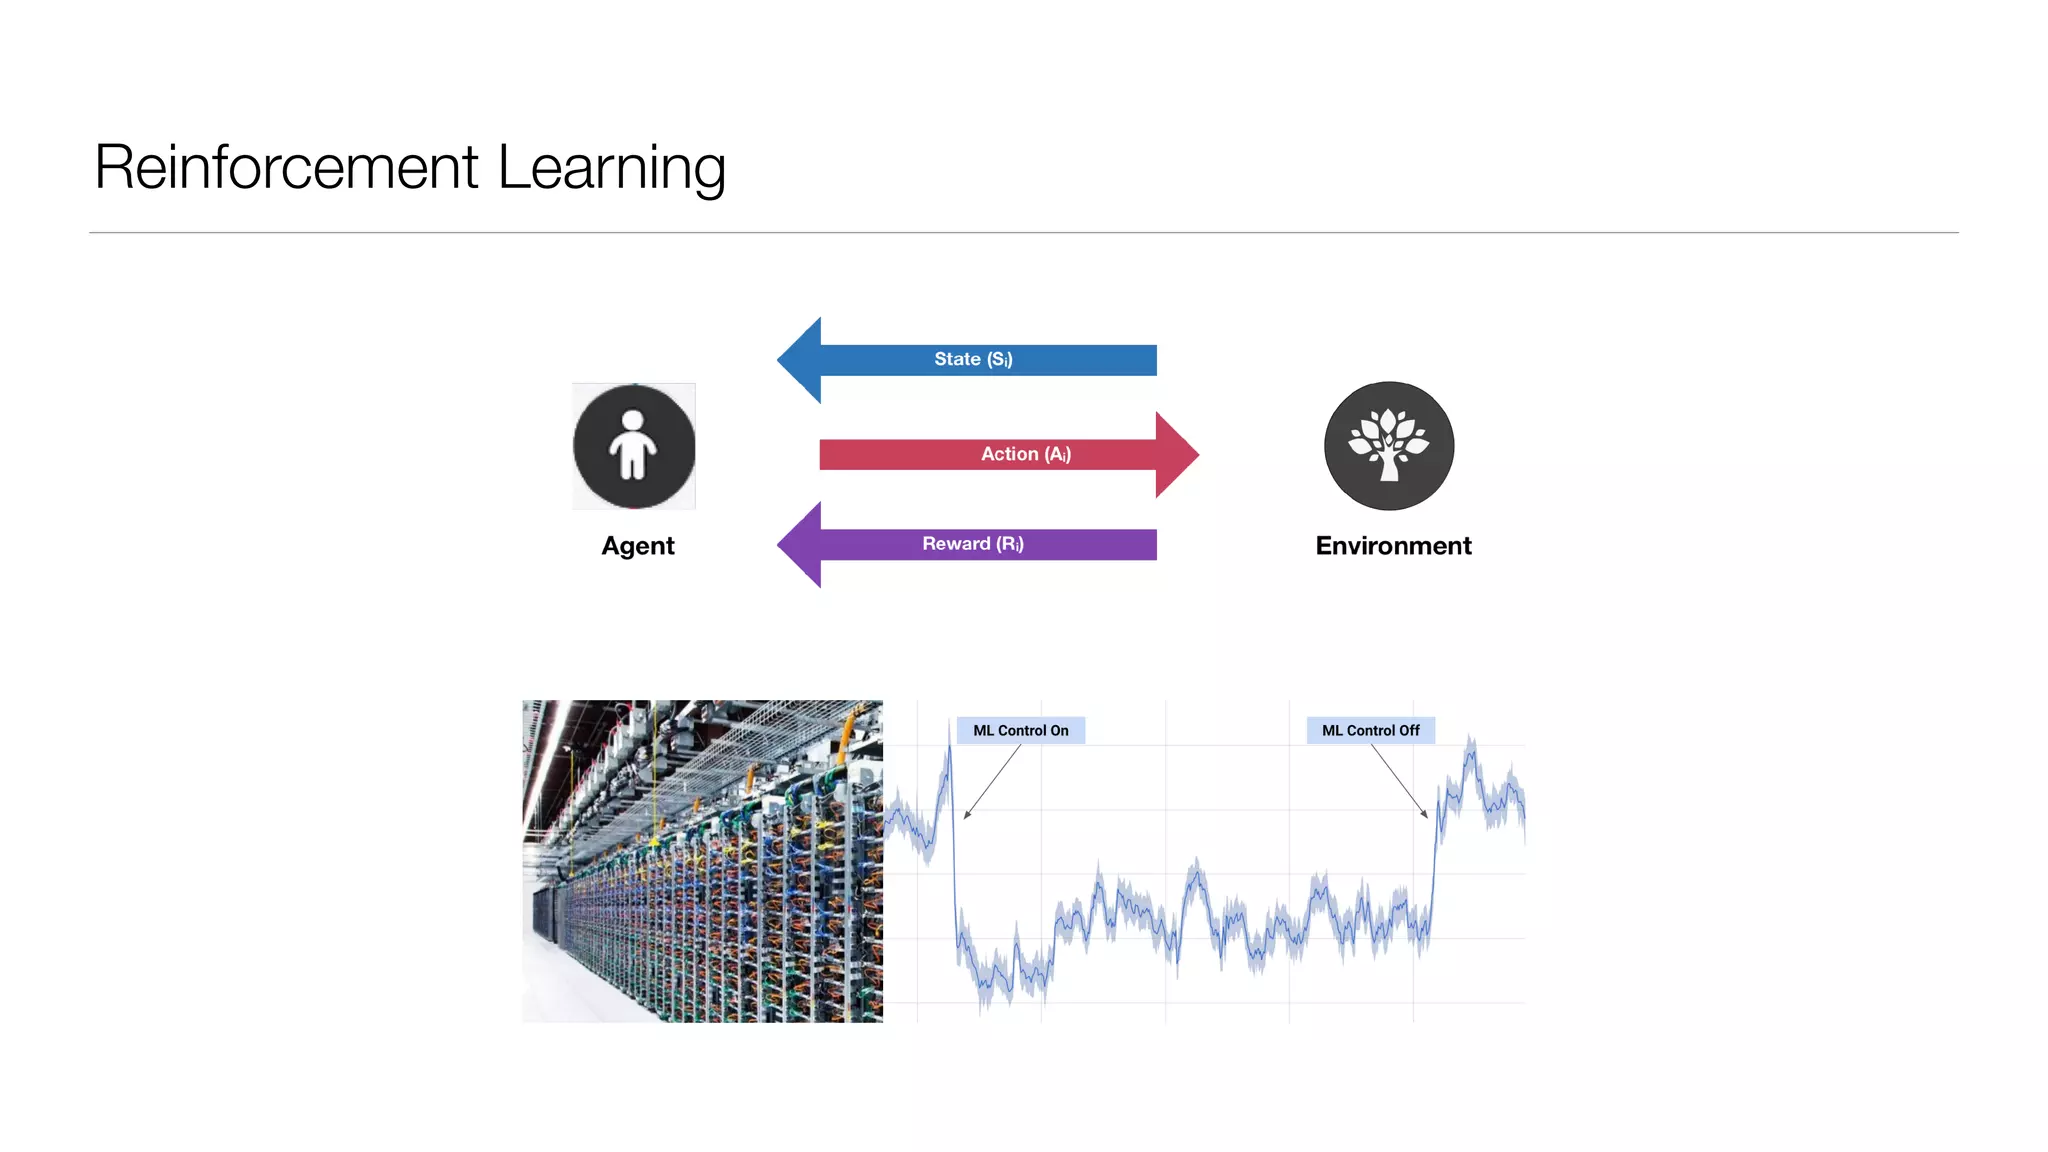
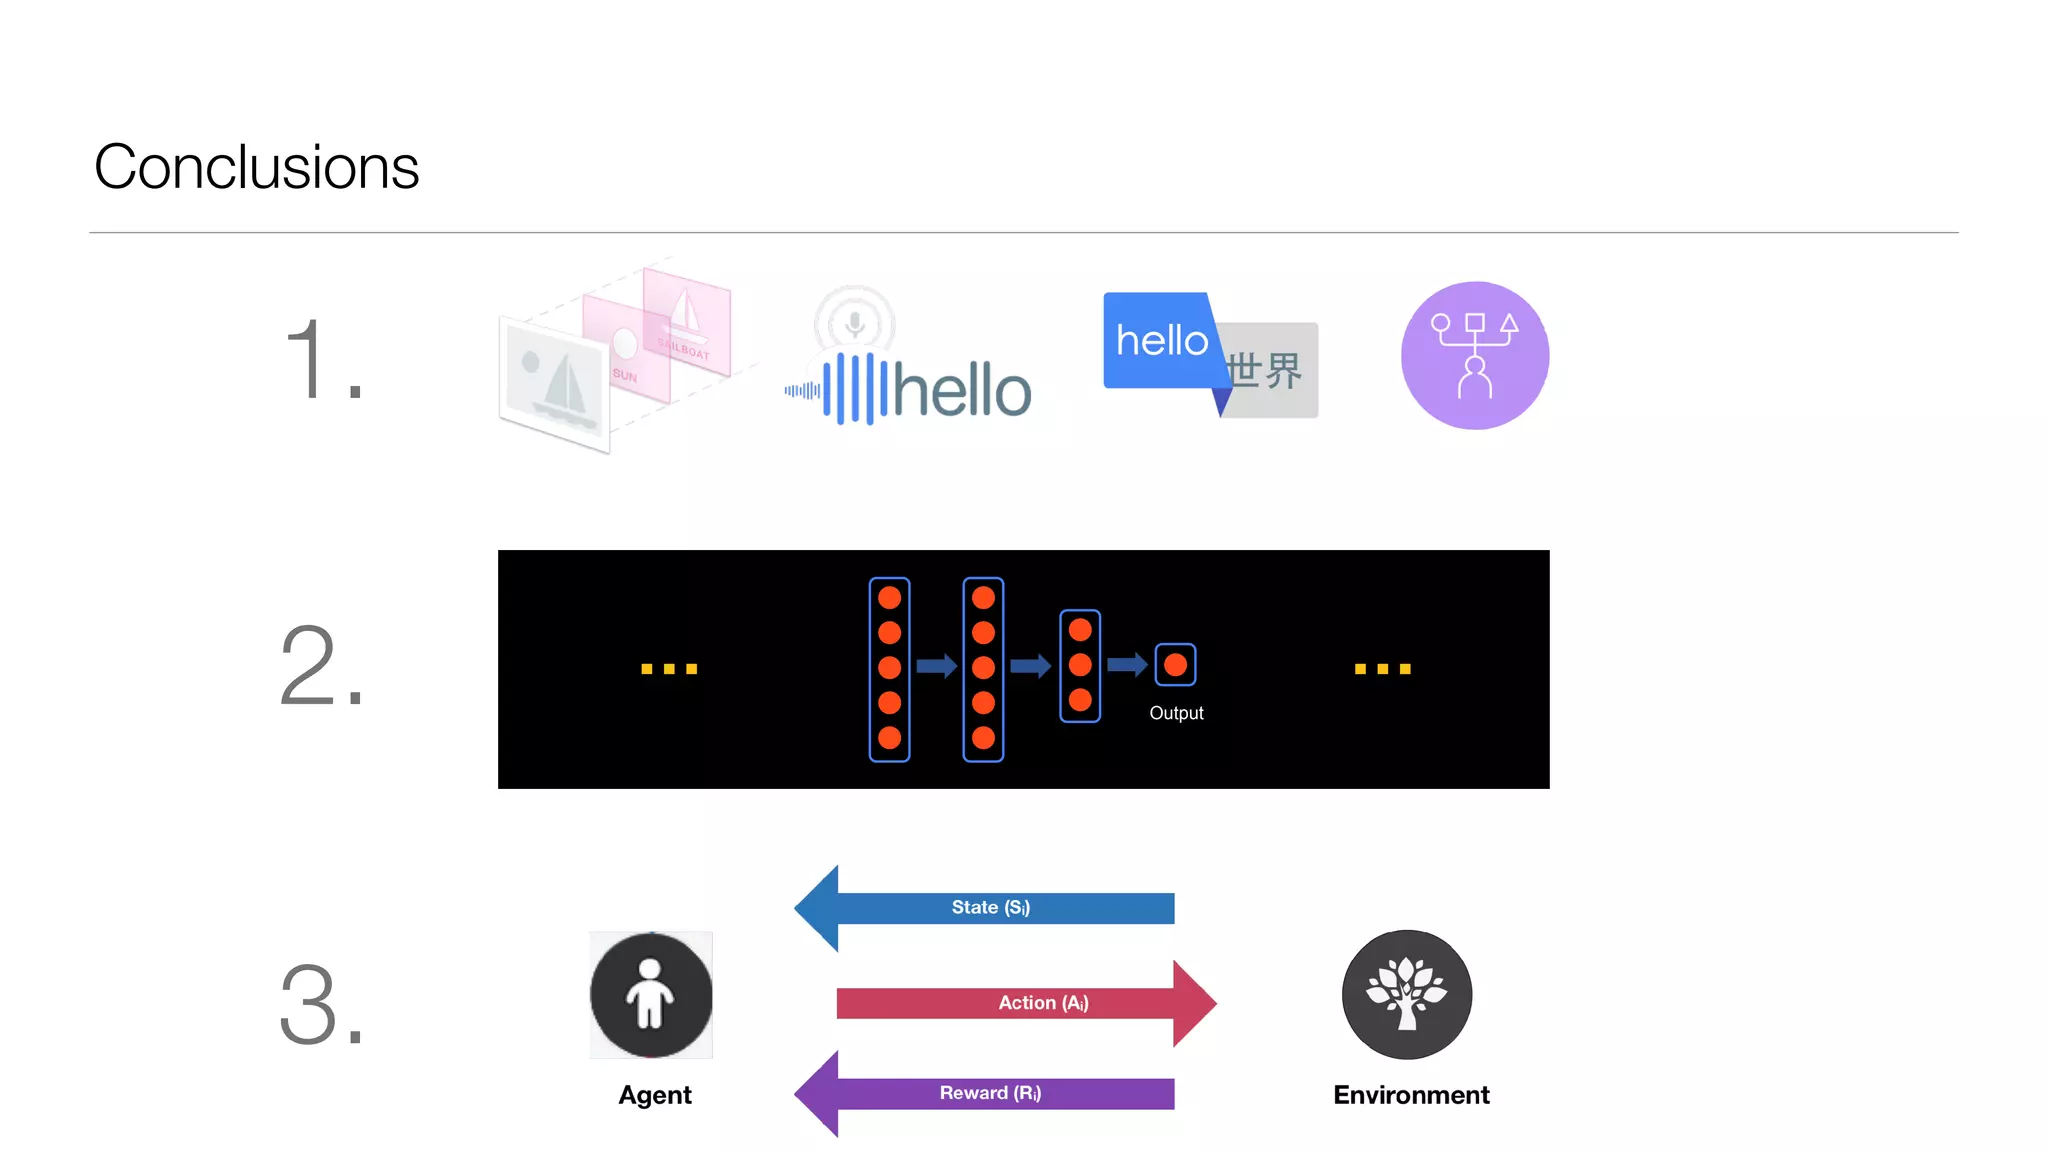

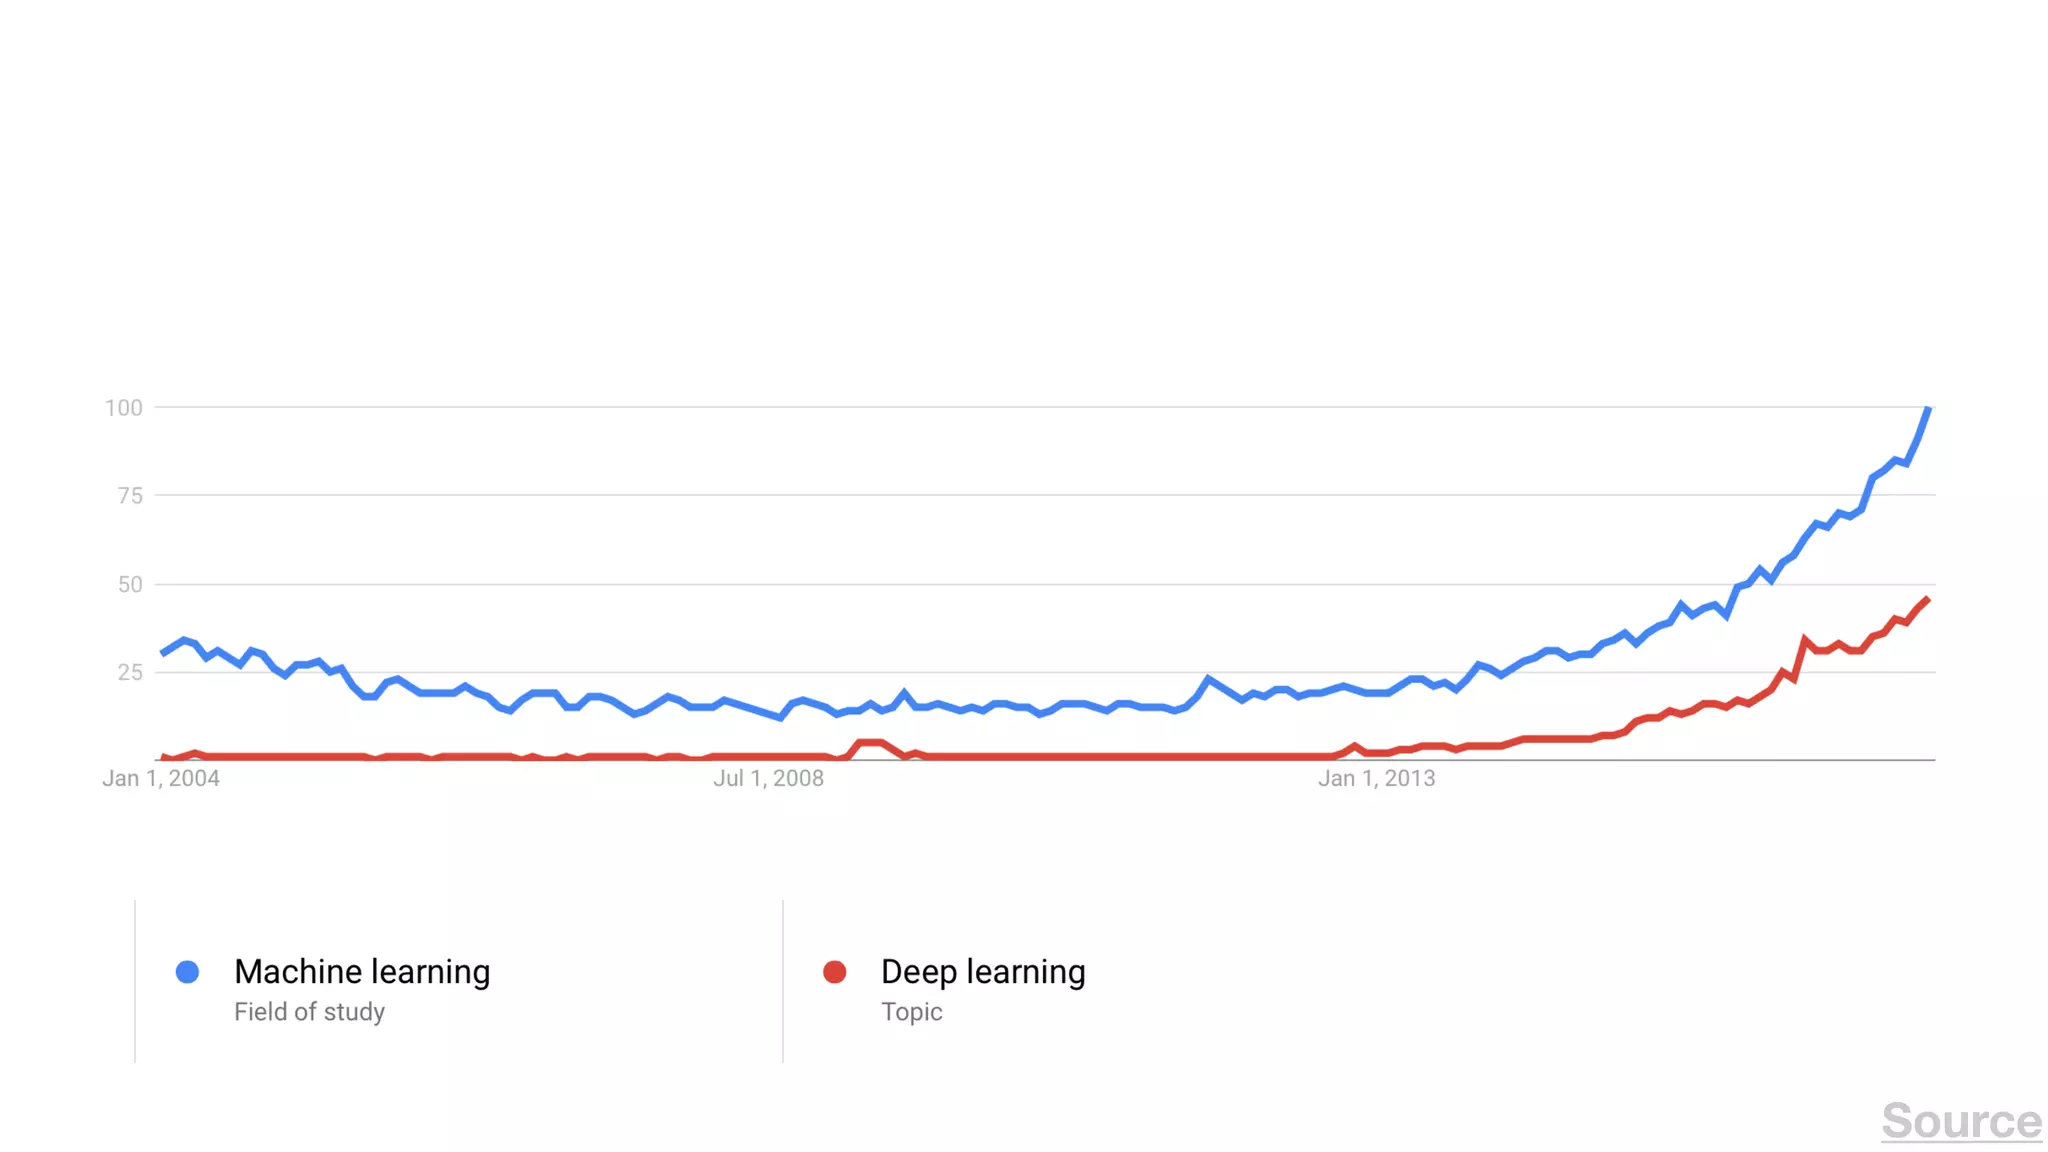
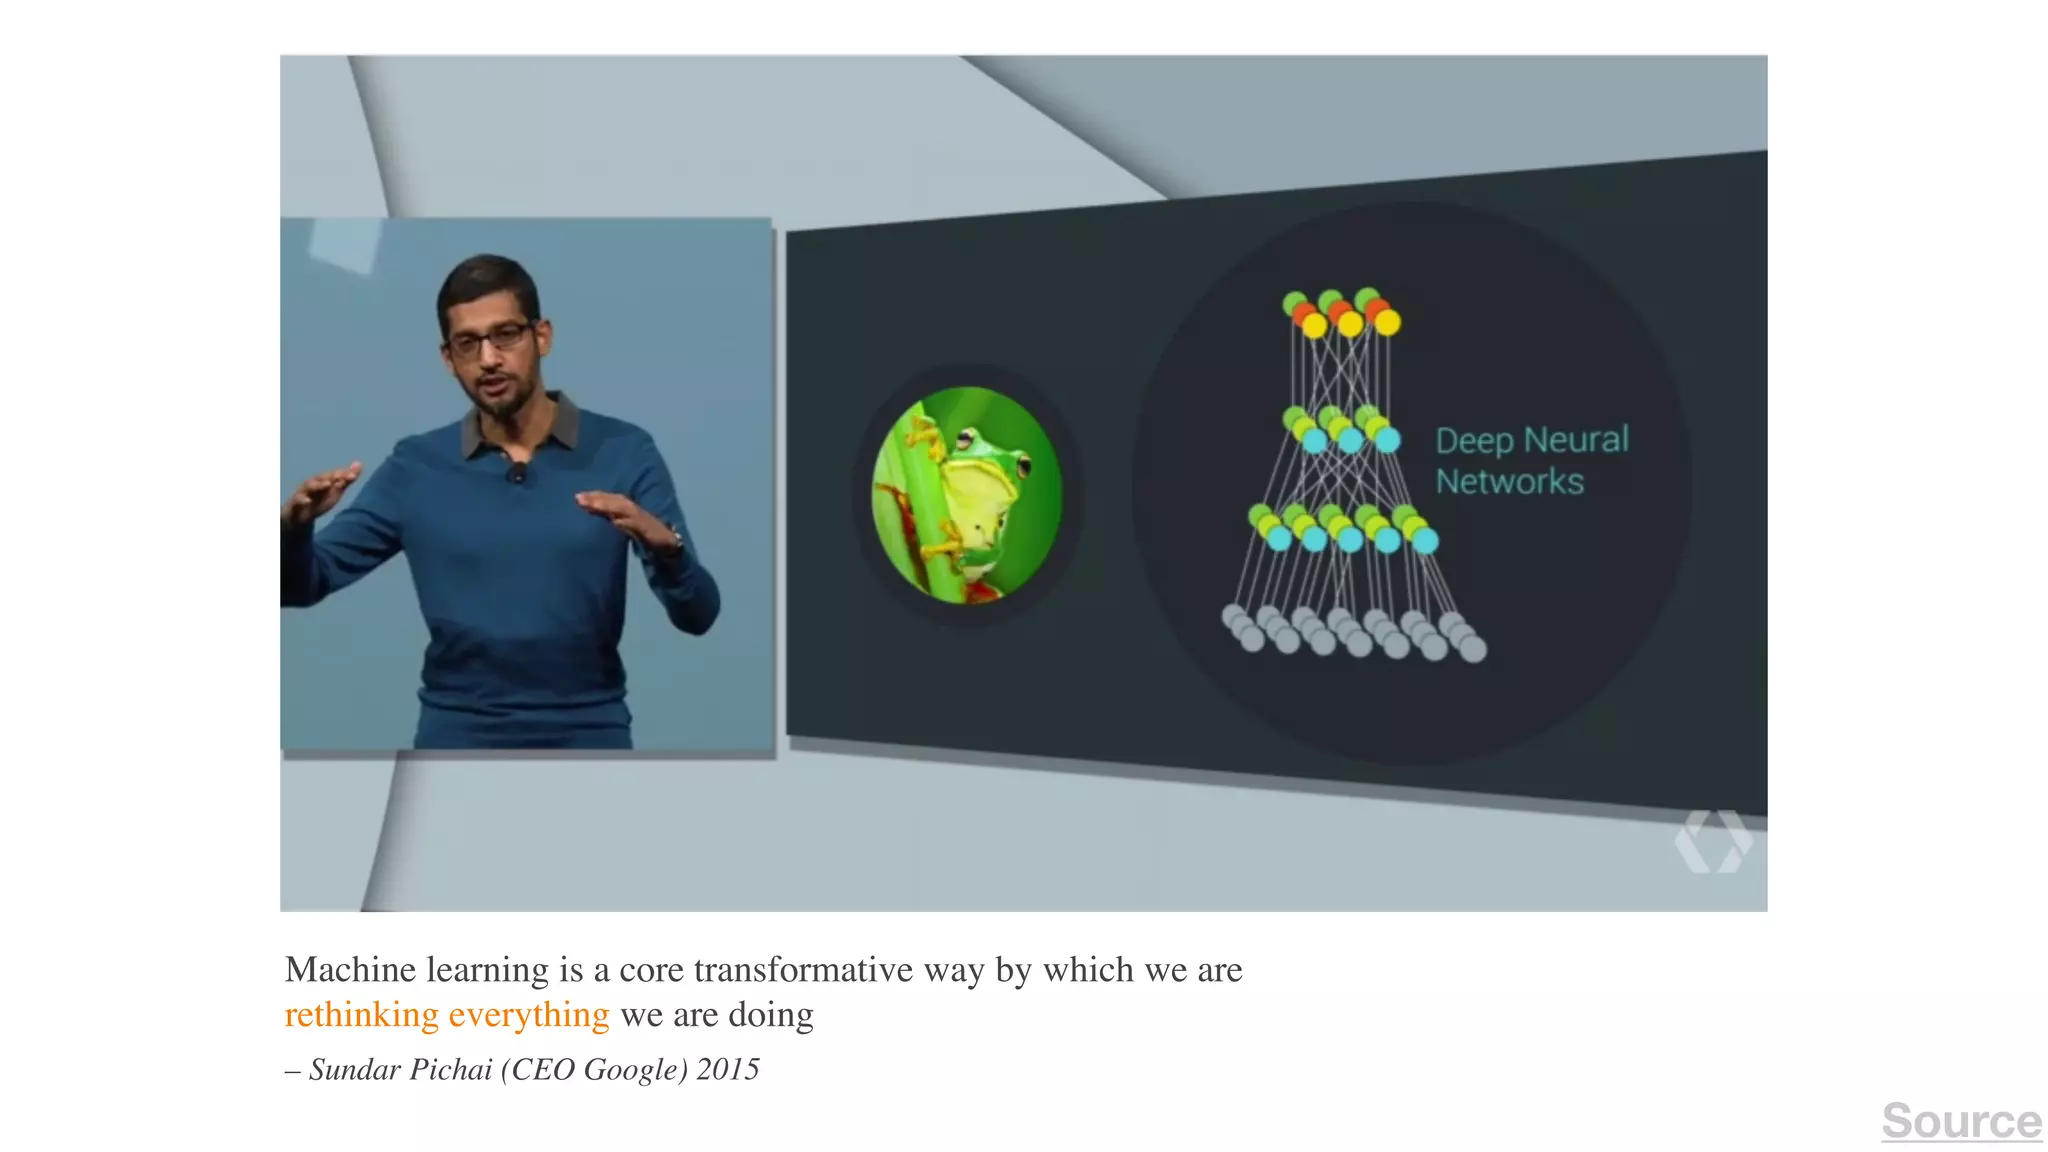
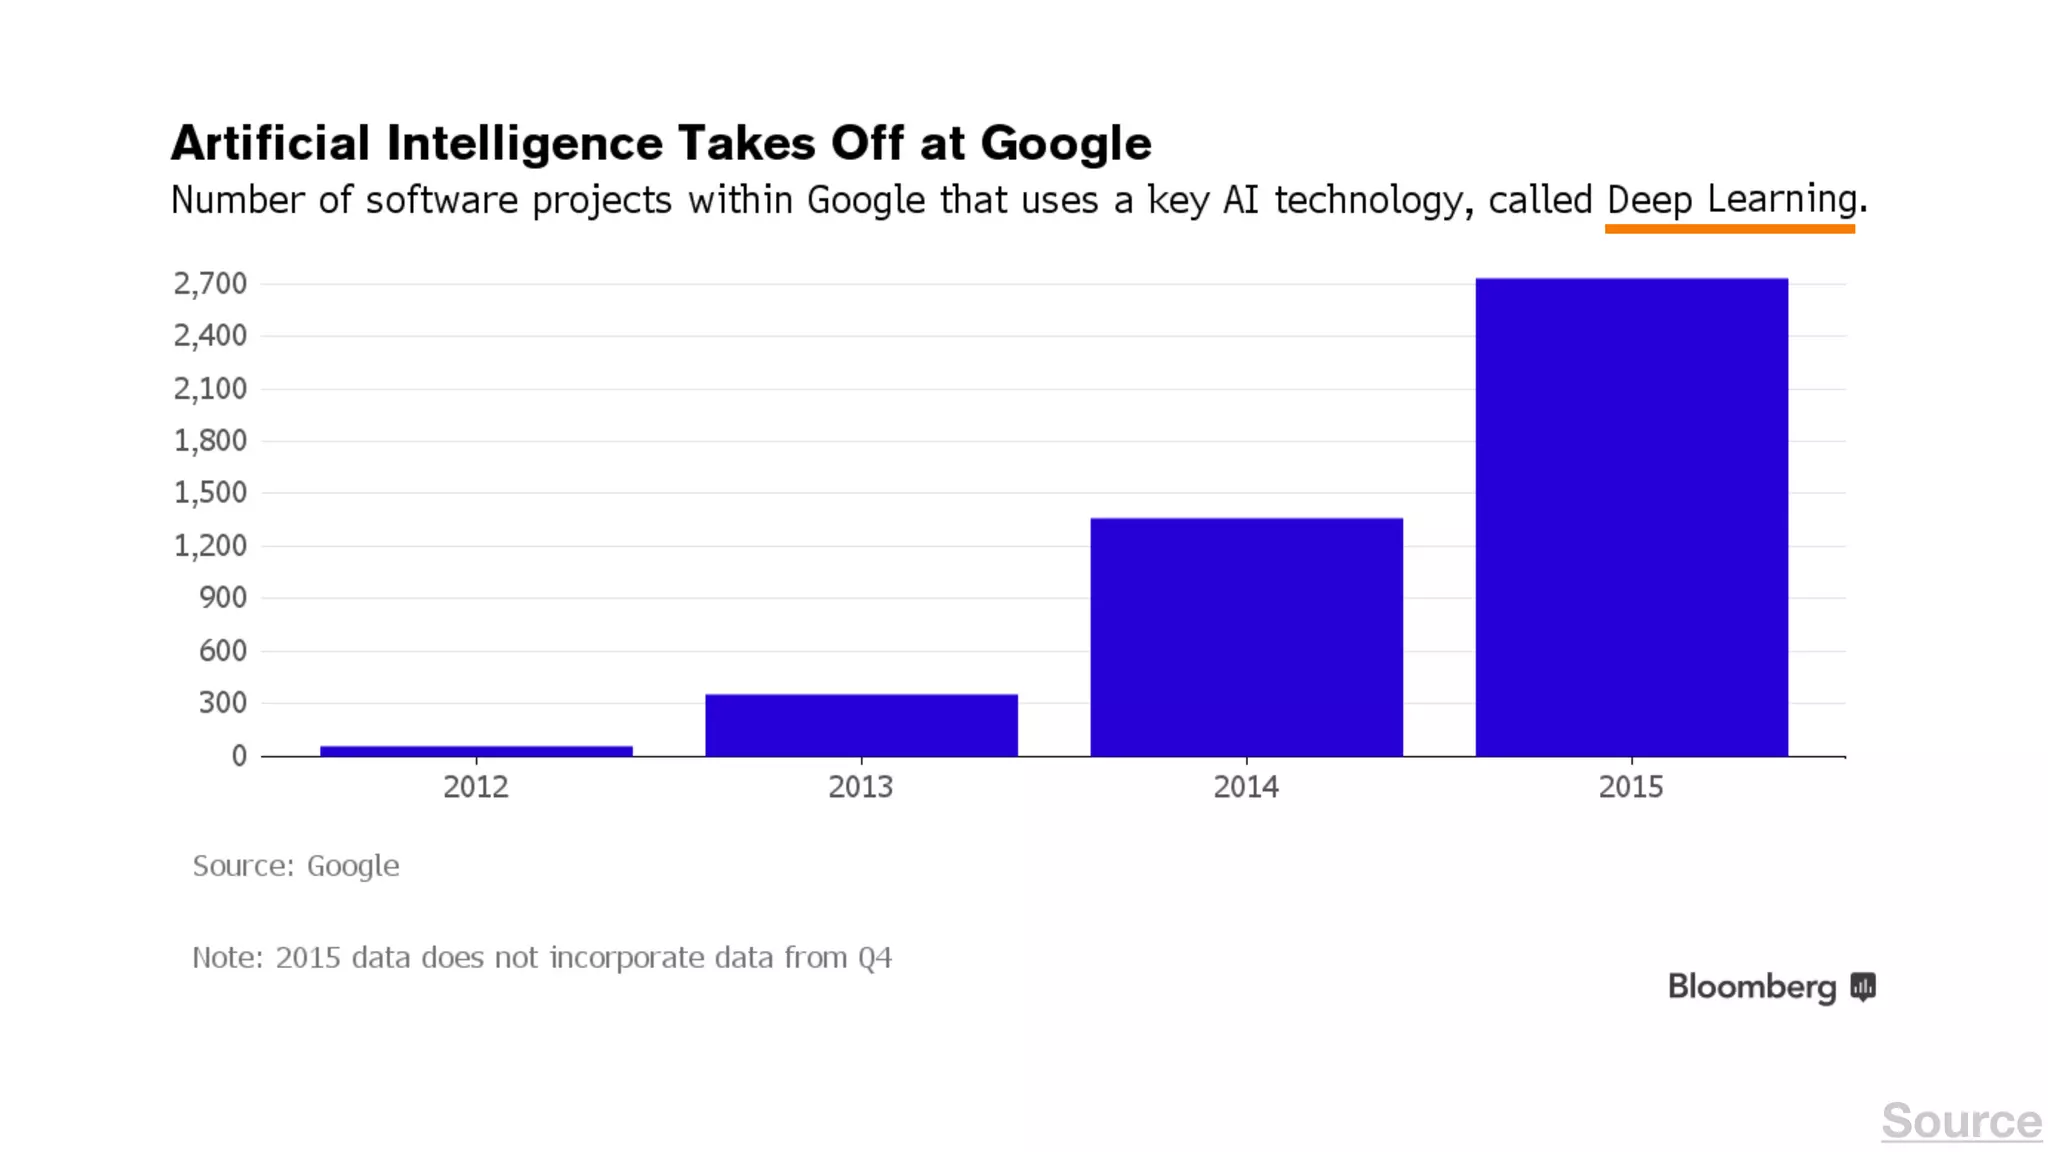
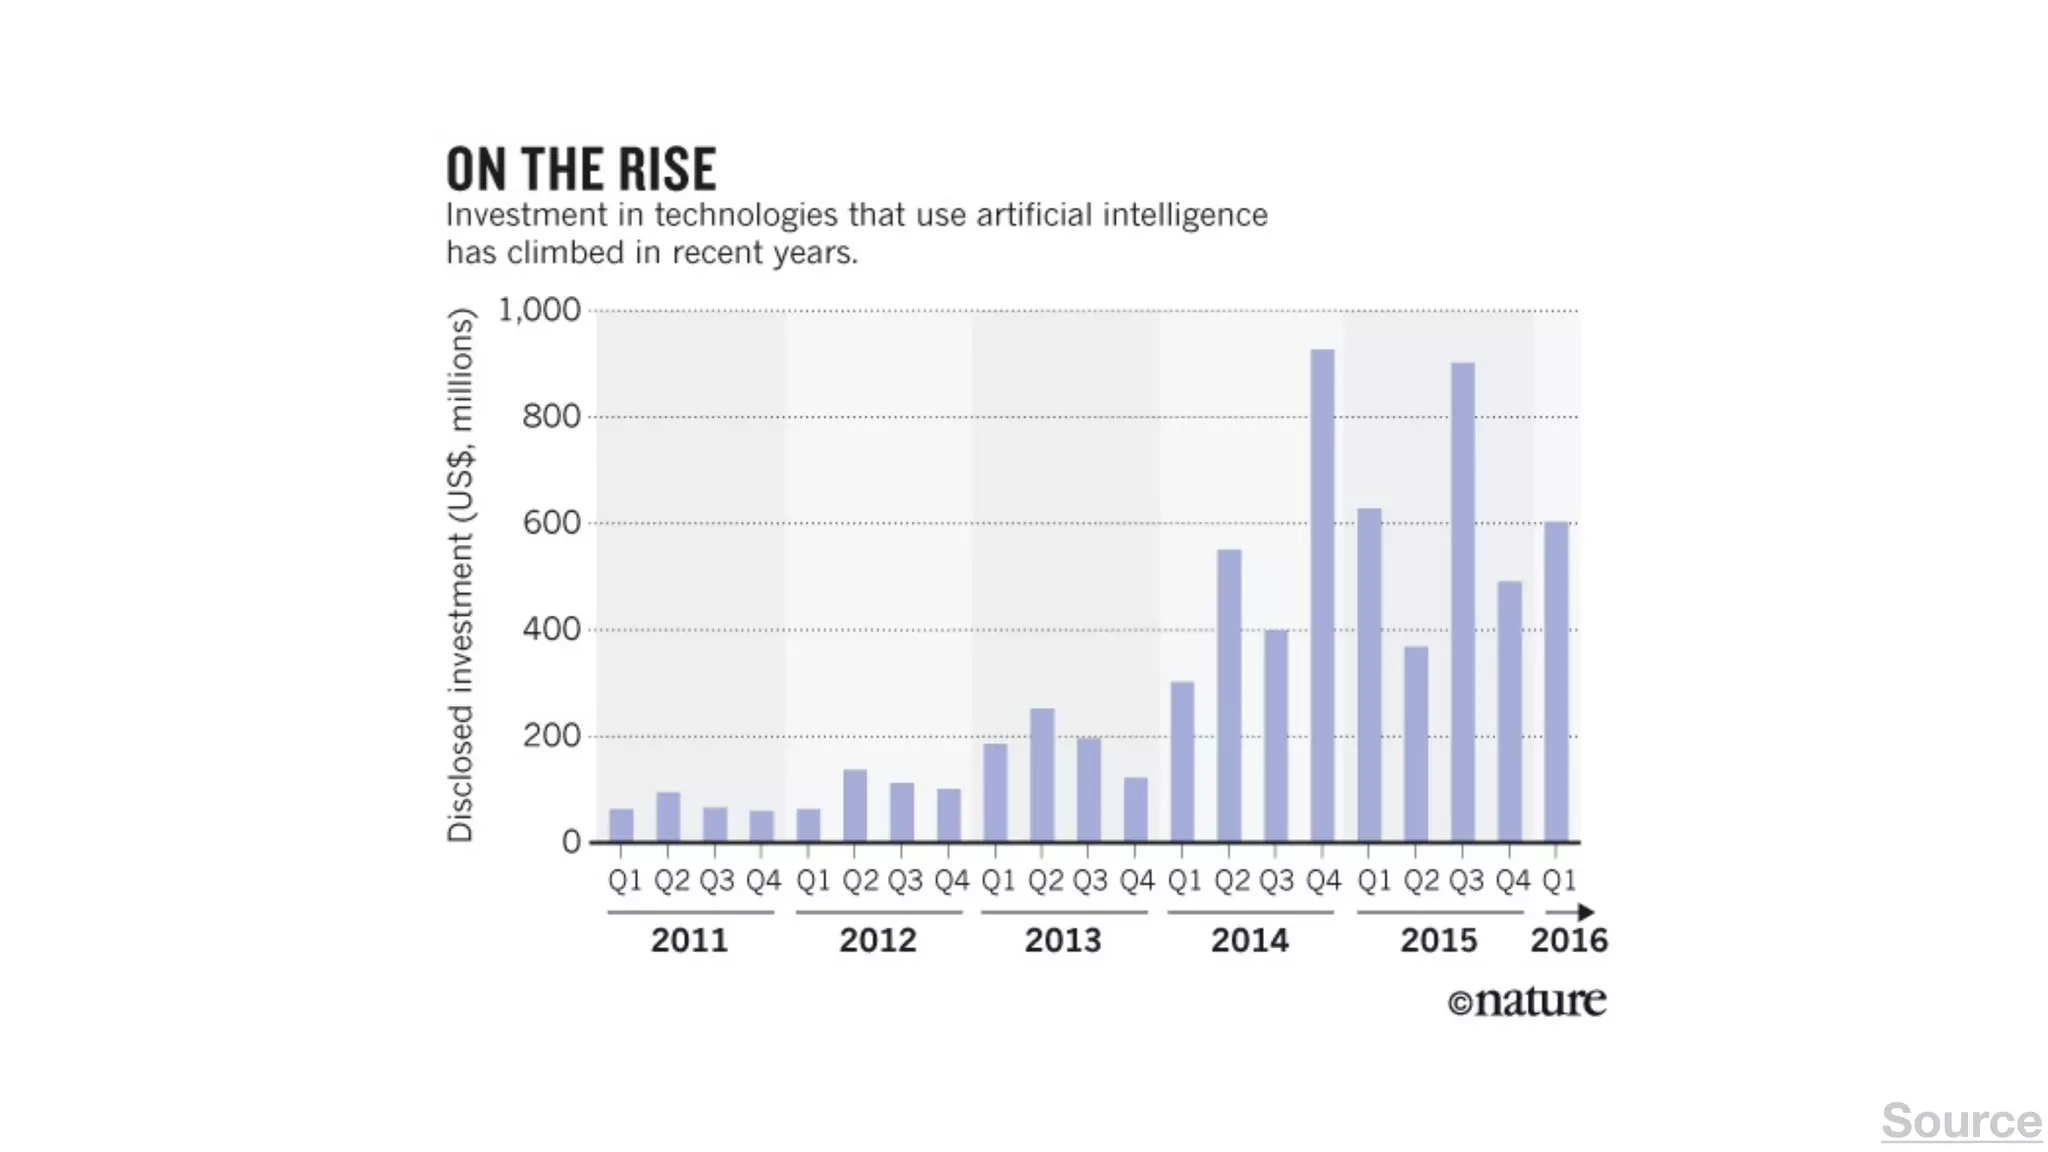
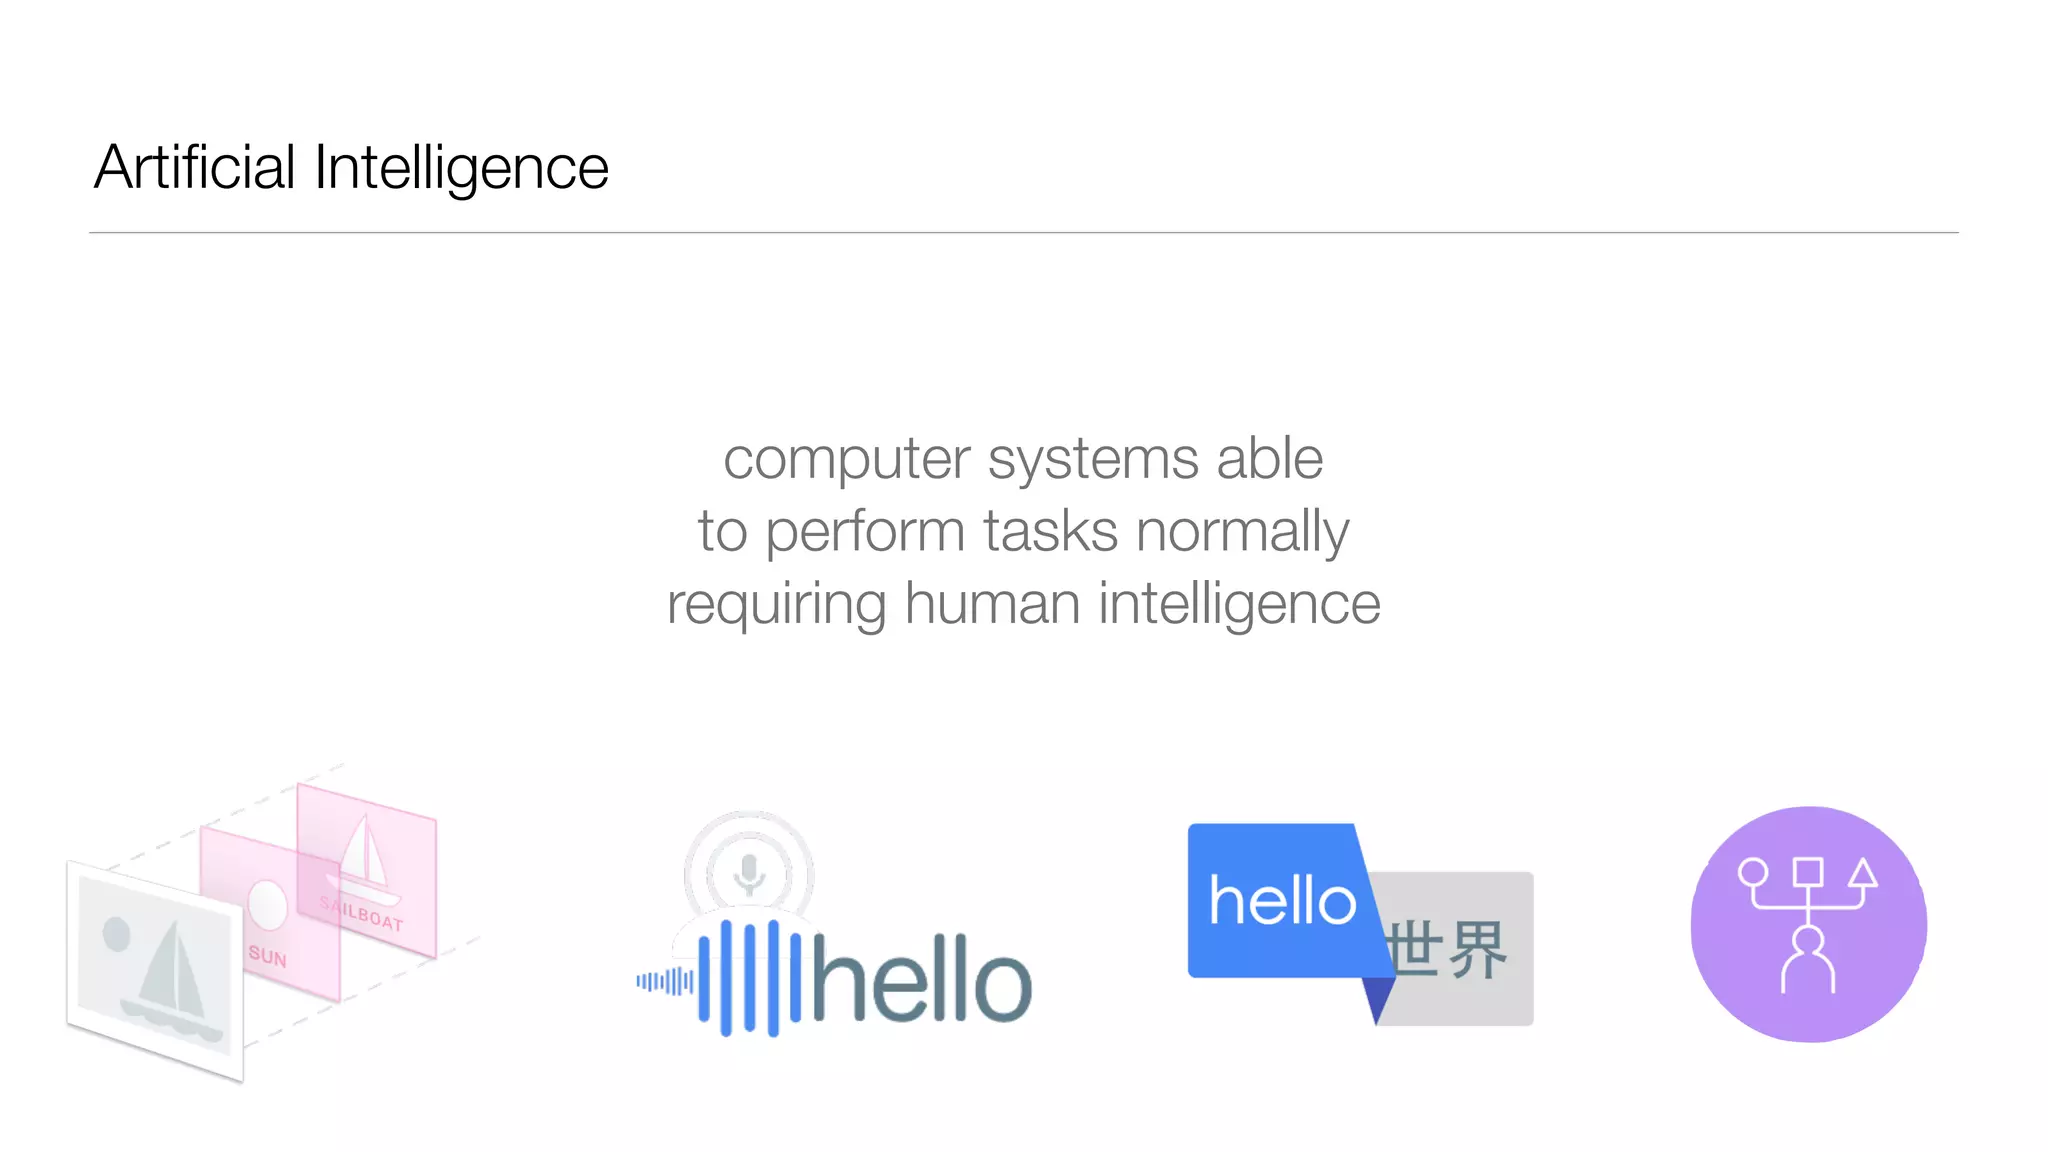
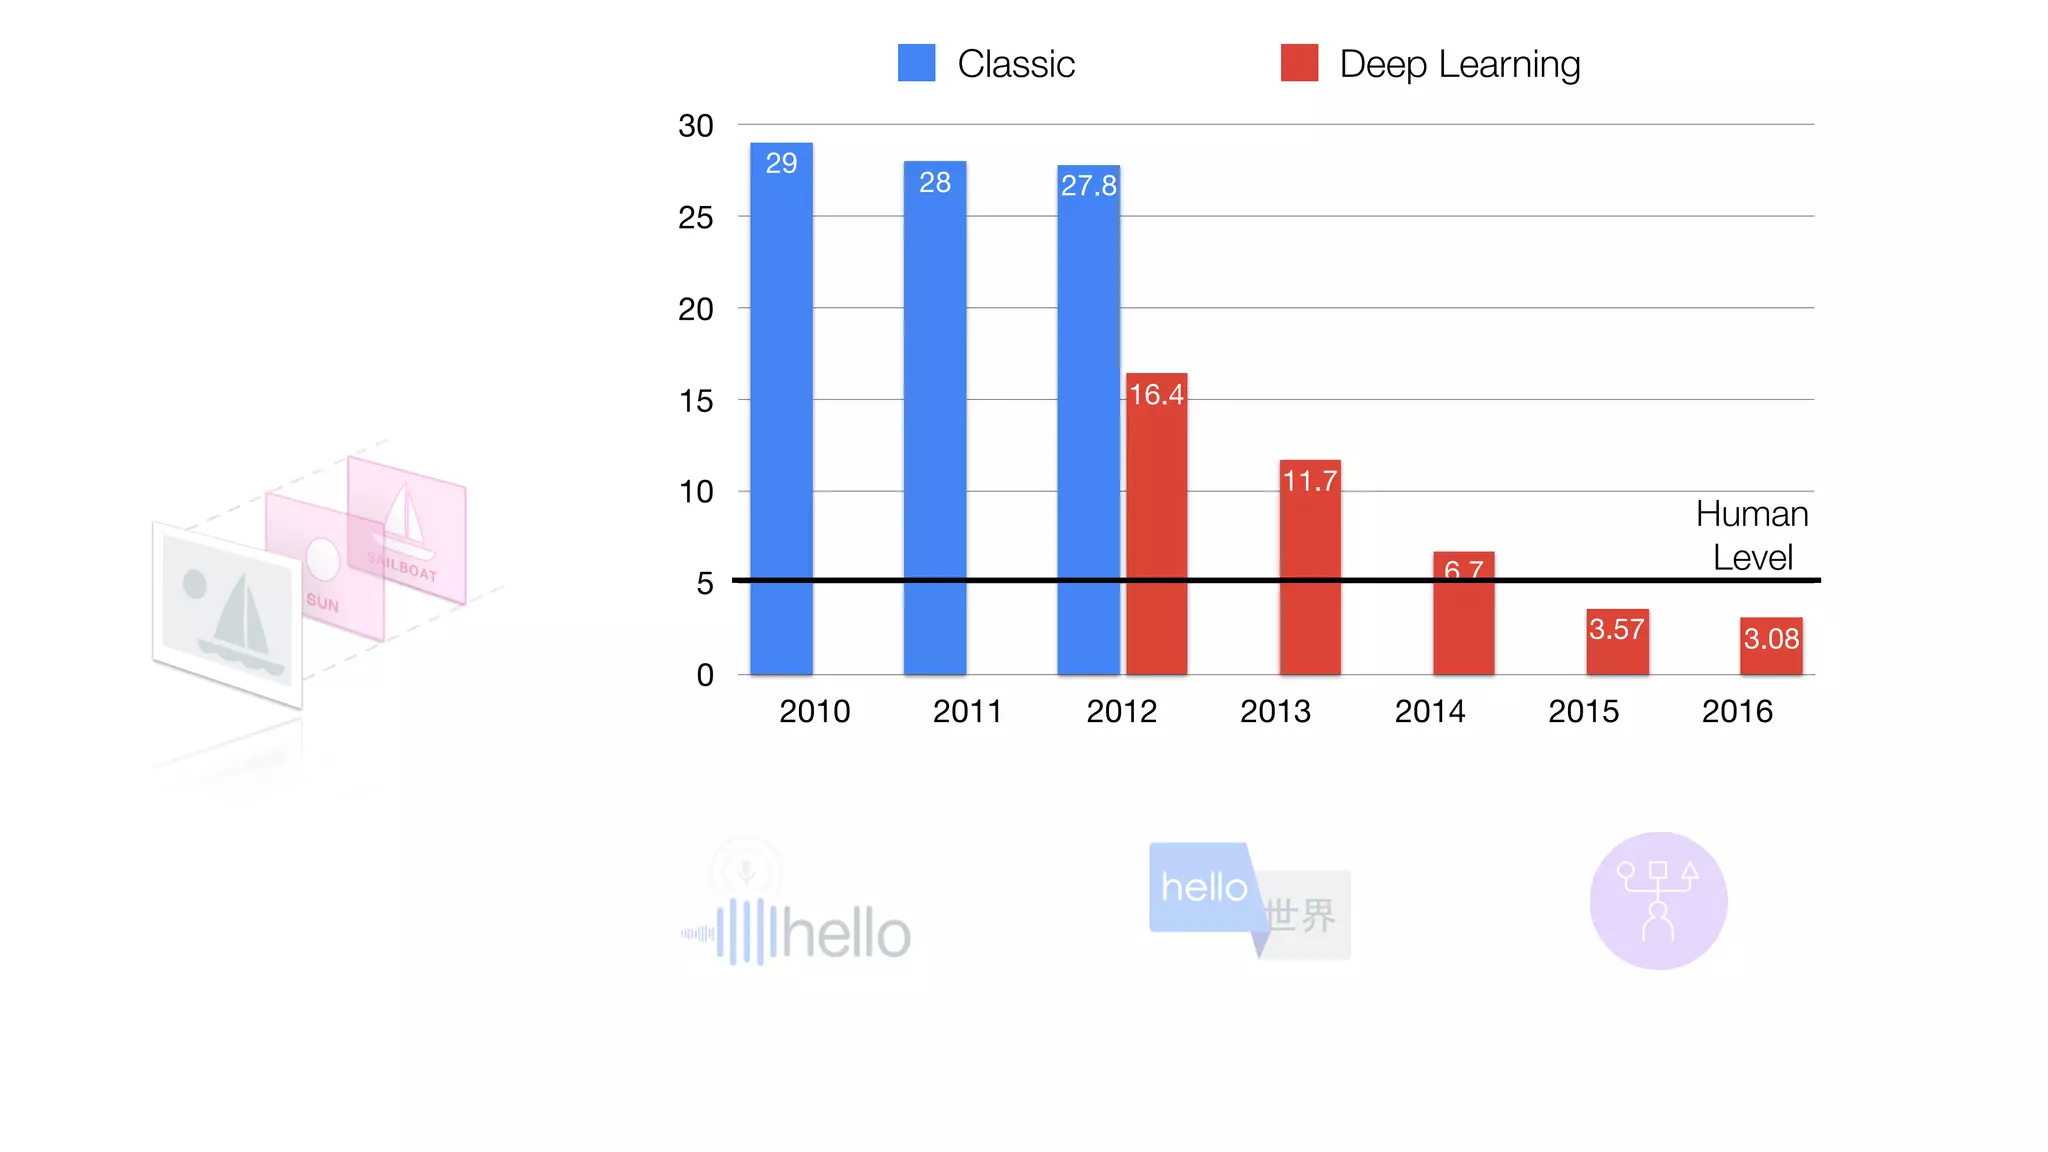
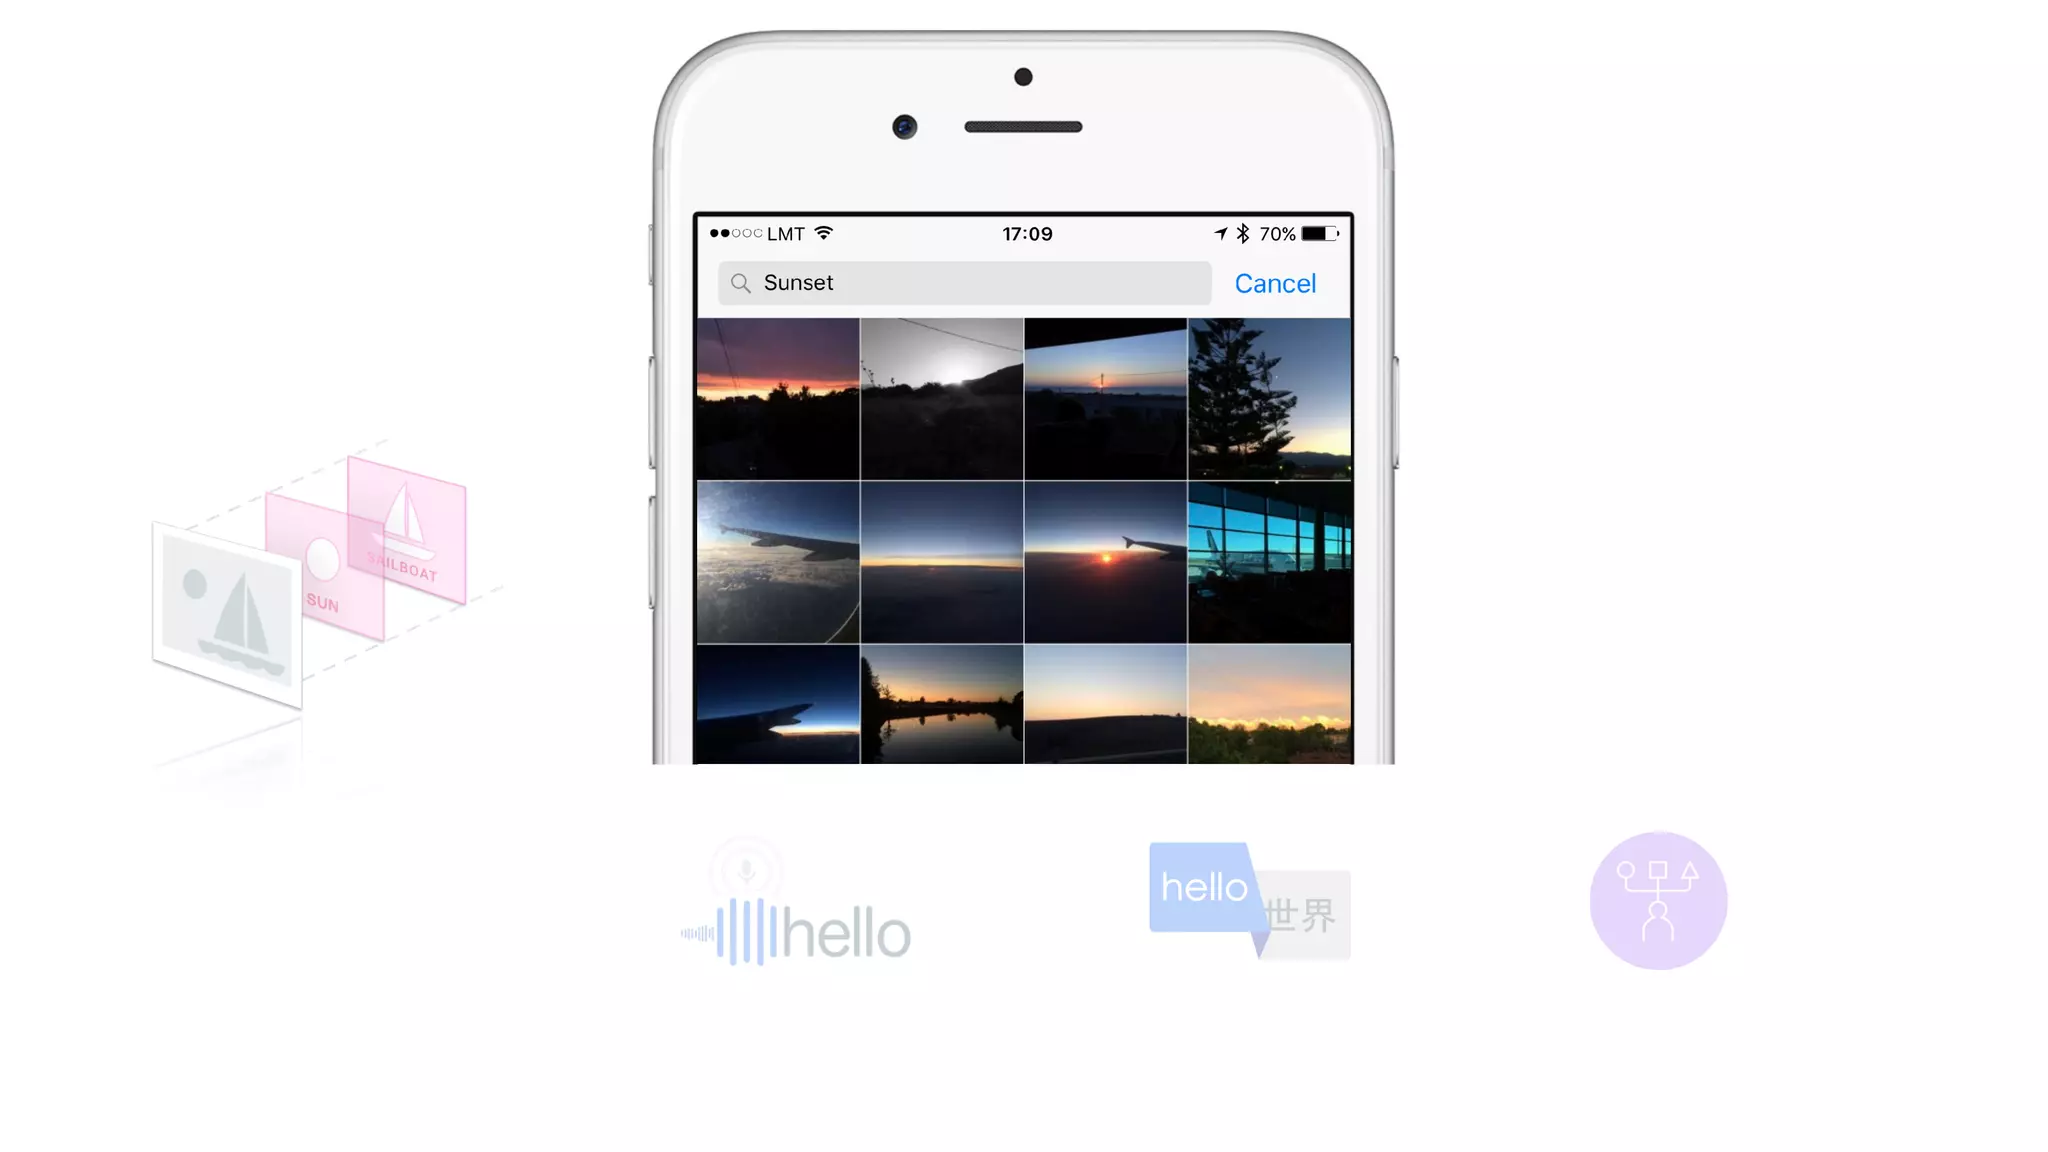
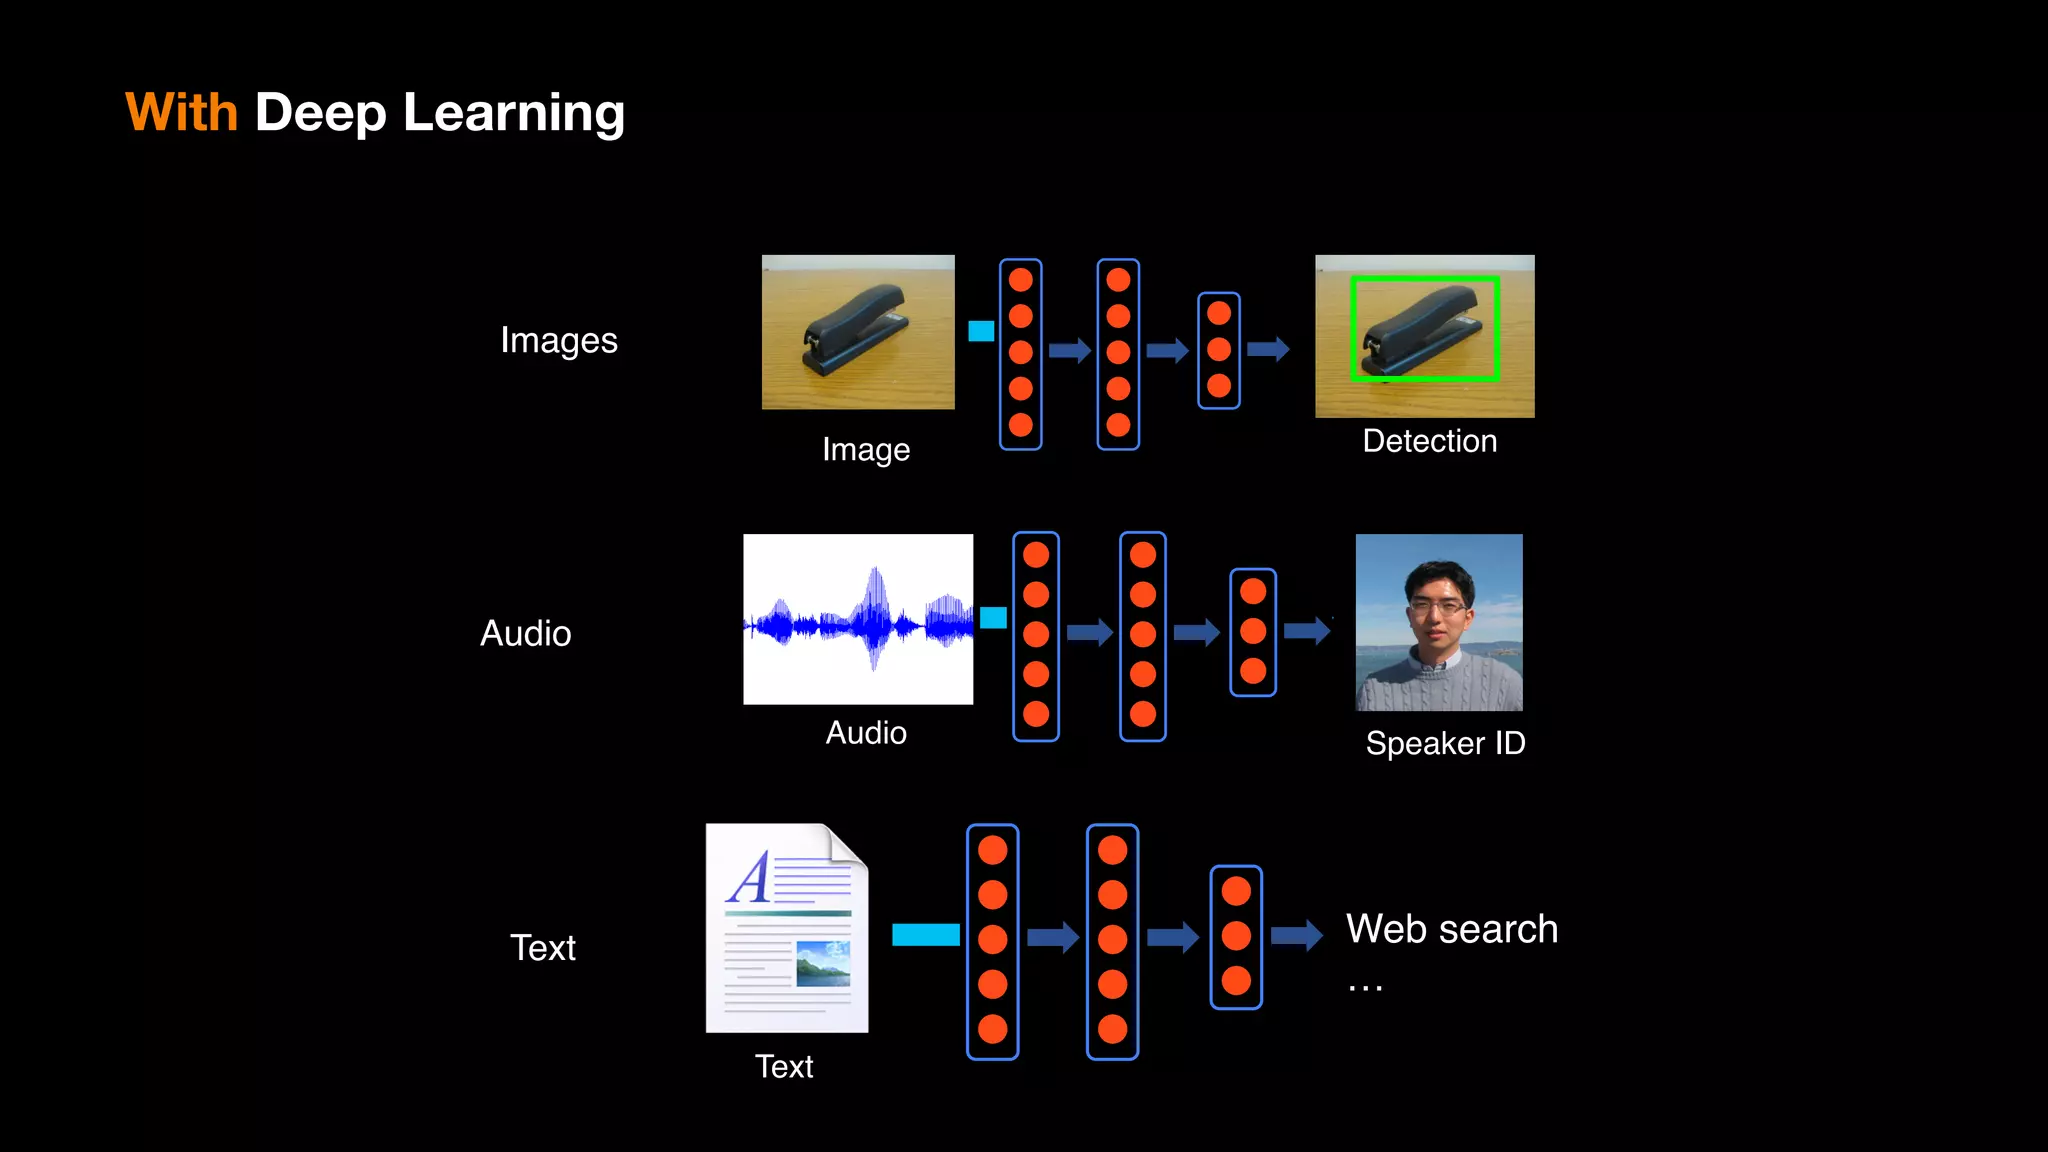
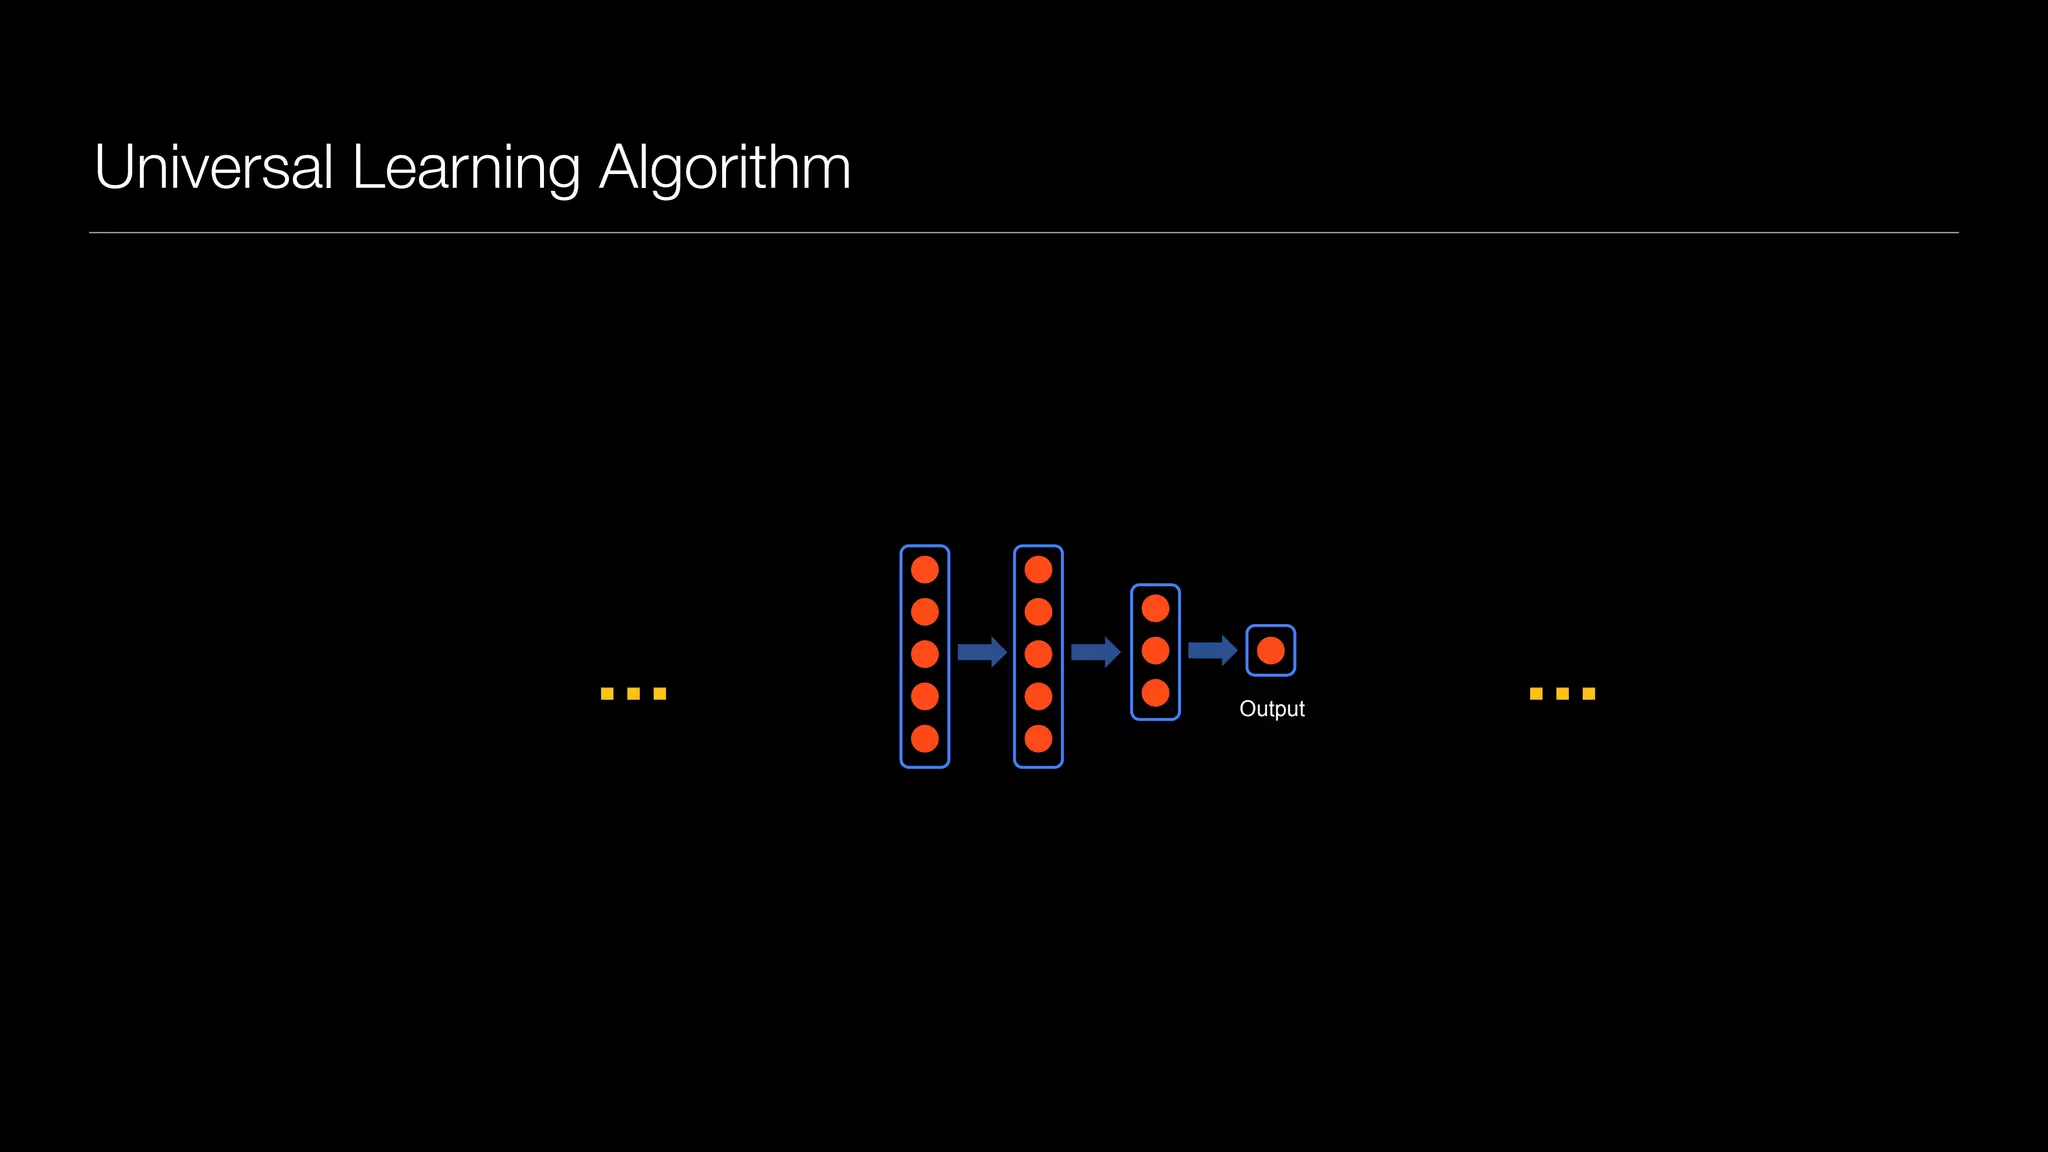
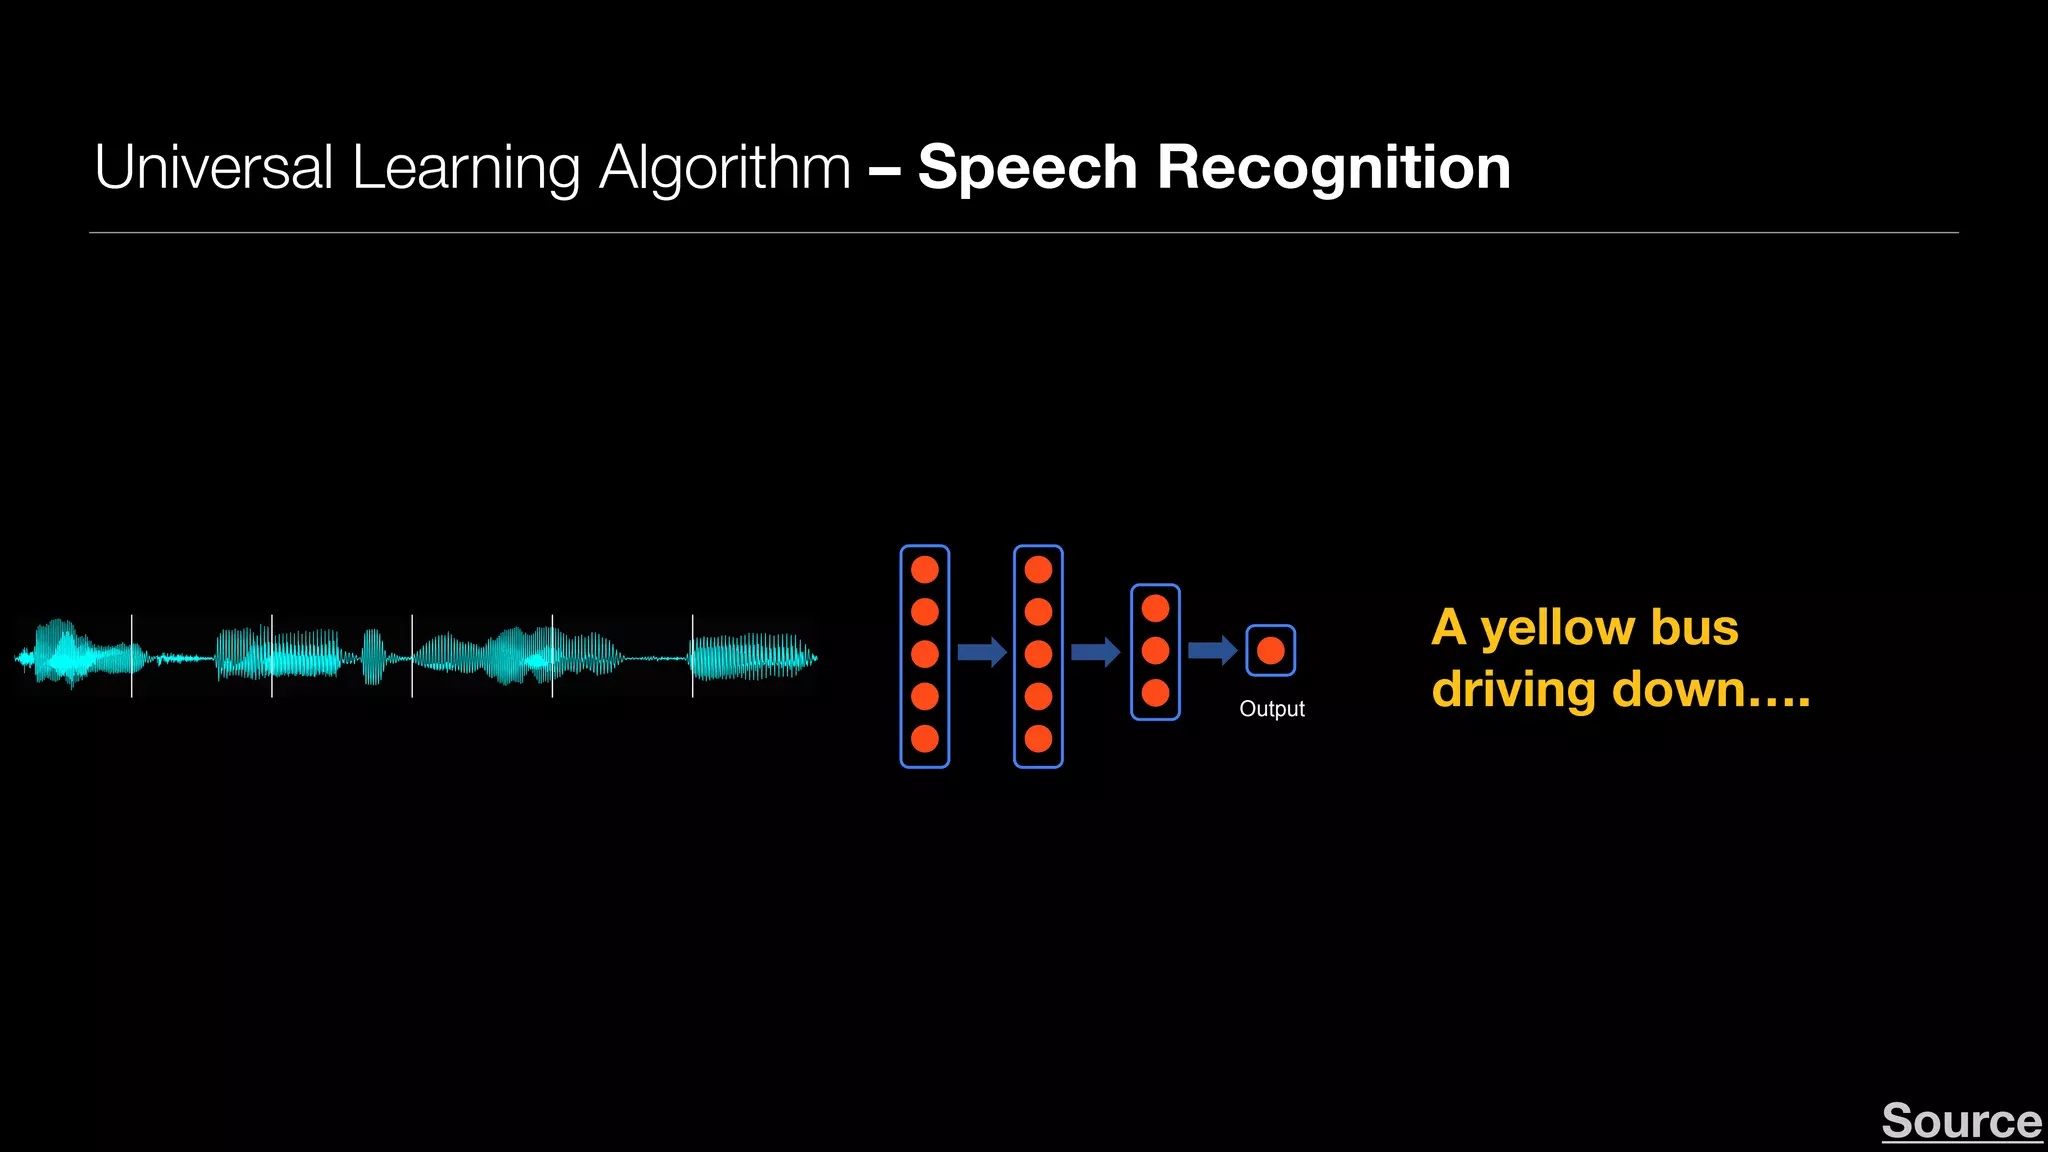
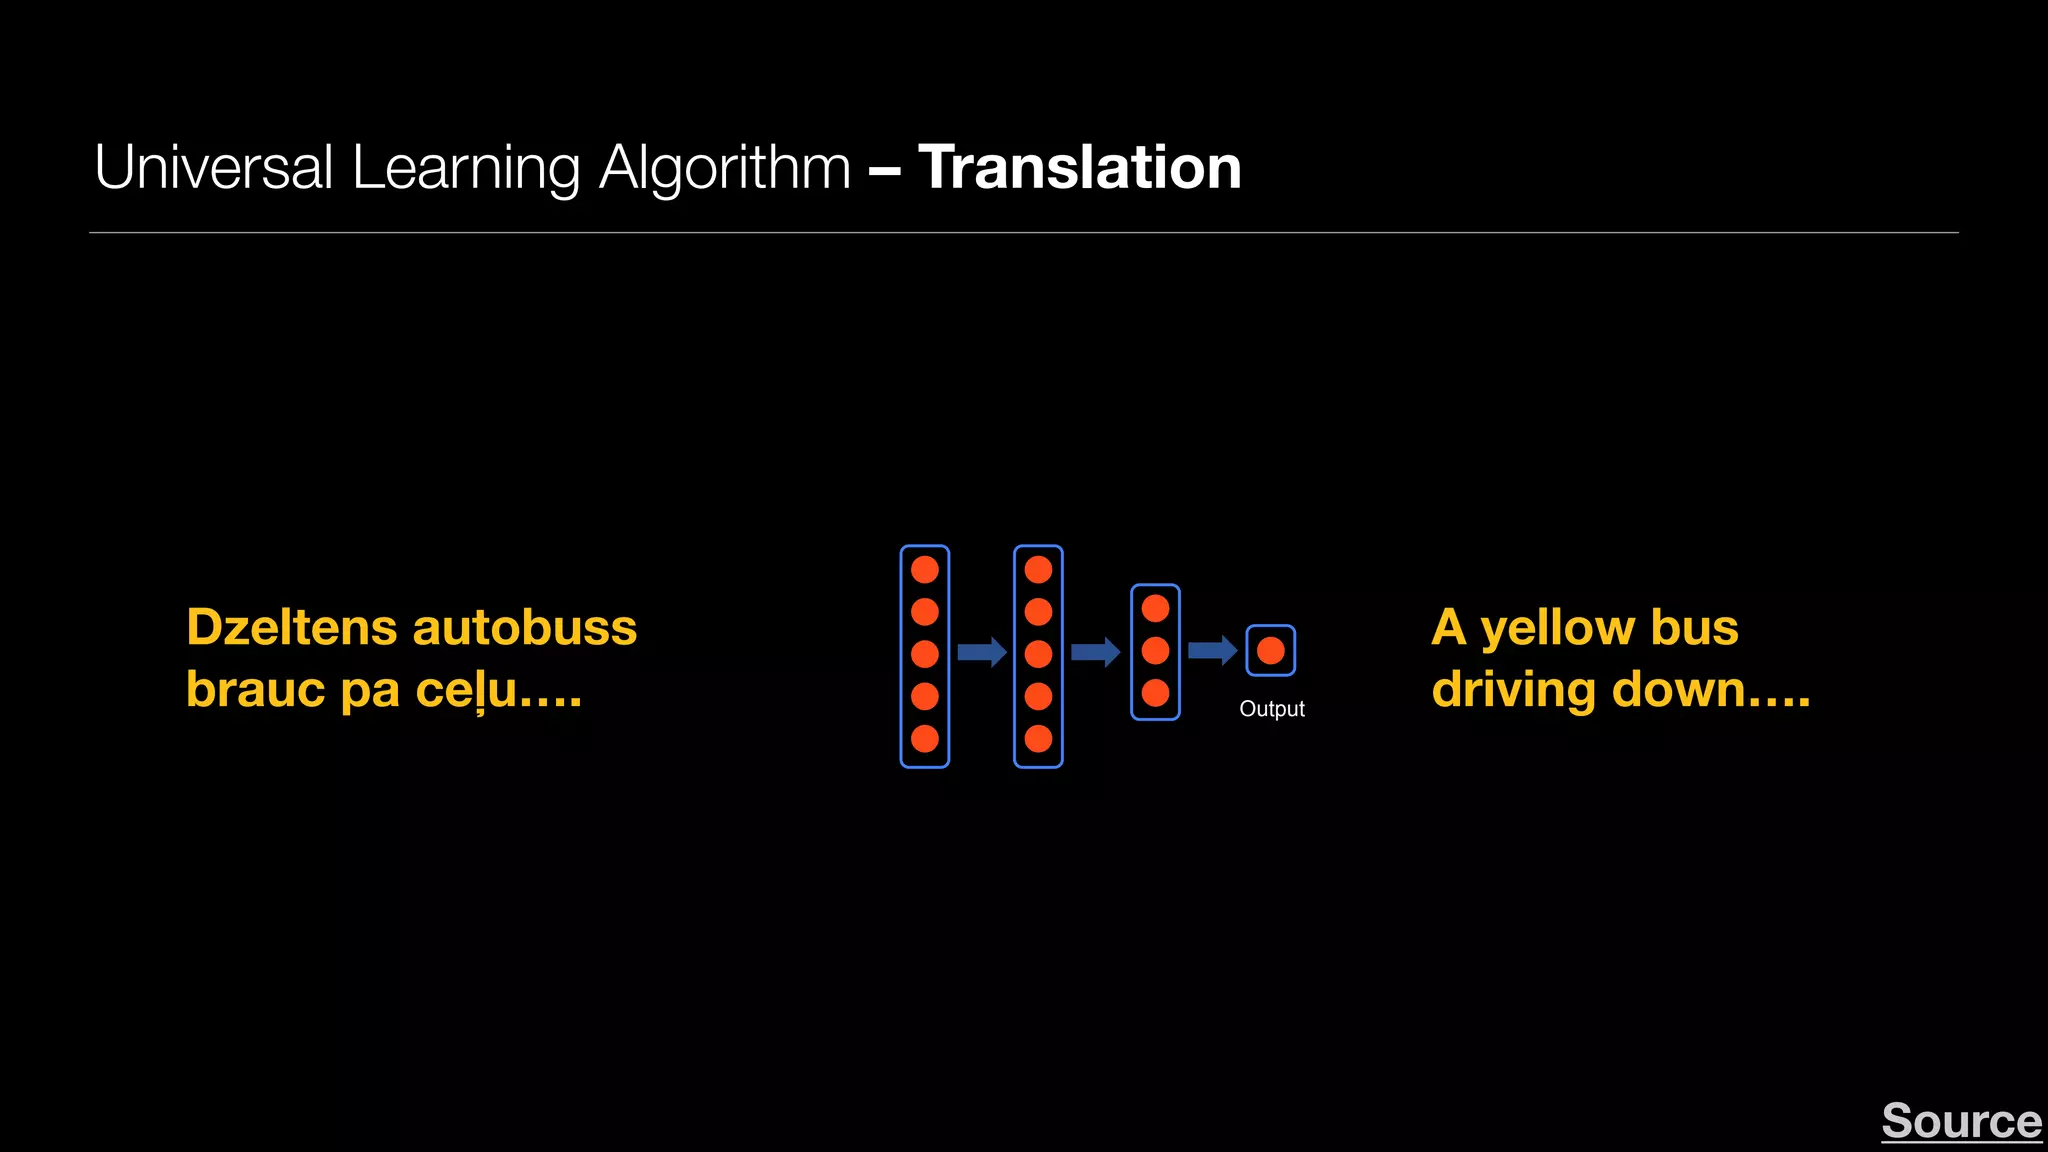
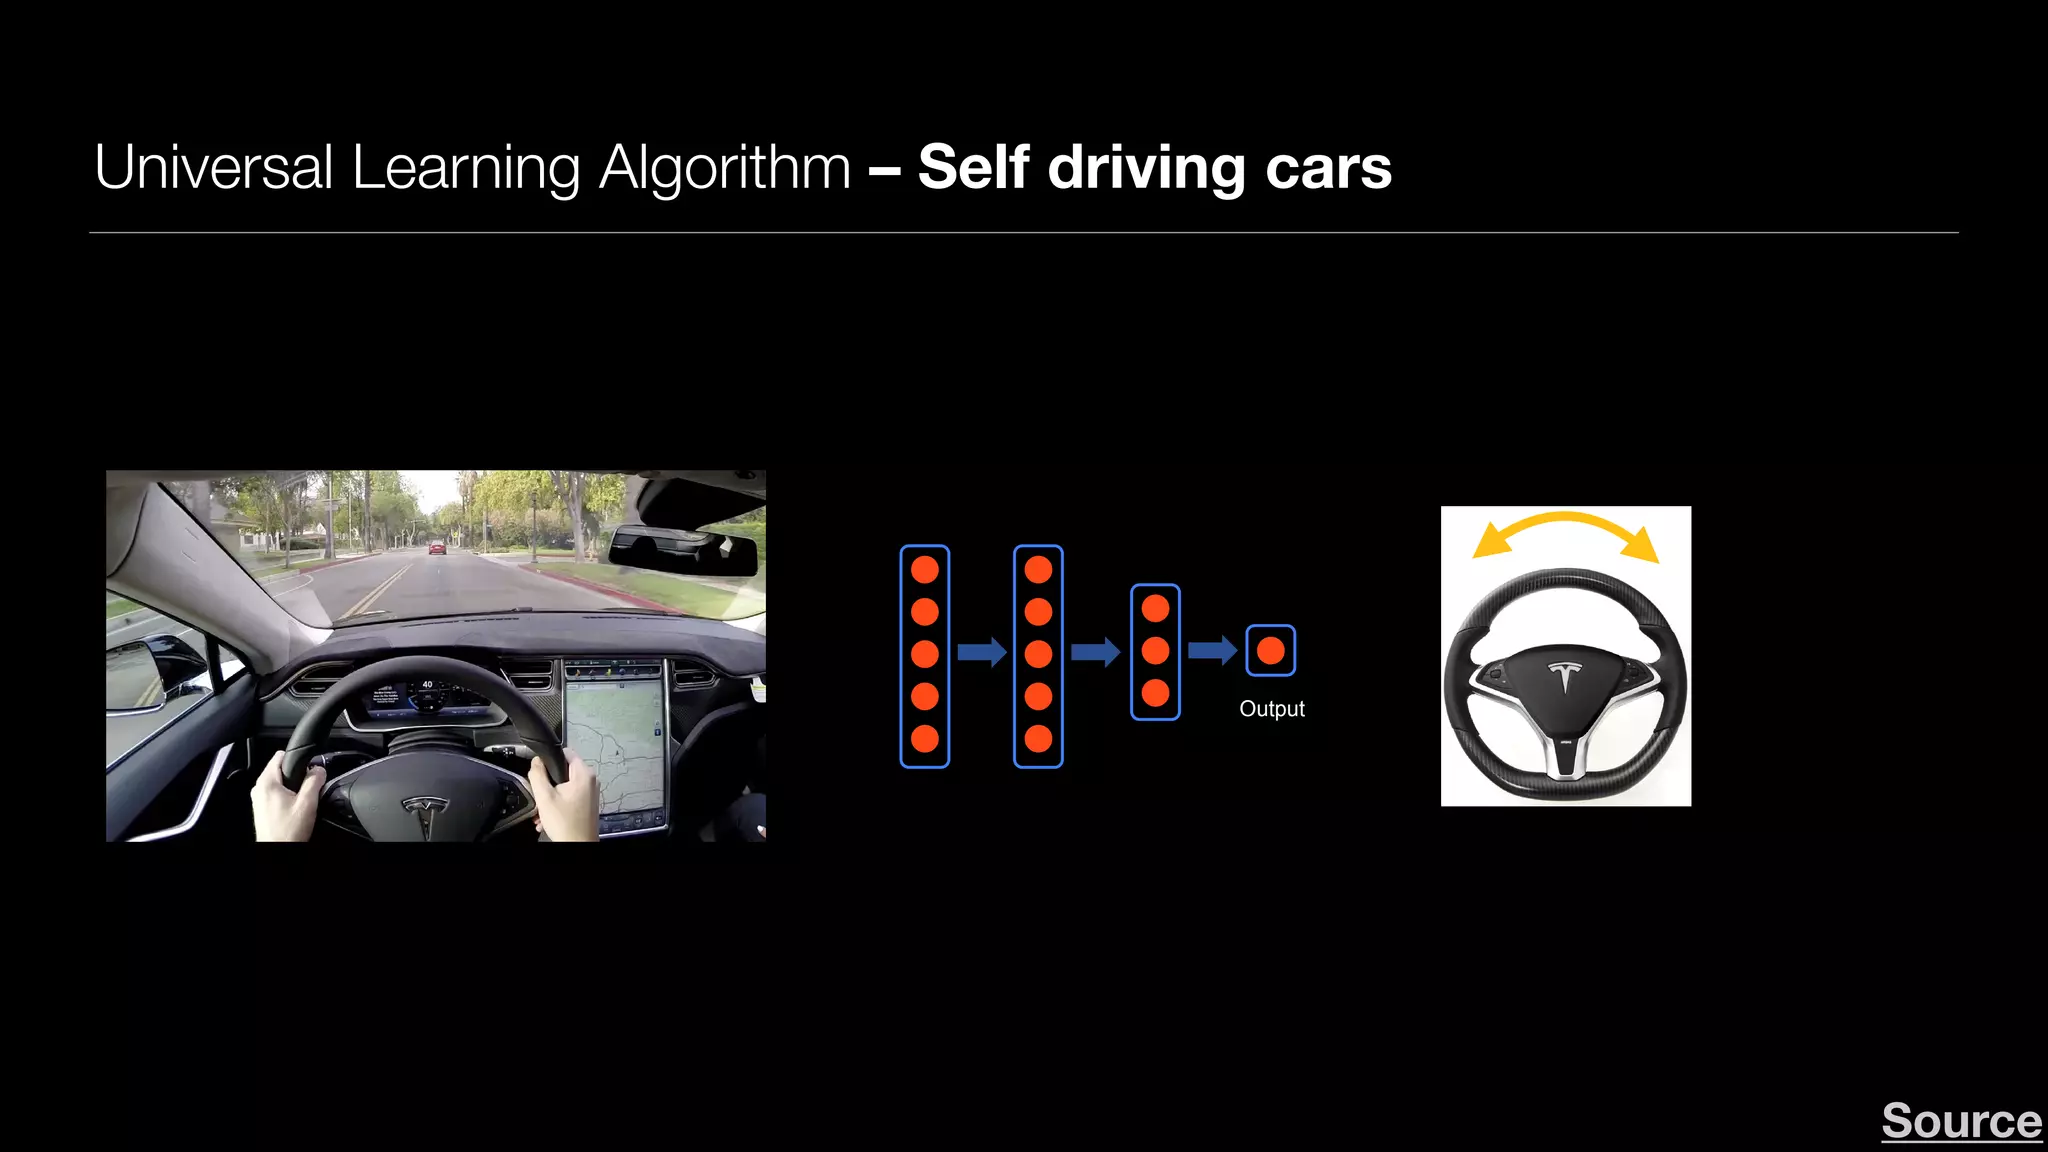
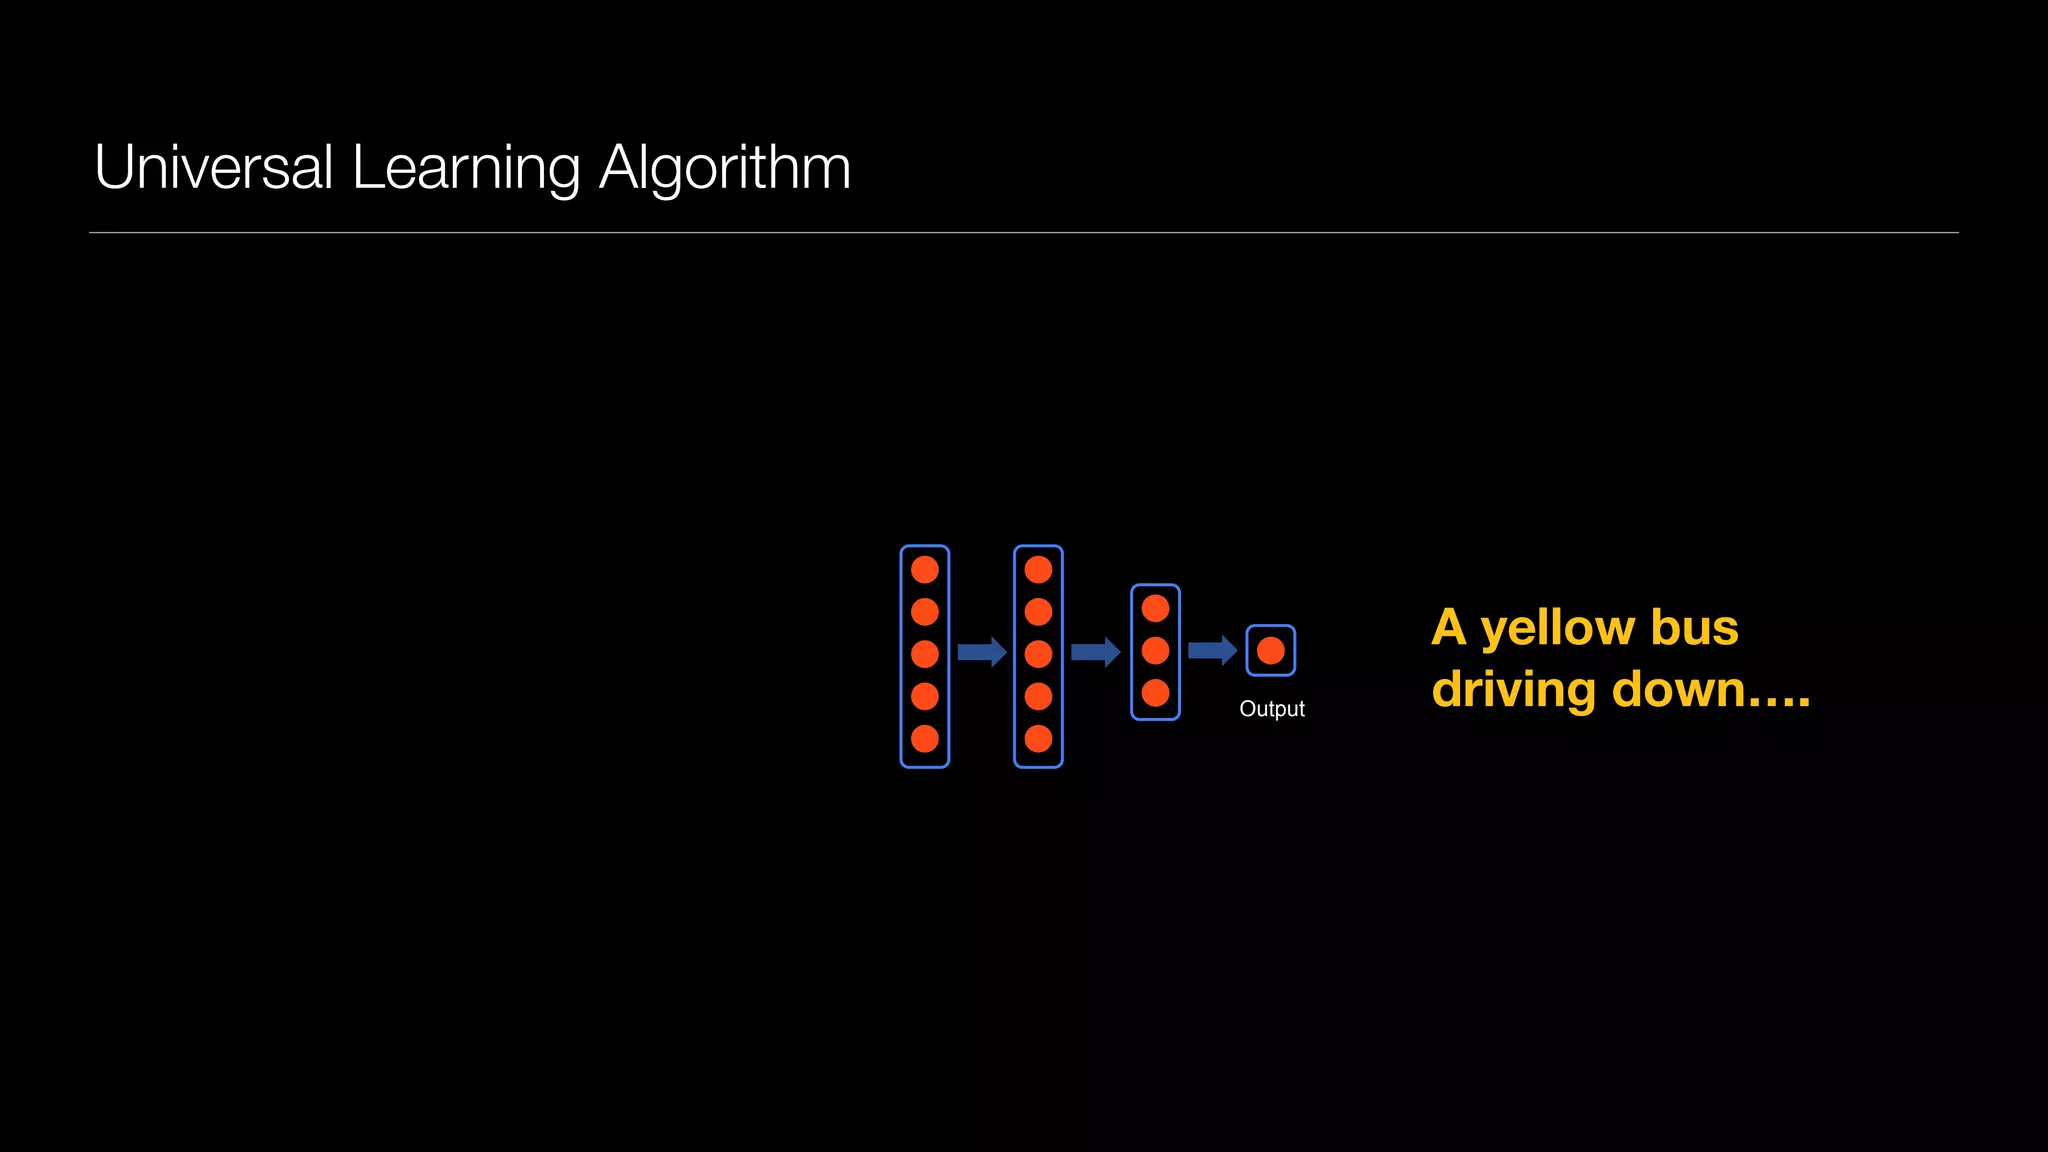
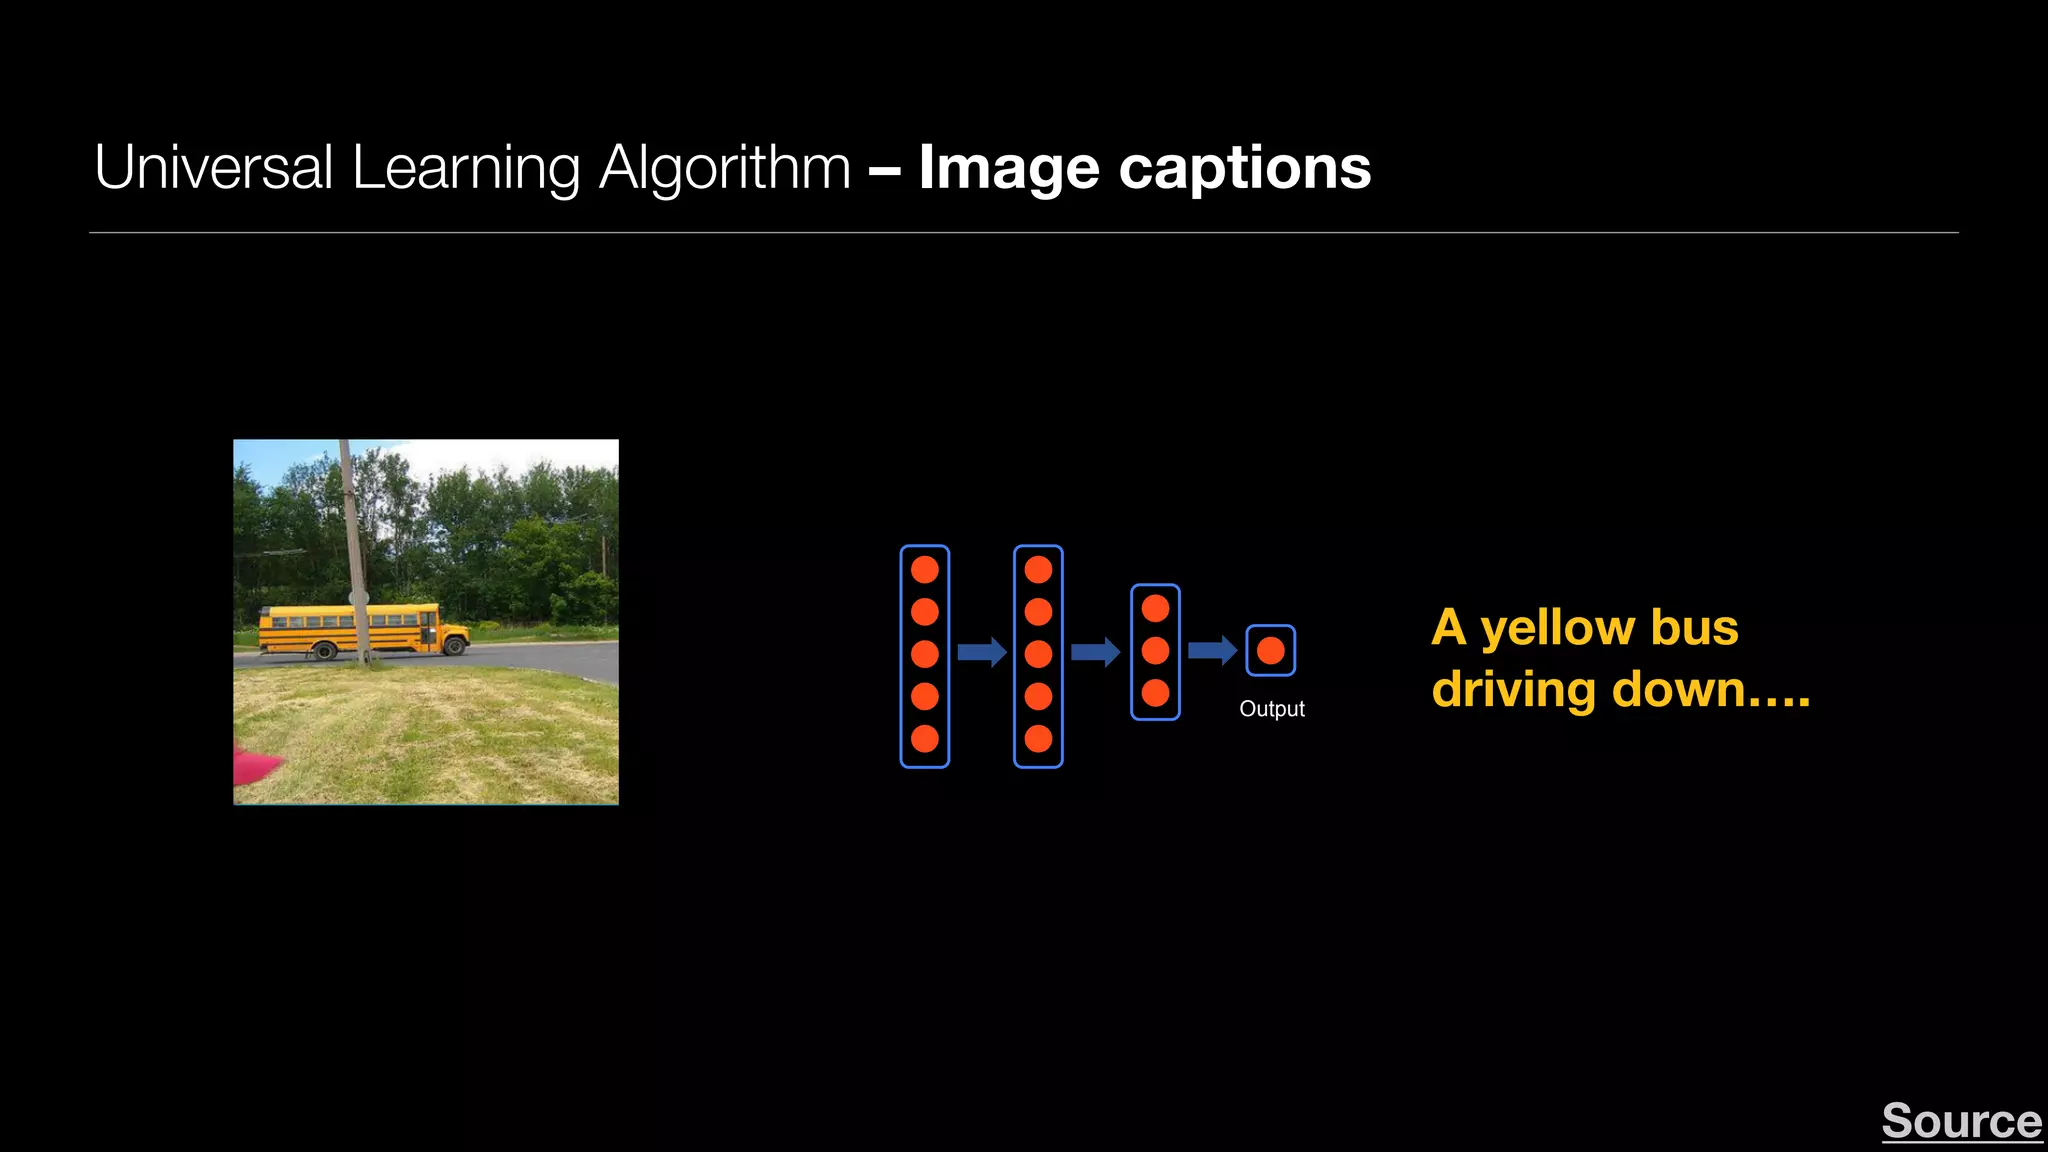
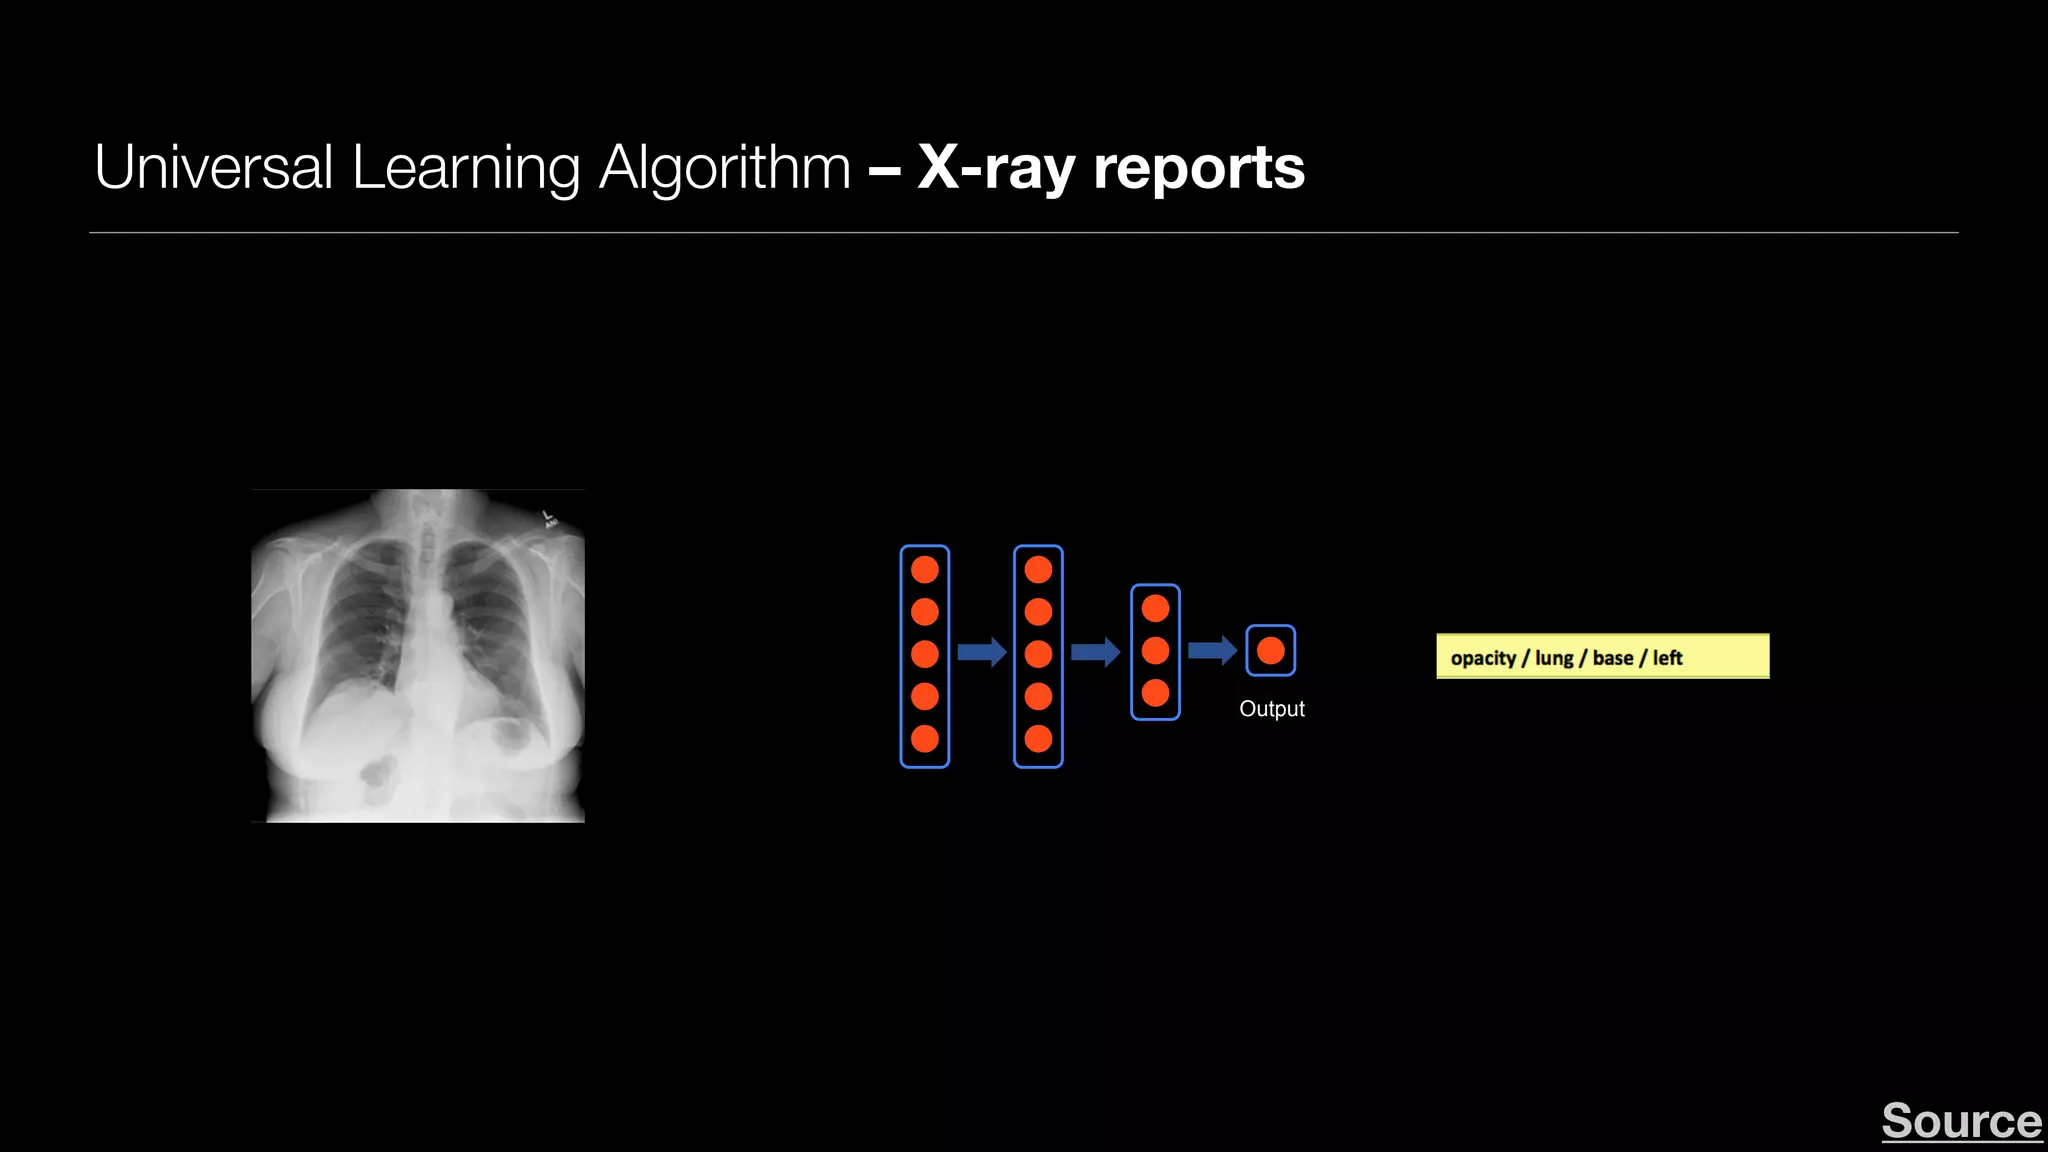
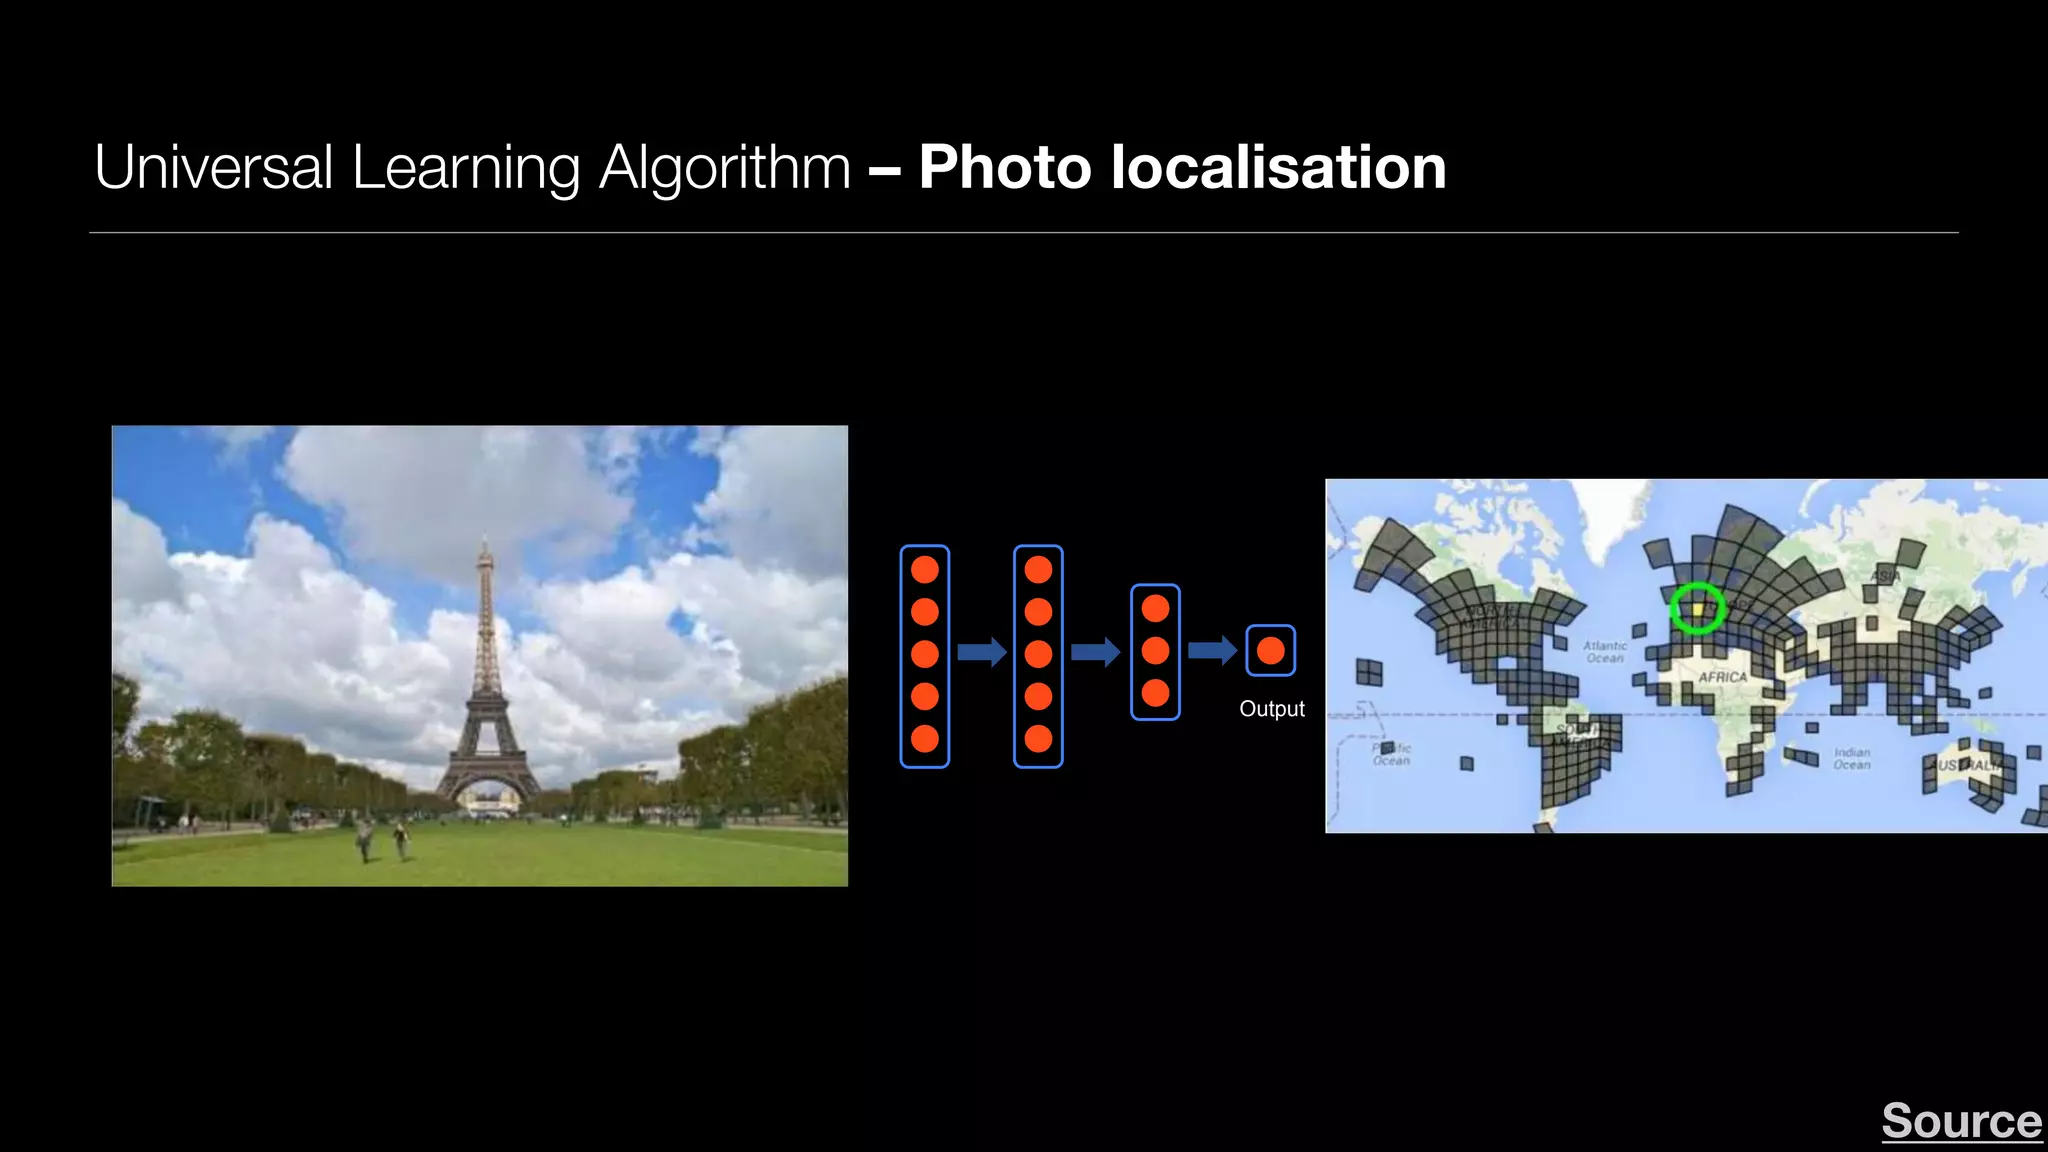
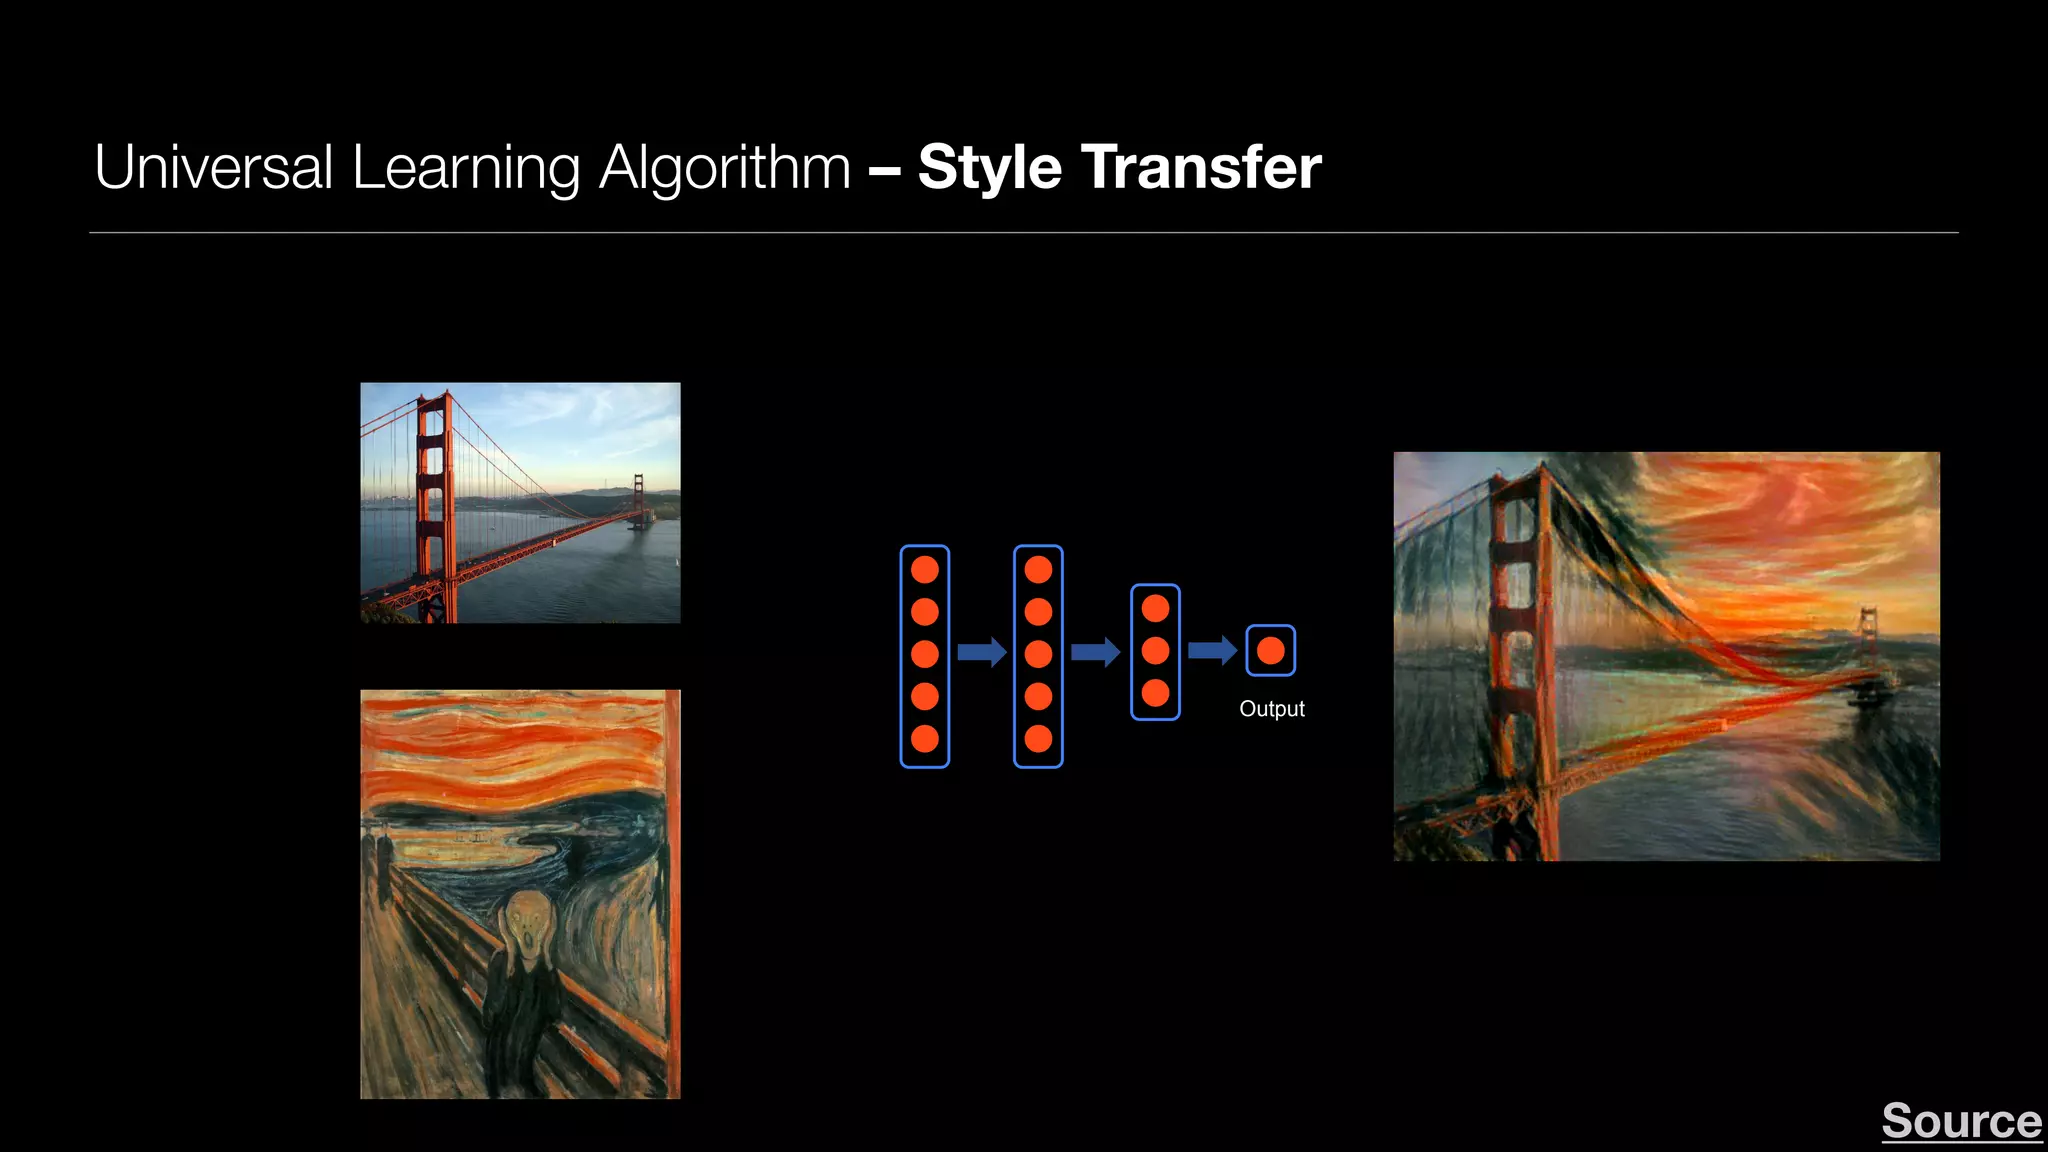
The document provides an overview of deep learning and reinforcement learning. It discusses the current state of artificial intelligence and machine learning, including how deep learning algorithms have achieved human-level performance in various tasks such as image recognition and generation. Reinforcement learning is introduced as learning through trial-and-error interactions with an environment to maximize rewards. Examples are given of reinforcement learning algorithms solving tasks like playing Atari games.


![Coded Agents – with UiPath SDK + LangGraph [Virtual Hands-on Workshop]](https://cdn.slidesharecdn.com/ss_thumbnails/codedagentsdeck-251215155422-5497c599-thumbnail.jpg?width=640&height=640&fit=bounds)


