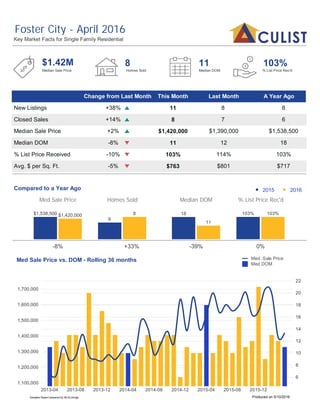
1. New Listings
A Year AgoLast MonthThis MonthChange from Last Month
Closed Sales
Median DOM
Median Sale Price
% List Price Received
Avg. $ per Sq. Ft.
-39%
8
Homes SoldMedian Sale Price
11 103%
Median DOM
0%
% List Price Rec'd
Compared to a Year Ago
Foster City - April 2016
-8% +33%
Key Market Facts for Single Family Residential
$1.42M
2016•2015•
1,100,000
1,200,000
1,300,000
1,400,000
1,500,000
1,600,000
1,700,000
6
8
10
12
14
16
18
20
22
2013-04 2013-08 2013-12 2014-04 2014-08 2014-12 2015-04 2015-08 2015-12
Med Sale Price vs. DOM - Rolling 36 months Med. Sale Price
Med DOM
18
11
Median DOM
6
8
Homes Sold
$1,538,500 $1,420,000
Med Sale Price
103% 103%
% List Price Rec'd
11
8
$1,420,000
11
103%
$763
8
7
$1,390,000
12
$801
114%
8
6
$1,538,500
18
103%
$717
+38%
+14%
+2%
-8%
-10%
-5%
Samples Report prepared by MLSListings Produced on 5/10/2016
2. New Listings
A Year AgoLast MonthThis MonthChange from Last Month
Closed Sales
Median DOM
Median Sale Price
% List Price Received
Avg. $ per Sq. Ft.
+10%
29
Homes SoldMedian Sale Price
11 107%
Median DOM
-3%
% List Price Rec'd
Compared to a Year Ago
Menlo Park - April 2016
+19% -3%
Key Market Facts for Single Family Residential
$2.34M
2016•2015•
1,200,000
1,400,000
1,600,000
1,800,000
2,000,000
2,200,000
2,400,000
2,600,000
10
15
20
25
30
35
2013-04 2013-08 2013-12 2014-04 2014-08 2014-12 2015-04 2015-08 2015-12
Med Sale Price vs. DOM - Rolling 36 months Med. Sale Price
Med DOM
10 11
Median DOM
30 29
Homes Sold
$1,965,000
$2,345,000
Med Sale Price
110% 107%
% List Price Rec'd
43
29
$2,345,000
11
107%
$1129
33
28
$2,425,000
11
$1145
107%
46
30
$1,965,000
10
110%
$1099
+30%
+4%
-3%
0%
0%
-1%
Samples Report prepared by MLSListings Produced on 5/10/2016
3. New Listings
A Year AgoLast MonthThis MonthChange from Last Month
Closed Sales
Median DOM
Median Sale Price
% List Price Received
Avg. $ per Sq. Ft.
-8%
22
Homes SoldMedian Sale Price
11 110%
Median DOM
-4%
% List Price Rec'd
Compared to a Year Ago
San Carlos - April 2016
+15% +10%
Key Market Facts for Single Family Residential
$1.65M
2016•2015•
1,100,000
1,200,000
1,300,000
1,400,000
1,500,000
1,600,000
1,700,000
1,800,000
1,900,000
2,000,000
8
10
12
14
16
18
2013-04 2013-08 2013-12 2014-04 2014-08 2014-12 2015-04 2015-08 2015-12
Med Sale Price vs. DOM - Rolling 36 months Med. Sale Price
Med DOM
12 11
Median DOM
20 22
Homes Sold
$1,430,000
$1,647,500
Med Sale Price
115% 110%
% List Price Rec'd
36
22
$1,647,500
11
110%
$897
22
14
$1,597,500
12
$840
105%
29
20
$1,430,000
12
115%
$807
+64%
+57%
+3%
-8%
+5%
+7%
Samples Report prepared by MLSListings Produced on 5/10/2016