SlideShare a Scribd company logo
Office: (832) 326-5787
Courtney@CourtneyFoster.com
www.ReferredRealtyMT.com
Courtney Foster
Referred Realty Group
Each data point is one month of activity. Data is from March 3, 2018.
All data from Big Sky Country MLS, a subsidiary of the Gallatin Association of REALTORS®. InfoSparks © 2018 ShowingTime.
February Homes for Sale
Bozeman & Belgrade & Three Forks & Big Sky
0
100
200
300
400
500
2016 2017 2018
430
311
251
-27.7% -19.3%
67 58 50
-13.4% -13.8%
24 31
21
+29.2% -32.3%
252
209
189
-17.1% -9.6%
Bozeman Belgrade Three Forks Big Sky
Office: (832) 326-5787
Courtney@CourtneyFoster.com
www.ReferredRealtyMT.com
Courtney Foster
Referred Realty Group
Each data point is one month of activity. Data is from March 3, 2018.
All data from Big Sky Country MLS, a subsidiary of the Gallatin Association of REALTORS®. InfoSparks © 2018 ShowingTime.
February New Listings
Bozeman & Belgrade & Three Forks & Big Sky
0
25
50
75
100
125
150
175
2016 2017 2018
144
130
111
-9.7% -14.6%
28
35
32
+25.0% -8.6%
7 8
12
+14.3% +50.0%
28
31 29
+10.7% -6.5%
Bozeman Belgrade Three Forks Big Sky
Office: (832) 326-5787
Courtney@CourtneyFoster.com
www.ReferredRealtyMT.com
Courtney Foster
Referred Realty Group
Each data point is one month of activity. Data is from March 2, 2018.
All data from Big Sky Country MLS, a subsidiary of the Gallatin Association of REALTORS®. InfoSparks © 2018 ShowingTime.
February Pending Sales
Bozeman & Belgrade & Three Forks & Area 5 (Big Sky)
0
25
50
75
100
125
150
175
2016 2017 2018
151
105
122
-30.5% +16.2%
34
30
43
-11.8% +43.3%
7
3
9
-57.1% +200.0%
19 21
37
+10.5% +76.2%
Bozeman Belgrade Three Forks Area 5 (Big Sky)
Office: (832) 326-5787
Courtney@CourtneyFoster.com
www.ReferredRealtyMT.com
Courtney Foster
Referred Realty Group
Each data point is one month of activity. Data is from March 2, 2018.
All data from Big Sky Country MLS, a subsidiary of the Gallatin Association of REALTORS®. InfoSparks © 2018 ShowingTime.
February Closed Sales
Bozeman & Belgrade & Three Forks & Area 5 (Big Sky)
0
20
40
60
80
100
2016 2017 2018
78
69
80
-11.5% +15.9%
21
24
21
+14.3% -12.5%
2
0
5
-100.0% ––
21
17
13
-19.0% -23.5%
Bozeman Belgrade Three Forks Area 5 (Big Sky)
Office: (832) 326-5787
Courtney@CourtneyFoster.com
www.ReferredRealtyMT.com
Courtney Foster
Referred Realty Group
Each data point is one month of activity. Data is from March 2, 2018.
All data from Big Sky Country MLS, a subsidiary of the Gallatin Association of REALTORS®. InfoSparks © 2018 ShowingTime.
February Average Sales Price
Bozeman & Belgrade & Three Forks & Area 5 (Big Sky)
$0
$0.2M
$0.4M
$0.6M
$0.8M
$1.0M
2016 2017 2018
$354,647
$406,096
$492,567
+14.5% +21.3%
$247,471
$296,979
$386,012
+20.0% +30.0%
$235,500
$340,750
–– ––
$643,190
$720,115 $728,655
+12.0% +1.2%
Bozeman Belgrade Three Forks Area 5 (Big Sky)
Office: (832) 326-5787
Courtney@CourtneyFoster.com
www.ReferredRealtyMT.com
Courtney Foster
Referred Realty Group
Each data point is one month of activity. Data is from March 2, 2018.
All data from Big Sky Country MLS, a subsidiary of the Gallatin Association of REALTORS®. InfoSparks © 2018 ShowingTime.
February Months Supply of Homes for Sale
Bozeman & Belgrade & Three Forks & Area 5 (Big Sky)
0.0
5.0
2.5
7.5
10.0
12.5
15.0
2016 2017 2018
3.3
2.3
2.0
-30.3% -13.0%
2.0
1.6
1.2
-20.0% -25.0%
4.9 5.1
2.9
+4.1% -43.1%
13.5
10.3
8.0
-23.7% -22.3%
Bozeman Belgrade Three Forks Area 5 (Big Sky)
Office: (832) 326-5787
Courtney@CourtneyFoster.com
www.ReferredRealtyMT.com
Courtney Foster
Referred Realty Group
Each data point is one month of activity. Data is from March 2, 2018.
All data from Big Sky Country MLS, a subsidiary of the Gallatin Association of REALTORS®. InfoSparks © 2018 ShowingTime.
February Median Days on Market
Bozeman & Belgrade & Three Forks & Area 5 (Big Sky)
0
100
50
150
200
250
2016 2017 2018
62
73
43
+17.7% -41.1%
32
73
31
+128.1% -57.5%
67 63
–– ––
207
98
32
-52.7% -67.3%
Bozeman Belgrade Three Forks Area 5 (Big Sky)
Office: (832) 326-5787
Courtney@CourtneyFoster.com
www.ReferredRealtyMT.com
Courtney Foster
Referred Realty Group
Each data point is one month of activity. Data is from March 2, 2018.
All data from Big Sky Country MLS, a subsidiary of the Gallatin Association of REALTORS®. InfoSparks © 2018 ShowingTime.
February Median Price Per Square Foot
Bozeman & Belgrade & Three Forks & Area 5 (Big Sky)
$0
$100
$200
$300
$400
2016 2017 2018
$162
$183
$206
+13.0% +12.6%
$125
$140
$157
+12.0% +12.1%
$94
$139
–– ––
$246
$272
$350
+10.6% +28.7%
Bozeman Belgrade Three Forks Area 5 (Big Sky)
Local Market Update – January 2018
This is a research tool provided by the Big Sky Country MLS
Bozeman City Limits
Single Family January Year to Date
Key Metrics 2017 2018 % Change Thru 1-2017 Thru 1-2018 % Change
New Listings 43 50 + 16.3% 43 50 + 16.3%
Pending Sales 39 43 + 10.3% 39 43 + 10.3%
Closed Sales 38 32 - 15.8% 38 32 - 15.8%
Days on Market Until Sale 79 59 - 25.3% 79 59 - 25.3%
Median Sales Price* $356,460 $395,000 + 10.8% $356,460 $395,000 + 10.8%
Average Sales Price* $424,547 $463,643 + 9.2% $424,547 $463,643 + 9.2%
Percent of List Price Received* 99.7% 99.3% - 0.4% 99.7% 99.3% - 0.4%
Inventory of Homes for Sale 100 94 - 6.0% –– –– ––
Months Supply of Inventory 2.0 2.0 0.0% –– –– ––
Condo/Townhouse January Year to Date
Key Metrics 2017 2018 % Change Thru 1-2017 Thru 1-2018 % Change
New Listings 48 24 - 50.0% 48 24 - 50.0%
Pending Sales 42 35 - 16.7% 42 35 - 16.7%
Closed Sales 27 26 - 3.7% 27 26 - 3.7%
Days on Market Until Sale 229 50 - 78.2% 229 50 - 78.2%
Median Sales Price* $304,500 $281,950 - 7.4% $304,500 $281,950 - 7.4%
Average Sales Price* $407,577 $364,908 - 10.5% $407,577 $364,908 - 10.5%
Percent of List Price Received* 99.7% 99.6% - 0.1% 99.7% 99.6% - 0.1%
Inventory of Homes for Sale 55 75 + 36.4% –– –– ––
Months Supply of Inventory 1.4 2.1 + 50.0% –– –– ––
* Does not account for sale concessions and/or downpayment assistance. | Percent changes are calculated using rounded figures and can sometimes look extreme due to small sample size.
A rolling 12-month calculation represents the current month and the 11 months prior in a single data point. If no activity occurred during a month, the line extends to the next available data point.
Median Sales Price - Single Family
Rolling 12-Month Calculation Gallatin County
Bozeman City Limits
1-2003 1-2005 1-2007 1-2009 1-2011 1-2013 1-2015 1-2017
$150,000
$200,000
$250,000
$300,000
$350,000
$400,000
Median Sales Price - Condo
Rolling 12-Month Calculation Gallatin County
Bozeman City Limits
1-2003 1-2005 1-2007 1-2009 1-2011 1-2013 1-2015 1-2017
$100,000
$150,000
$200,000
$250,000
$300,000
Current as of February 10, 2018. All data from Big Sky Country Multiple Listing Service®. Report © 2018 ShowingTime.
Local Market Update – January 2018
This is a research tool provided by the Big Sky Country MLS
Belgrade
Single Family January Year to Date
Key Metrics 2017 2018 % Change Thru 1-2017 Thru 1-2018 % Change
New Listings 24 27 + 12.5% 24 27 + 12.5%
Pending Sales 27 21 - 22.2% 27 21 - 22.2%
Closed Sales 18 10 - 44.4% 18 10 - 44.4%
Days on Market Until Sale 54 51 - 5.6% 54 51 - 5.6%
Median Sales Price* $252,700 $264,900 + 4.8% $252,700 $264,900 + 4.8%
Average Sales Price* $260,040 $282,448 + 8.6% $260,040 $282,448 + 8.6%
Percent of List Price Received* 99.1% 98.8% - 0.3% 99.1% 98.8% - 0.3%
Inventory of Homes for Sale 44 49 + 11.4% –– –– ––
Months Supply of Inventory 1.7 1.7 0.0% –– –– ––
Condo/Townhouse January Year to Date
Key Metrics 2017 2018 % Change Thru 1-2017 Thru 1-2018 % Change
New Listings 6 5 - 16.7% 6 5 - 16.7%
Pending Sales 6 7 + 16.7% 6 7 + 16.7%
Closed Sales 3 2 - 33.3% 3 2 - 33.3%
Days on Market Until Sale 6 52 + 766.7% 6 52 + 766.7%
Median Sales Price* $136,900 $237,750 + 73.7% $136,900 $237,750 + 73.7%
Average Sales Price* $154,900 $237,750 + 53.5% $154,900 $237,750 + 53.5%
Percent of List Price Received* 100.5% 98.9% - 1.6% 100.5% 98.9% - 1.6%
Inventory of Homes for Sale 7 8 + 14.3% –– –– ––
Months Supply of Inventory 1.0 1.1 + 10.0% –– –– ––
* Does not account for sale concessions and/or downpayment assistance. | Percent changes are calculated using rounded figures and can sometimes look extreme due to small sample size.
A rolling 12-month calculation represents the current month and the 11 months prior in a single data point. If no activity occurred during a month, the line extends to the next available data point.
Median Sales Price - Single Family
Rolling 12-Month Calculation Gallatin County
Belgrade
1-2003 1-2005 1-2007 1-2009 1-2011 1-2013 1-2015 1-2017
$100,000
$150,000
$200,000
$250,000
$300,000
$350,000
$400,000
Median Sales Price - Condo
Rolling 12-Month Calculation Gallatin County
Belgrade
1-2003 1-2005 1-2007 1-2009 1-2011 1-2013 1-2015 1-2017
$50,000
$100,000
$150,000
$200,000
$250,000
$300,000
Current as of February 10, 2018. All data from Big Sky Country Multiple Listing Service®. Report © 2018 ShowingTime.
Local Market Update – January 2018
This is a research tool provided by the Big Sky Country MLS
Greater Big Sky
Single Family January Year to Date
Key Metrics 2017 2018 % Change Thru 1-2017 Thru 1-2018 % Change
New Listings 2 7 + 250.0% 2 7 + 250.0%
Pending Sales 5 6 + 20.0% 5 6 + 20.0%
Closed Sales 1 0 - 100.0% 1 0 - 100.0%
Days on Market Until Sale 189 –– –– 189 –– ––
Median Sales Price* $505,000 –– –– $505,000 –– ––
Average Sales Price* $505,000 –– –– $505,000 –– ––
Percent of List Price Received* 95.5% –– –– 95.5% –– ––
Inventory of Homes for Sale 76 72 - 5.3% –– –– ––
Months Supply of Inventory 13.3 10.9 - 18.0% –– –– ––
Condo/Townhouse January Year to Date
Key Metrics 2017 2018 % Change Thru 1-2017 Thru 1-2018 % Change
New Listings 8 23 + 187.5% 8 23 + 187.5%
Pending Sales 20 19 - 5.0% 20 19 - 5.0%
Closed Sales 7 12 + 71.4% 7 12 + 71.4%
Days on Market Until Sale 196 92 - 53.1% 196 92 - 53.1%
Median Sales Price* $350,000 $349,500 - 0.1% $350,000 $349,500 - 0.1%
Average Sales Price* $342,286 $392,458 + 14.7% $342,286 $392,458 + 14.7%
Percent of List Price Received* 93.3% 96.1% + 3.0% 93.3% 96.1% + 3.0%
Inventory of Homes for Sale 102 123 + 20.6% –– –– ––
Months Supply of Inventory 7.1 8.6 + 21.1% –– –– ––
* Does not account for sale concessions and/or downpayment assistance. | Percent changes are calculated using rounded figures and can sometimes look extreme due to small sample size.
A rolling 12-month calculation represents the current month and the 11 months prior in a single data point. If no activity occurred during a month, the line extends to the next available data point.
Median Sales Price - Single Family
Rolling 12-Month Calculation Gallatin County
Greater Big Sky
1-2003 1-2005 1-2007 1-2009 1-2011 1-2013 1-2015 1-2017
$0
$500,000
$1,000,000
$1,500,000
$2,000,000
Median Sales Price - Condo
Rolling 12-Month Calculation Gallatin County
Greater Big Sky
1-2003 1-2005 1-2007 1-2009 1-2011 1-2013 1-2015 1-2017
$0
$100,000
$200,000
$300,000
$400,000
$500,000
$600,000
Current as of February 10, 2018. All data from Big Sky Country Multiple Listing Service®. Report © 2018 ShowingTime.
Local Market Update – January 2018
This is a research tool provided by the Big Sky Country MLS
Livingston City Limits
Single Family January Year to Date
Key Metrics 2017 2018 % Change Thru 1-2017 Thru 1-2018 % Change
New Listings 7 9 + 28.6% 7 9 + 28.6%
Pending Sales 13 8 - 38.5% 13 8 - 38.5%
Closed Sales 6 9 + 50.0% 6 9 + 50.0%
Days on Market Until Sale 68 34 - 50.0% 68 34 - 50.0%
Median Sales Price* $176,500 $238,500 + 35.1% $176,500 $238,500 + 35.1%
Average Sales Price* $186,283 $240,578 + 29.1% $186,283 $240,578 + 29.1%
Percent of List Price Received* 96.3% 93.9% - 2.5% 96.3% 93.9% - 2.5%
Inventory of Homes for Sale 31 25 - 19.4% –– –– ––
Months Supply of Inventory 2.7 2.0 - 25.9% –– –– ––
Condo/Townhouse January Year to Date
Key Metrics 2017 2018 % Change Thru 1-2017 Thru 1-2018 % Change
New Listings 0 3 –– 0 3 ––
Pending Sales 0 3 –– 0 3 ––
Closed Sales 1 2 + 100.0% 1 2 + 100.0%
Days on Market Until Sale 76 1 - 98.7% 76 1 - 98.7%
Median Sales Price* $148,000 $218,000 + 47.3% $148,000 $218,000 + 47.3%
Average Sales Price* $148,000 $218,000 + 47.3% $148,000 $218,000 + 47.3%
Percent of List Price Received* 96.7% 100.0% + 3.4% 96.7% 100.0% + 3.4%
Inventory of Homes for Sale 7 6 - 14.3% –– –– ––
Months Supply of Inventory 4.2 1.9 - 54.8% –– –– ––
* Does not account for sale concessions and/or downpayment assistance. | Percent changes are calculated using rounded figures and can sometimes look extreme due to small sample size.
A rolling 12-month calculation represents the current month and the 11 months prior in a single data point. If no activity occurred during a month, the line extends to the next available data point.
Median Sales Price - Single Family
Rolling 12-Month Calculation Gallatin County
Livingston City Limits
1-2003 1-2005 1-2007 1-2009 1-2011 1-2013 1-2015 1-2017
$50,000
$100,000
$150,000
$200,000
$250,000
$300,000
$350,000
$400,000
Median Sales Price - Condo
Rolling 12-Month Calculation Gallatin County
Livingston City Limits
1-2003 1-2005 1-2007 1-2009 1-2011 1-2013 1-2015 1-2017
$50,000
$100,000
$150,000
$200,000
$250,000
$300,000
Current as of February 10, 2018. All data from Big Sky Country Multiple Listing Service®. Report © 2018 ShowingTime.

More Related Content

What's hot

May 2018 Market Reports
May 2018 Market ReportsMay 2018 Market Reports
May 2018 Market Reports
Referred Realty Group
 
#HomeSalesShow Nov 2017 Market Reports
#HomeSalesShow Nov 2017 Market Reports#HomeSalesShow Nov 2017 Market Reports
#HomeSalesShow Nov 2017 Market Reports
Referred Realty Group
 
Jan 2019 Gallatin Valley Market Reports
Jan 2019 Gallatin Valley Market ReportsJan 2019 Gallatin Valley Market Reports
Jan 2019 Gallatin Valley Market Reports
Referred Realty Group
 
May 2019 Gallatin Valley Market Reports
May 2019 Gallatin Valley Market ReportsMay 2019 Gallatin Valley Market Reports
May 2019 Gallatin Valley Market Reports
Referred Realty Group
 
March 2020 Market Data
March 2020 Market DataMarch 2020 Market Data
March 2020 Market Data
Referred Realty Group
 
August 2019 Market Reports for Bozeman
August 2019 Market Reports for BozemanAugust 2019 Market Reports for Bozeman
August 2019 Market Reports for Bozeman
Referred Realty Group
 
March 2019 Market Report
March 2019 Market ReportMarch 2019 Market Report
March 2019 Market Report
Referred Realty Group
 
Bozeman and Surrounding Communities June 2019 Market Report
Bozeman and Surrounding Communities June 2019 Market ReportBozeman and Surrounding Communities June 2019 Market Report
Bozeman and Surrounding Communities June 2019 Market Report
Referred Realty Group
 
Feb 2019 Market Reports for the Bozeman Area
Feb 2019 Market Reports for the Bozeman AreaFeb 2019 Market Reports for the Bozeman Area
Feb 2019 Market Reports for the Bozeman Area
Referred Realty Group
 
San Francisco Market Focus Report October 2018
San Francisco Market Focus Report October 2018San Francisco Market Focus Report October 2018
San Francisco Market Focus Report October 2018
Ronny Budiutama
 
#HomeSalesShow Oct 2017 market reports
#HomeSalesShow Oct 2017 market reports#HomeSalesShow Oct 2017 market reports
#HomeSalesShow Oct 2017 market reports
Referred Realty Group
 
San Francisco Market Focus April 2018
San Francisco Market Focus April 2018San Francisco Market Focus April 2018
San Francisco Market Focus April 2018
Ronny Budiutama
 
April 2019 Market Reports for the Gallatin Valley
April 2019 Market Reports for the Gallatin ValleyApril 2019 Market Reports for the Gallatin Valley
April 2019 Market Reports for the Gallatin Valley
Referred Realty Group
 
San Francisco Market Focus Report November 2018
San Francisco Market Focus Report November 2018San Francisco Market Focus Report November 2018
San Francisco Market Focus Report November 2018
Ronny Budiutama
 
Massachusetts statewide closed sales for condos and single family homes
Massachusetts statewide closed sales for condos and single family homesMassachusetts statewide closed sales for condos and single family homes
Massachusetts statewide closed sales for condos and single family homes
Michael Mahoney
 
July 2019 Gallatin Valley Market Reports
July 2019 Gallatin Valley Market ReportsJuly 2019 Gallatin Valley Market Reports
July 2019 Gallatin Valley Market Reports
Referred Realty Group
 
September 2019 Market Reports
September 2019 Market ReportsSeptember 2019 Market Reports
September 2019 Market Reports
Referred Realty Group
 
San Francisco Market Focus Report September 2018
San Francisco Market Focus Report September 2018San Francisco Market Focus Report September 2018
San Francisco Market Focus Report September 2018
Ronny Budiutama
 
San Francisco Market Focus Report Aug 2018
San Francisco Market Focus Report Aug 2018San Francisco Market Focus Report Aug 2018
San Francisco Market Focus Report Aug 2018
Ronny Budiutama
 
Oct 2019 Market Reports
Oct 2019 Market ReportsOct 2019 Market Reports
Oct 2019 Market Reports
Referred Realty Group
 

What's hot (20)

May 2018 Market Reports
May 2018 Market ReportsMay 2018 Market Reports
May 2018 Market Reports
 
#HomeSalesShow Nov 2017 Market Reports
#HomeSalesShow Nov 2017 Market Reports#HomeSalesShow Nov 2017 Market Reports
#HomeSalesShow Nov 2017 Market Reports
 
Jan 2019 Gallatin Valley Market Reports
Jan 2019 Gallatin Valley Market ReportsJan 2019 Gallatin Valley Market Reports
Jan 2019 Gallatin Valley Market Reports
 
May 2019 Gallatin Valley Market Reports
May 2019 Gallatin Valley Market ReportsMay 2019 Gallatin Valley Market Reports
May 2019 Gallatin Valley Market Reports
 
March 2020 Market Data
March 2020 Market DataMarch 2020 Market Data
March 2020 Market Data
 
August 2019 Market Reports for Bozeman
August 2019 Market Reports for BozemanAugust 2019 Market Reports for Bozeman
August 2019 Market Reports for Bozeman
 
March 2019 Market Report
March 2019 Market ReportMarch 2019 Market Report
March 2019 Market Report
 
Bozeman and Surrounding Communities June 2019 Market Report
Bozeman and Surrounding Communities June 2019 Market ReportBozeman and Surrounding Communities June 2019 Market Report
Bozeman and Surrounding Communities June 2019 Market Report
 
Feb 2019 Market Reports for the Bozeman Area
Feb 2019 Market Reports for the Bozeman AreaFeb 2019 Market Reports for the Bozeman Area
Feb 2019 Market Reports for the Bozeman Area
 
San Francisco Market Focus Report October 2018
San Francisco Market Focus Report October 2018San Francisco Market Focus Report October 2018
San Francisco Market Focus Report October 2018
 
#HomeSalesShow Oct 2017 market reports
#HomeSalesShow Oct 2017 market reports#HomeSalesShow Oct 2017 market reports
#HomeSalesShow Oct 2017 market reports
 
San Francisco Market Focus April 2018
San Francisco Market Focus April 2018San Francisco Market Focus April 2018
San Francisco Market Focus April 2018
 
April 2019 Market Reports for the Gallatin Valley
April 2019 Market Reports for the Gallatin ValleyApril 2019 Market Reports for the Gallatin Valley
April 2019 Market Reports for the Gallatin Valley
 
San Francisco Market Focus Report November 2018
San Francisco Market Focus Report November 2018San Francisco Market Focus Report November 2018
San Francisco Market Focus Report November 2018
 
Massachusetts statewide closed sales for condos and single family homes
Massachusetts statewide closed sales for condos and single family homesMassachusetts statewide closed sales for condos and single family homes
Massachusetts statewide closed sales for condos and single family homes
 
July 2019 Gallatin Valley Market Reports
July 2019 Gallatin Valley Market ReportsJuly 2019 Gallatin Valley Market Reports
July 2019 Gallatin Valley Market Reports
 
September 2019 Market Reports
September 2019 Market ReportsSeptember 2019 Market Reports
September 2019 Market Reports
 
San Francisco Market Focus Report September 2018
San Francisco Market Focus Report September 2018San Francisco Market Focus Report September 2018
San Francisco Market Focus Report September 2018
 
San Francisco Market Focus Report Aug 2018
San Francisco Market Focus Report Aug 2018San Francisco Market Focus Report Aug 2018
San Francisco Market Focus Report Aug 2018
 
Oct 2019 Market Reports
Oct 2019 Market ReportsOct 2019 Market Reports
Oct 2019 Market Reports
 

Similar to Feb 2018 Market Reports for Bozeman, Belgrade, Livingston, Big Sky

January 2022 Bozeman real estate stats
January 2022 Bozeman real estate statsJanuary 2022 Bozeman real estate stats
January 2022 Bozeman real estate stats
Referred Realty Group
 
San Francisco Market Focus Report May
San Francisco Market Focus Report MaySan Francisco Market Focus Report May
San Francisco Market Focus Report May
Ronny Budiutama
 
Georgia Housing Market Snapshot For October 2018
Georgia Housing Market Snapshot For October 2018Georgia Housing Market Snapshot For October 2018
Georgia Housing Market Snapshot For October 2018
Arthur Prescott
 
Georgia Housing Market Snapshot For November 2018
Georgia Housing Market Snapshot For November 2018Georgia Housing Market Snapshot For November 2018
Georgia Housing Market Snapshot For November 2018
Arthur Prescott
 
Georgia Housing Market Snapshot For September 2018
Georgia Housing Market Snapshot For September 2018Georgia Housing Market Snapshot For September 2018
Georgia Housing Market Snapshot For September 2018
Arthur Prescott
 
San Francisco Market Report January 2023.pdf
San Francisco Market Report January 2023.pdfSan Francisco Market Report January 2023.pdf
San Francisco Market Report January 2023.pdf
Ronny Budiutama
 
Charlotte region -monthly indicators - feb 2018
Charlotte region -monthly indicators - feb 2018Charlotte region -monthly indicators - feb 2018
Charlotte region -monthly indicators - feb 2018
Scott Browder
 
San Francisco Market Focus Report July
San Francisco Market Focus Report JulySan Francisco Market Focus Report July
San Francisco Market Focus Report July
Ronny Budiutama
 
San Francisco Market Report October 2022.pdf
San Francisco Market Report October 2022.pdfSan Francisco Market Report October 2022.pdf
San Francisco Market Report October 2022.pdf
Ronny Budiutama
 
Georgia Housing Market Snapshot: June 2018. Courtesy of the Georgia Associat...
Georgia Housing Market Snapshot: June 2018.  Courtesy of the Georgia Associat...Georgia Housing Market Snapshot: June 2018.  Courtesy of the Georgia Associat...
Georgia Housing Market Snapshot: June 2018. Courtesy of the Georgia Associat...
Arthur Prescott
 
San Francisco Market Report February 2023
San Francisco Market Report February 2023San Francisco Market Report February 2023
San Francisco Market Report February 2023
Ronny Budiutama
 

Similar to Feb 2018 Market Reports for Bozeman, Belgrade, Livingston, Big Sky (11)

January 2022 Bozeman real estate stats
January 2022 Bozeman real estate statsJanuary 2022 Bozeman real estate stats
January 2022 Bozeman real estate stats
 
San Francisco Market Focus Report May
San Francisco Market Focus Report MaySan Francisco Market Focus Report May
San Francisco Market Focus Report May
 
Georgia Housing Market Snapshot For October 2018
Georgia Housing Market Snapshot For October 2018Georgia Housing Market Snapshot For October 2018
Georgia Housing Market Snapshot For October 2018
 
Georgia Housing Market Snapshot For November 2018
Georgia Housing Market Snapshot For November 2018Georgia Housing Market Snapshot For November 2018
Georgia Housing Market Snapshot For November 2018
 
Georgia Housing Market Snapshot For September 2018
Georgia Housing Market Snapshot For September 2018Georgia Housing Market Snapshot For September 2018
Georgia Housing Market Snapshot For September 2018
 
San Francisco Market Report January 2023.pdf
San Francisco Market Report January 2023.pdfSan Francisco Market Report January 2023.pdf
San Francisco Market Report January 2023.pdf
 
Charlotte region -monthly indicators - feb 2018
Charlotte region -monthly indicators - feb 2018Charlotte region -monthly indicators - feb 2018
Charlotte region -monthly indicators - feb 2018
 
San Francisco Market Focus Report July
San Francisco Market Focus Report JulySan Francisco Market Focus Report July
San Francisco Market Focus Report July
 
San Francisco Market Report October 2022.pdf
San Francisco Market Report October 2022.pdfSan Francisco Market Report October 2022.pdf
San Francisco Market Report October 2022.pdf
 
Georgia Housing Market Snapshot: June 2018. Courtesy of the Georgia Associat...
Georgia Housing Market Snapshot: June 2018.  Courtesy of the Georgia Associat...Georgia Housing Market Snapshot: June 2018.  Courtesy of the Georgia Associat...
Georgia Housing Market Snapshot: June 2018. Courtesy of the Georgia Associat...
 
San Francisco Market Report February 2023
San Francisco Market Report February 2023San Francisco Market Report February 2023
San Francisco Market Report February 2023
 

More from Referred Realty Group

Bozeman Real Estate Market Reports April/May 2024
Bozeman Real Estate Market Reports April/May 2024Bozeman Real Estate Market Reports April/May 2024
Bozeman Real Estate Market Reports April/May 2024
Referred Realty Group
 
Apr 22 Market Reports
Apr 22 Market ReportsApr 22 Market Reports
Apr 22 Market Reports
Referred Realty Group
 
Bozeman March 2022 Real Estate Market Report
Bozeman March 2022 Real Estate Market ReportBozeman March 2022 Real Estate Market Report
Bozeman March 2022 Real Estate Market Report
Referred Realty Group
 
Feb 2022 Market Report for Bozeman, MT
Feb 2022 Market Report for Bozeman, MTFeb 2022 Market Report for Bozeman, MT
Feb 2022 Market Report for Bozeman, MT
Referred Realty Group
 
December and Year End 2018 Sales Data
December and Year End 2018 Sales DataDecember and Year End 2018 Sales Data
December and Year End 2018 Sales Data
Referred Realty Group
 
November 2018 Real Estate Update, The Woodlands, TX
November 2018 Real Estate Update, The Woodlands, TXNovember 2018 Real Estate Update, The Woodlands, TX
November 2018 Real Estate Update, The Woodlands, TX
Referred Realty Group
 
October 2018 Real Estate Update for The Woodlands, Texas
October 2018 Real Estate Update for The Woodlands, TexasOctober 2018 Real Estate Update for The Woodlands, Texas
October 2018 Real Estate Update for The Woodlands, Texas
Referred Realty Group
 
September 2018 Real Estate Update, The Woodlands, Texas
September 2018 Real Estate Update, The Woodlands, TexasSeptember 2018 Real Estate Update, The Woodlands, Texas
September 2018 Real Estate Update, The Woodlands, Texas
Referred Realty Group
 
August 2018 Real Estate Update for The Woodlands, Texas
August 2018 Real Estate Update for The Woodlands, TexasAugust 2018 Real Estate Update for The Woodlands, Texas
August 2018 Real Estate Update for The Woodlands, Texas
Referred Realty Group
 
July 2018 Real Estate Update for The Woodlands, Texas
July 2018 Real Estate Update for The Woodlands, TexasJuly 2018 Real Estate Update for The Woodlands, Texas
July 2018 Real Estate Update for The Woodlands, Texas
Referred Realty Group
 
May 2018 Real Estate Update for The Woodlands, Texas
May 2018 Real Estate Update for The Woodlands, TexasMay 2018 Real Estate Update for The Woodlands, Texas
May 2018 Real Estate Update for The Woodlands, Texas
Referred Realty Group
 

More from Referred Realty Group (11)

Bozeman Real Estate Market Reports April/May 2024
Bozeman Real Estate Market Reports April/May 2024Bozeman Real Estate Market Reports April/May 2024
Bozeman Real Estate Market Reports April/May 2024
 
Apr 22 Market Reports
Apr 22 Market ReportsApr 22 Market Reports
Apr 22 Market Reports
 
Bozeman March 2022 Real Estate Market Report
Bozeman March 2022 Real Estate Market ReportBozeman March 2022 Real Estate Market Report
Bozeman March 2022 Real Estate Market Report
 
Feb 2022 Market Report for Bozeman, MT
Feb 2022 Market Report for Bozeman, MTFeb 2022 Market Report for Bozeman, MT
Feb 2022 Market Report for Bozeman, MT
 
December and Year End 2018 Sales Data
December and Year End 2018 Sales DataDecember and Year End 2018 Sales Data
December and Year End 2018 Sales Data
 
November 2018 Real Estate Update, The Woodlands, TX
November 2018 Real Estate Update, The Woodlands, TXNovember 2018 Real Estate Update, The Woodlands, TX
November 2018 Real Estate Update, The Woodlands, TX
 
October 2018 Real Estate Update for The Woodlands, Texas
October 2018 Real Estate Update for The Woodlands, TexasOctober 2018 Real Estate Update for The Woodlands, Texas
October 2018 Real Estate Update for The Woodlands, Texas
 
September 2018 Real Estate Update, The Woodlands, Texas
September 2018 Real Estate Update, The Woodlands, TexasSeptember 2018 Real Estate Update, The Woodlands, Texas
September 2018 Real Estate Update, The Woodlands, Texas
 
August 2018 Real Estate Update for The Woodlands, Texas
August 2018 Real Estate Update for The Woodlands, TexasAugust 2018 Real Estate Update for The Woodlands, Texas
August 2018 Real Estate Update for The Woodlands, Texas
 
July 2018 Real Estate Update for The Woodlands, Texas
July 2018 Real Estate Update for The Woodlands, TexasJuly 2018 Real Estate Update for The Woodlands, Texas
July 2018 Real Estate Update for The Woodlands, Texas
 
May 2018 Real Estate Update for The Woodlands, Texas
May 2018 Real Estate Update for The Woodlands, TexasMay 2018 Real Estate Update for The Woodlands, Texas
May 2018 Real Estate Update for The Woodlands, Texas
 

Recently uploaded

Deutsche EuroShop | Company Presentation | 06/24
Deutsche EuroShop | Company Presentation | 06/24Deutsche EuroShop | Company Presentation | 06/24
Deutsche EuroShop | Company Presentation | 06/24
Deutsche EuroShop AG
 
Elegant Evergreen Homes - Luxury Apartments Redefining Comfort in Yelahanka, ...
Elegant Evergreen Homes - Luxury Apartments Redefining Comfort in Yelahanka, ...Elegant Evergreen Homes - Luxury Apartments Redefining Comfort in Yelahanka, ...
Elegant Evergreen Homes - Luxury Apartments Redefining Comfort in Yelahanka, ...
JagadishKR1
 
Urbanrise Paradise on Earth - Unveiling Unprecedented Luxury in Exquisite Vil...
Urbanrise Paradise on Earth - Unveiling Unprecedented Luxury in Exquisite Vil...Urbanrise Paradise on Earth - Unveiling Unprecedented Luxury in Exquisite Vil...
Urbanrise Paradise on Earth - Unveiling Unprecedented Luxury in Exquisite Vil...
JagadishKR1
 
SVN Live 6.3.24 Weekly Property Broadcast
SVN Live 6.3.24 Weekly Property BroadcastSVN Live 6.3.24 Weekly Property Broadcast
SVN Live 6.3.24 Weekly Property Broadcast
SVN International Corp.
 
Biography and career about Lixin Azarmehr
Biography and career about Lixin AzarmehrBiography and career about Lixin Azarmehr
Biography and career about Lixin Azarmehr
Lixin Azarmehr
 
One20 North Vancouver Floor Plans by Three Shores Development.
One20 North Vancouver Floor Plans by Three Shores Development.One20 North Vancouver Floor Plans by Three Shores Development.
One20 North Vancouver Floor Plans by Three Shores Development.
VickyAulakh1
 
Architectural & Interior design portfolio.pdf
Architectural & Interior design portfolio.pdfArchitectural & Interior design portfolio.pdf
Architectural & Interior design portfolio.pdf
susantebinum
 
Optimizing Your MCA Lead Capture Process for Better Results
Optimizing Your MCA Lead Capture Process for Better ResultsOptimizing Your MCA Lead Capture Process for Better Results
Optimizing Your MCA Lead Capture Process for Better Results
Lead Generation Media
 
One FNG by Group 108 Sector 142 Noida Construction Update
One FNG by Group 108 Sector 142 Noida Construction UpdateOne FNG by Group 108 Sector 142 Noida Construction Update
One FNG by Group 108 Sector 142 Noida Construction Update
One FNG
 
How to Scan Tenants in NYC - You Should Know!
How to Scan Tenants in NYC - You Should Know!How to Scan Tenants in NYC - You Should Know!
How to Scan Tenants in NYC - You Should Know!
BelgiumManagement
 
How to keep your Home naturally Cool and Warm
How to keep your Home naturally Cool and WarmHow to keep your Home naturally Cool and Warm
How to keep your Home naturally Cool and Warm
Vinra Construction
 
Green Homes, Islamabad Presentation .pdf
Green Homes, Islamabad Presentation .pdfGreen Homes, Islamabad Presentation .pdf
Green Homes, Islamabad Presentation .pdf
ticktoktips
 
Hawthorn Module 1 Coverted to Slide Show - 04.06.2024.docx
Hawthorn Module 1 Coverted to Slide Show - 04.06.2024.docxHawthorn Module 1 Coverted to Slide Show - 04.06.2024.docx
Hawthorn Module 1 Coverted to Slide Show - 04.06.2024.docx
anothershaneroberts
 
Rixos Tersane Istanbul Residences Brochure_May2024_ENG.pdf
Rixos Tersane Istanbul Residences Brochure_May2024_ENG.pdfRixos Tersane Istanbul Residences Brochure_May2024_ENG.pdf
Rixos Tersane Istanbul Residences Brochure_May2024_ENG.pdf
Listing Turkey
 
BricknBolt Understanding Load-Bearing Walls and Their Structural Support in H...
BricknBolt Understanding Load-Bearing Walls and Their Structural Support in H...BricknBolt Understanding Load-Bearing Walls and Their Structural Support in H...
BricknBolt Understanding Load-Bearing Walls and Their Structural Support in H...
BrickAndBolt
 
Brigade Insignia at Yelahanka Brochure.pdf
Brigade Insignia at Yelahanka Brochure.pdfBrigade Insignia at Yelahanka Brochure.pdf
Brigade Insignia at Yelahanka Brochure.pdf
SachinChauhan191
 
Investing In The US As A Canadian… And How To Do It RIGHT!! (feat. Erwin Szet...
Investing In The US As A Canadian… And How To Do It RIGHT!! (feat. Erwin Szet...Investing In The US As A Canadian… And How To Do It RIGHT!! (feat. Erwin Szet...
Investing In The US As A Canadian… And How To Do It RIGHT!! (feat. Erwin Szet...
Volition Properties
 
Presentation to Windust Meadows HOA Board of Directors June 4, 2024: Focus o...
Presentation to Windust Meadows HOA Board of Directors June 4, 2024:  Focus o...Presentation to Windust Meadows HOA Board of Directors June 4, 2024:  Focus o...
Presentation to Windust Meadows HOA Board of Directors June 4, 2024: Focus o...
Joseph Lewis Aguirre
 
Torun Center Residences Istanbul - Listing Turkey
Torun Center Residences Istanbul - Listing TurkeyTorun Center Residences Istanbul - Listing Turkey
Torun Center Residences Istanbul - Listing Turkey
Listing Turkey
 
Omaxe Sports City Dwarka A Comprehensive Guide
Omaxe Sports City Dwarka A Comprehensive GuideOmaxe Sports City Dwarka A Comprehensive Guide
Omaxe Sports City Dwarka A Comprehensive Guide
omaxesportscitydwark
 

Recently uploaded (20)

Deutsche EuroShop | Company Presentation | 06/24
Deutsche EuroShop | Company Presentation | 06/24Deutsche EuroShop | Company Presentation | 06/24
Deutsche EuroShop | Company Presentation | 06/24
 
Elegant Evergreen Homes - Luxury Apartments Redefining Comfort in Yelahanka, ...
Elegant Evergreen Homes - Luxury Apartments Redefining Comfort in Yelahanka, ...Elegant Evergreen Homes - Luxury Apartments Redefining Comfort in Yelahanka, ...
Elegant Evergreen Homes - Luxury Apartments Redefining Comfort in Yelahanka, ...
 
Urbanrise Paradise on Earth - Unveiling Unprecedented Luxury in Exquisite Vil...
Urbanrise Paradise on Earth - Unveiling Unprecedented Luxury in Exquisite Vil...Urbanrise Paradise on Earth - Unveiling Unprecedented Luxury in Exquisite Vil...
Urbanrise Paradise on Earth - Unveiling Unprecedented Luxury in Exquisite Vil...
 
SVN Live 6.3.24 Weekly Property Broadcast
SVN Live 6.3.24 Weekly Property BroadcastSVN Live 6.3.24 Weekly Property Broadcast
SVN Live 6.3.24 Weekly Property Broadcast
 
Biography and career about Lixin Azarmehr
Biography and career about Lixin AzarmehrBiography and career about Lixin Azarmehr
Biography and career about Lixin Azarmehr
 
One20 North Vancouver Floor Plans by Three Shores Development.
One20 North Vancouver Floor Plans by Three Shores Development.One20 North Vancouver Floor Plans by Three Shores Development.
One20 North Vancouver Floor Plans by Three Shores Development.
 
Architectural & Interior design portfolio.pdf
Architectural & Interior design portfolio.pdfArchitectural & Interior design portfolio.pdf
Architectural & Interior design portfolio.pdf
 
Optimizing Your MCA Lead Capture Process for Better Results
Optimizing Your MCA Lead Capture Process for Better ResultsOptimizing Your MCA Lead Capture Process for Better Results
Optimizing Your MCA Lead Capture Process for Better Results
 
One FNG by Group 108 Sector 142 Noida Construction Update
One FNG by Group 108 Sector 142 Noida Construction UpdateOne FNG by Group 108 Sector 142 Noida Construction Update
One FNG by Group 108 Sector 142 Noida Construction Update
 
How to Scan Tenants in NYC - You Should Know!
How to Scan Tenants in NYC - You Should Know!How to Scan Tenants in NYC - You Should Know!
How to Scan Tenants in NYC - You Should Know!
 
How to keep your Home naturally Cool and Warm
How to keep your Home naturally Cool and WarmHow to keep your Home naturally Cool and Warm
How to keep your Home naturally Cool and Warm
 
Green Homes, Islamabad Presentation .pdf
Green Homes, Islamabad Presentation .pdfGreen Homes, Islamabad Presentation .pdf
Green Homes, Islamabad Presentation .pdf
 
Hawthorn Module 1 Coverted to Slide Show - 04.06.2024.docx
Hawthorn Module 1 Coverted to Slide Show - 04.06.2024.docxHawthorn Module 1 Coverted to Slide Show - 04.06.2024.docx
Hawthorn Module 1 Coverted to Slide Show - 04.06.2024.docx
 
Rixos Tersane Istanbul Residences Brochure_May2024_ENG.pdf
Rixos Tersane Istanbul Residences Brochure_May2024_ENG.pdfRixos Tersane Istanbul Residences Brochure_May2024_ENG.pdf
Rixos Tersane Istanbul Residences Brochure_May2024_ENG.pdf
 
BricknBolt Understanding Load-Bearing Walls and Their Structural Support in H...
BricknBolt Understanding Load-Bearing Walls and Their Structural Support in H...BricknBolt Understanding Load-Bearing Walls and Their Structural Support in H...
BricknBolt Understanding Load-Bearing Walls and Their Structural Support in H...
 
Brigade Insignia at Yelahanka Brochure.pdf
Brigade Insignia at Yelahanka Brochure.pdfBrigade Insignia at Yelahanka Brochure.pdf
Brigade Insignia at Yelahanka Brochure.pdf
 
Investing In The US As A Canadian… And How To Do It RIGHT!! (feat. Erwin Szet...
Investing In The US As A Canadian… And How To Do It RIGHT!! (feat. Erwin Szet...Investing In The US As A Canadian… And How To Do It RIGHT!! (feat. Erwin Szet...
Investing In The US As A Canadian… And How To Do It RIGHT!! (feat. Erwin Szet...
 
Presentation to Windust Meadows HOA Board of Directors June 4, 2024: Focus o...
Presentation to Windust Meadows HOA Board of Directors June 4, 2024:  Focus o...Presentation to Windust Meadows HOA Board of Directors June 4, 2024:  Focus o...
Presentation to Windust Meadows HOA Board of Directors June 4, 2024: Focus o...
 
Torun Center Residences Istanbul - Listing Turkey
Torun Center Residences Istanbul - Listing TurkeyTorun Center Residences Istanbul - Listing Turkey
Torun Center Residences Istanbul - Listing Turkey
 
Omaxe Sports City Dwarka A Comprehensive Guide
Omaxe Sports City Dwarka A Comprehensive GuideOmaxe Sports City Dwarka A Comprehensive Guide
Omaxe Sports City Dwarka A Comprehensive Guide
 

Feb 2018 Market Reports for Bozeman, Belgrade, Livingston, Big Sky

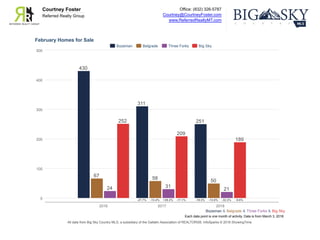
  • 1. Office: (832) 326-5787 Courtney@CourtneyFoster.com www.ReferredRealtyMT.com Courtney Foster Referred Realty Group Each data point is one month of activity. Data is from March 3, 2018. All data from Big Sky Country MLS, a subsidiary of the Gallatin Association of REALTORS®. InfoSparks © 2018 ShowingTime. February Homes for Sale Bozeman & Belgrade & Three Forks & Big Sky 0 100 200 300 400 500 2016 2017 2018 430 311 251 -27.7% -19.3% 67 58 50 -13.4% -13.8% 24 31 21 +29.2% -32.3% 252 209 189 -17.1% -9.6% Bozeman Belgrade Three Forks Big Sky
  • 2. Office: (832) 326-5787 Courtney@CourtneyFoster.com www.ReferredRealtyMT.com Courtney Foster Referred Realty Group Each data point is one month of activity. Data is from March 3, 2018. All data from Big Sky Country MLS, a subsidiary of the Gallatin Association of REALTORS®. InfoSparks © 2018 ShowingTime. February New Listings Bozeman & Belgrade & Three Forks & Big Sky 0 25 50 75 100 125 150 175 2016 2017 2018 144 130 111 -9.7% -14.6% 28 35 32 +25.0% -8.6% 7 8 12 +14.3% +50.0% 28 31 29 +10.7% -6.5% Bozeman Belgrade Three Forks Big Sky
  • 3. Office: (832) 326-5787 Courtney@CourtneyFoster.com www.ReferredRealtyMT.com Courtney Foster Referred Realty Group Each data point is one month of activity. Data is from March 2, 2018. All data from Big Sky Country MLS, a subsidiary of the Gallatin Association of REALTORS®. InfoSparks © 2018 ShowingTime. February Pending Sales Bozeman & Belgrade & Three Forks & Area 5 (Big Sky) 0 25 50 75 100 125 150 175 2016 2017 2018 151 105 122 -30.5% +16.2% 34 30 43 -11.8% +43.3% 7 3 9 -57.1% +200.0% 19 21 37 +10.5% +76.2% Bozeman Belgrade Three Forks Area 5 (Big Sky)
  • 4. Office: (832) 326-5787 Courtney@CourtneyFoster.com www.ReferredRealtyMT.com Courtney Foster Referred Realty Group Each data point is one month of activity. Data is from March 2, 2018. All data from Big Sky Country MLS, a subsidiary of the Gallatin Association of REALTORS®. InfoSparks © 2018 ShowingTime. February Closed Sales Bozeman & Belgrade & Three Forks & Area 5 (Big Sky) 0 20 40 60 80 100 2016 2017 2018 78 69 80 -11.5% +15.9% 21 24 21 +14.3% -12.5% 2 0 5 -100.0% –– 21 17 13 -19.0% -23.5% Bozeman Belgrade Three Forks Area 5 (Big Sky)
  • 5. Office: (832) 326-5787 Courtney@CourtneyFoster.com www.ReferredRealtyMT.com Courtney Foster Referred Realty Group Each data point is one month of activity. Data is from March 2, 2018. All data from Big Sky Country MLS, a subsidiary of the Gallatin Association of REALTORS®. InfoSparks © 2018 ShowingTime. February Average Sales Price Bozeman & Belgrade & Three Forks & Area 5 (Big Sky) $0 $0.2M $0.4M $0.6M $0.8M $1.0M 2016 2017 2018 $354,647 $406,096 $492,567 +14.5% +21.3% $247,471 $296,979 $386,012 +20.0% +30.0% $235,500 $340,750 –– –– $643,190 $720,115 $728,655 +12.0% +1.2% Bozeman Belgrade Three Forks Area 5 (Big Sky)
  • 6. Office: (832) 326-5787 Courtney@CourtneyFoster.com www.ReferredRealtyMT.com Courtney Foster Referred Realty Group Each data point is one month of activity. Data is from March 2, 2018. All data from Big Sky Country MLS, a subsidiary of the Gallatin Association of REALTORS®. InfoSparks © 2018 ShowingTime. February Months Supply of Homes for Sale Bozeman & Belgrade & Three Forks & Area 5 (Big Sky) 0.0 5.0 2.5 7.5 10.0 12.5 15.0 2016 2017 2018 3.3 2.3 2.0 -30.3% -13.0% 2.0 1.6 1.2 -20.0% -25.0% 4.9 5.1 2.9 +4.1% -43.1% 13.5 10.3 8.0 -23.7% -22.3% Bozeman Belgrade Three Forks Area 5 (Big Sky)
  • 7. Office: (832) 326-5787 Courtney@CourtneyFoster.com www.ReferredRealtyMT.com Courtney Foster Referred Realty Group Each data point is one month of activity. Data is from March 2, 2018. All data from Big Sky Country MLS, a subsidiary of the Gallatin Association of REALTORS®. InfoSparks © 2018 ShowingTime. February Median Days on Market Bozeman & Belgrade & Three Forks & Area 5 (Big Sky) 0 100 50 150 200 250 2016 2017 2018 62 73 43 +17.7% -41.1% 32 73 31 +128.1% -57.5% 67 63 –– –– 207 98 32 -52.7% -67.3% Bozeman Belgrade Three Forks Area 5 (Big Sky)
  • 8. Office: (832) 326-5787 Courtney@CourtneyFoster.com www.ReferredRealtyMT.com Courtney Foster Referred Realty Group Each data point is one month of activity. Data is from March 2, 2018. All data from Big Sky Country MLS, a subsidiary of the Gallatin Association of REALTORS®. InfoSparks © 2018 ShowingTime. February Median Price Per Square Foot Bozeman & Belgrade & Three Forks & Area 5 (Big Sky) $0 $100 $200 $300 $400 2016 2017 2018 $162 $183 $206 +13.0% +12.6% $125 $140 $157 +12.0% +12.1% $94 $139 –– –– $246 $272 $350 +10.6% +28.7% Bozeman Belgrade Three Forks Area 5 (Big Sky)
  • 9. Local Market Update – January 2018 This is a research tool provided by the Big Sky Country MLS Bozeman City Limits Single Family January Year to Date Key Metrics 2017 2018 % Change Thru 1-2017 Thru 1-2018 % Change New Listings 43 50 + 16.3% 43 50 + 16.3% Pending Sales 39 43 + 10.3% 39 43 + 10.3% Closed Sales 38 32 - 15.8% 38 32 - 15.8% Days on Market Until Sale 79 59 - 25.3% 79 59 - 25.3% Median Sales Price* $356,460 $395,000 + 10.8% $356,460 $395,000 + 10.8% Average Sales Price* $424,547 $463,643 + 9.2% $424,547 $463,643 + 9.2% Percent of List Price Received* 99.7% 99.3% - 0.4% 99.7% 99.3% - 0.4% Inventory of Homes for Sale 100 94 - 6.0% –– –– –– Months Supply of Inventory 2.0 2.0 0.0% –– –– –– Condo/Townhouse January Year to Date Key Metrics 2017 2018 % Change Thru 1-2017 Thru 1-2018 % Change New Listings 48 24 - 50.0% 48 24 - 50.0% Pending Sales 42 35 - 16.7% 42 35 - 16.7% Closed Sales 27 26 - 3.7% 27 26 - 3.7% Days on Market Until Sale 229 50 - 78.2% 229 50 - 78.2% Median Sales Price* $304,500 $281,950 - 7.4% $304,500 $281,950 - 7.4% Average Sales Price* $407,577 $364,908 - 10.5% $407,577 $364,908 - 10.5% Percent of List Price Received* 99.7% 99.6% - 0.1% 99.7% 99.6% - 0.1% Inventory of Homes for Sale 55 75 + 36.4% –– –– –– Months Supply of Inventory 1.4 2.1 + 50.0% –– –– –– * Does not account for sale concessions and/or downpayment assistance. | Percent changes are calculated using rounded figures and can sometimes look extreme due to small sample size. A rolling 12-month calculation represents the current month and the 11 months prior in a single data point. If no activity occurred during a month, the line extends to the next available data point. Median Sales Price - Single Family Rolling 12-Month Calculation Gallatin County Bozeman City Limits 1-2003 1-2005 1-2007 1-2009 1-2011 1-2013 1-2015 1-2017 $150,000 $200,000 $250,000 $300,000 $350,000 $400,000 Median Sales Price - Condo Rolling 12-Month Calculation Gallatin County Bozeman City Limits 1-2003 1-2005 1-2007 1-2009 1-2011 1-2013 1-2015 1-2017 $100,000 $150,000 $200,000 $250,000 $300,000 Current as of February 10, 2018. All data from Big Sky Country Multiple Listing Service®. Report © 2018 ShowingTime.
  • 10. Local Market Update – January 2018 This is a research tool provided by the Big Sky Country MLS Belgrade Single Family January Year to Date Key Metrics 2017 2018 % Change Thru 1-2017 Thru 1-2018 % Change New Listings 24 27 + 12.5% 24 27 + 12.5% Pending Sales 27 21 - 22.2% 27 21 - 22.2% Closed Sales 18 10 - 44.4% 18 10 - 44.4% Days on Market Until Sale 54 51 - 5.6% 54 51 - 5.6% Median Sales Price* $252,700 $264,900 + 4.8% $252,700 $264,900 + 4.8% Average Sales Price* $260,040 $282,448 + 8.6% $260,040 $282,448 + 8.6% Percent of List Price Received* 99.1% 98.8% - 0.3% 99.1% 98.8% - 0.3% Inventory of Homes for Sale 44 49 + 11.4% –– –– –– Months Supply of Inventory 1.7 1.7 0.0% –– –– –– Condo/Townhouse January Year to Date Key Metrics 2017 2018 % Change Thru 1-2017 Thru 1-2018 % Change New Listings 6 5 - 16.7% 6 5 - 16.7% Pending Sales 6 7 + 16.7% 6 7 + 16.7% Closed Sales 3 2 - 33.3% 3 2 - 33.3% Days on Market Until Sale 6 52 + 766.7% 6 52 + 766.7% Median Sales Price* $136,900 $237,750 + 73.7% $136,900 $237,750 + 73.7% Average Sales Price* $154,900 $237,750 + 53.5% $154,900 $237,750 + 53.5% Percent of List Price Received* 100.5% 98.9% - 1.6% 100.5% 98.9% - 1.6% Inventory of Homes for Sale 7 8 + 14.3% –– –– –– Months Supply of Inventory 1.0 1.1 + 10.0% –– –– –– * Does not account for sale concessions and/or downpayment assistance. | Percent changes are calculated using rounded figures and can sometimes look extreme due to small sample size. A rolling 12-month calculation represents the current month and the 11 months prior in a single data point. If no activity occurred during a month, the line extends to the next available data point. Median Sales Price - Single Family Rolling 12-Month Calculation Gallatin County Belgrade 1-2003 1-2005 1-2007 1-2009 1-2011 1-2013 1-2015 1-2017 $100,000 $150,000 $200,000 $250,000 $300,000 $350,000 $400,000 Median Sales Price - Condo Rolling 12-Month Calculation Gallatin County Belgrade 1-2003 1-2005 1-2007 1-2009 1-2011 1-2013 1-2015 1-2017 $50,000 $100,000 $150,000 $200,000 $250,000 $300,000 Current as of February 10, 2018. All data from Big Sky Country Multiple Listing Service®. Report © 2018 ShowingTime.
  • 11. Local Market Update – January 2018 This is a research tool provided by the Big Sky Country MLS Greater Big Sky Single Family January Year to Date Key Metrics 2017 2018 % Change Thru 1-2017 Thru 1-2018 % Change New Listings 2 7 + 250.0% 2 7 + 250.0% Pending Sales 5 6 + 20.0% 5 6 + 20.0% Closed Sales 1 0 - 100.0% 1 0 - 100.0% Days on Market Until Sale 189 –– –– 189 –– –– Median Sales Price* $505,000 –– –– $505,000 –– –– Average Sales Price* $505,000 –– –– $505,000 –– –– Percent of List Price Received* 95.5% –– –– 95.5% –– –– Inventory of Homes for Sale 76 72 - 5.3% –– –– –– Months Supply of Inventory 13.3 10.9 - 18.0% –– –– –– Condo/Townhouse January Year to Date Key Metrics 2017 2018 % Change Thru 1-2017 Thru 1-2018 % Change New Listings 8 23 + 187.5% 8 23 + 187.5% Pending Sales 20 19 - 5.0% 20 19 - 5.0% Closed Sales 7 12 + 71.4% 7 12 + 71.4% Days on Market Until Sale 196 92 - 53.1% 196 92 - 53.1% Median Sales Price* $350,000 $349,500 - 0.1% $350,000 $349,500 - 0.1% Average Sales Price* $342,286 $392,458 + 14.7% $342,286 $392,458 + 14.7% Percent of List Price Received* 93.3% 96.1% + 3.0% 93.3% 96.1% + 3.0% Inventory of Homes for Sale 102 123 + 20.6% –– –– –– Months Supply of Inventory 7.1 8.6 + 21.1% –– –– –– * Does not account for sale concessions and/or downpayment assistance. | Percent changes are calculated using rounded figures and can sometimes look extreme due to small sample size. A rolling 12-month calculation represents the current month and the 11 months prior in a single data point. If no activity occurred during a month, the line extends to the next available data point. Median Sales Price - Single Family Rolling 12-Month Calculation Gallatin County Greater Big Sky 1-2003 1-2005 1-2007 1-2009 1-2011 1-2013 1-2015 1-2017 $0 $500,000 $1,000,000 $1,500,000 $2,000,000 Median Sales Price - Condo Rolling 12-Month Calculation Gallatin County Greater Big Sky 1-2003 1-2005 1-2007 1-2009 1-2011 1-2013 1-2015 1-2017 $0 $100,000 $200,000 $300,000 $400,000 $500,000 $600,000 Current as of February 10, 2018. All data from Big Sky Country Multiple Listing Service®. Report © 2018 ShowingTime.
  • 12. Local Market Update – January 2018 This is a research tool provided by the Big Sky Country MLS Livingston City Limits Single Family January Year to Date Key Metrics 2017 2018 % Change Thru 1-2017 Thru 1-2018 % Change New Listings 7 9 + 28.6% 7 9 + 28.6% Pending Sales 13 8 - 38.5% 13 8 - 38.5% Closed Sales 6 9 + 50.0% 6 9 + 50.0% Days on Market Until Sale 68 34 - 50.0% 68 34 - 50.0% Median Sales Price* $176,500 $238,500 + 35.1% $176,500 $238,500 + 35.1% Average Sales Price* $186,283 $240,578 + 29.1% $186,283 $240,578 + 29.1% Percent of List Price Received* 96.3% 93.9% - 2.5% 96.3% 93.9% - 2.5% Inventory of Homes for Sale 31 25 - 19.4% –– –– –– Months Supply of Inventory 2.7 2.0 - 25.9% –– –– –– Condo/Townhouse January Year to Date Key Metrics 2017 2018 % Change Thru 1-2017 Thru 1-2018 % Change New Listings 0 3 –– 0 3 –– Pending Sales 0 3 –– 0 3 –– Closed Sales 1 2 + 100.0% 1 2 + 100.0% Days on Market Until Sale 76 1 - 98.7% 76 1 - 98.7% Median Sales Price* $148,000 $218,000 + 47.3% $148,000 $218,000 + 47.3% Average Sales Price* $148,000 $218,000 + 47.3% $148,000 $218,000 + 47.3% Percent of List Price Received* 96.7% 100.0% + 3.4% 96.7% 100.0% + 3.4% Inventory of Homes for Sale 7 6 - 14.3% –– –– –– Months Supply of Inventory 4.2 1.9 - 54.8% –– –– –– * Does not account for sale concessions and/or downpayment assistance. | Percent changes are calculated using rounded figures and can sometimes look extreme due to small sample size. A rolling 12-month calculation represents the current month and the 11 months prior in a single data point. If no activity occurred during a month, the line extends to the next available data point. Median Sales Price - Single Family Rolling 12-Month Calculation Gallatin County Livingston City Limits 1-2003 1-2005 1-2007 1-2009 1-2011 1-2013 1-2015 1-2017 $50,000 $100,000 $150,000 $200,000 $250,000 $300,000 $350,000 $400,000 Median Sales Price - Condo Rolling 12-Month Calculation Gallatin County Livingston City Limits 1-2003 1-2005 1-2007 1-2009 1-2011 1-2013 1-2015 1-2017 $50,000 $100,000 $150,000 $200,000 $250,000 $300,000 Current as of February 10, 2018. All data from Big Sky Country Multiple Listing Service®. Report © 2018 ShowingTime.