April 2011 final stats
•Download as PPT, PDF•
0 likes•264 views
Average Price 2.3% Median Price 0.3% Residential Units Sold 4.7% Inventory Levels 6.7% Number of Listings 3.9% Foreclosures 26.1% Interest Rates are at historic lows
Report
Share
Report
Share

Recommended
Douglas County Colorado Home Statistics May 2016
The document summarizes key real estate metrics for Douglas County and the entire MLS region for May 2015, May 2016, and year-to-date figures through May 2015 and 2016. It shows that while inventory of active listings decreased, properties under contract and median sales prices increased from the previous years. Specifically, median sales prices rose over 6% for Douglas County and over 13% for the single month of May 2016 compared to the previous year.
Fraser Valley Real Estate Board August 2021 Statistics
- Home sales in the Fraser Valley remained elevated in August 2021, with 2,087 property sales representing a 2.4% increase from August 2020 and a 4% increase from July 2021. This was the second highest sales level ever recorded for the month of August.
- Housing supply remains extremely low, at levels last seen in the early 1980s, with total active listings down 44.9% from August 2020. The lack of supply is putting upward pressure on home prices across the region.
- Benchmark home prices rose between 1-31% across housing types compared to August 2020, with the average price of a detached home in the Fraser Valley increasing 50% over the past five years despite government measures aimed at improving afford
Fraser Valley Real Estate Board Stats Package Feb 2021
- In February 2021, the Fraser Valley real estate market saw record property sales of 2,815, an increase of 108% from February 2020. This was the sixth consecutive month of record-breaking sales.
- The average number of days to sell a single-family home or townhome was 21 days, while apartments took an average of 35 days to sell.
- Benchmark home prices across property types increased from January 2021, with single-family detached homes seeing the largest increase of 5.1%. Inventory remained low due to high demand and a lack of new listings entering the market.
Fraser Valley Real Estate Board May 2021 Statistics Package
Near record-breaking new listings in May were not enough to match insatiable buyer demand in the Fraser Valley real estate market. Sales reached 2,951, near the record of 2,911 set in 2016, while new listings of 3,926 approached the record of 2018. Total active inventory was 5,868, down 9% from May 2020. The average number of days to sell a single-family home was 14 days. Benchmark home prices continued to increase from April 2021.
FVREB October 2020 Statistics Package
Sales volumes of real estate in the Fraser Valley reached their highest point for October, with 2,370 sales representing a 48.9% increase from October 2019. New listings also increased compared to last year. Benchmark home prices increased across all major property types compared to last October, with detached homes seeing a 9.9% increase. The real estate market remains strong despite the pandemic, though inventory levels are decreasing, with only 1.4 months of supply for detached homes in Langley if no new listings were added. Real estate professionals are encouraging online and virtual interactions to complete sales safely during the pandemic.
San Francisco Market Focus March 2015
Residential real estate activity in San Francisco saw increases in median sales prices and pending sales in March 2015 compared to the previous year. The median sales price for single family homes rose 27.6% to $1,250,000, while the median price for condos increased 14% to $1,100,000. Pending sales for single family homes were up 6%, though pending sales for condos fell slightly by 0.7%. New listings declined for both single family homes and condos. Overall the real estate market in San Francisco remained strong with higher prices and sales activity despite reductions in inventory.
Fraser Valley Real Estate Board July 2021 Statistics
In July 2021, home sales in the Fraser Valley remained steady compared to the previous month with 2,006 property sales. New listings decreased by 31.5% compared to July 2020. Total active inventory reached the lowest level for July since 1981 with 4,901 properties, a 33% decrease from July 2020. The average price of homes increased 17% compared to July 2020, to $969,172.
2014 Market Forecast - California Association of Realtors
The document summarizes California's housing market outlook for 2008-2014. It shows that after declining until 2011, home sales and median home prices in California increased in 2012-2013 and are projected to continue rising in 2014. Mortgage interest rates have also trended downward since 2008 and are expected to remain low. Overall the data indicates the California housing market has recovered from the recession and conditions will continue improving in the coming year.
FVREB July 2020 Stats
- Sales and new listings in the Fraser Valley region reached near record-setting levels in July 2020, with 2,100 sales (a 44% increase over July 2019) and 3,549 new listings (a 27% increase over July 2019).
- The strong demand is attributed to pent-up demand from the spring market and record-low interest rates, while low inventory levels are putting upward pressure on home prices in some communities.
- Benchmark home prices in July increased between 1-5% compared to July 2019 across detached homes, townhomes, and apartments in the region.
Fvreb Sept 2020 Stats
- Housing market activity in the Fraser Valley reached record levels in September, with home sales and new listings seeing the highest numbers ever recorded for the month.
- Sales increased 66.1% compared to September 2019 and 9.4% compared to August 2020, reaching 2,231 total sales. New listings also saw a record at 3,515, up 26.9% and 6.2% respectively.
- Demand has shifted towards single family detached homes, making up 47% of sales compared to 43% in the same period last year. Benchmark home prices also increased across all property types.
San Francisco Market Focus May 2016
The monthly real estate snapshot report summarizes residential real estate activity in San Francisco for May 2016. Key metrics showed that new listings were down 10.8% for single family homes and 4.2% for condos from the previous year. Pending sales increased 18.2% for single family but decreased 3.4% for condos. Median sales prices were down slightly at 1.4% for single family homes and 1.1% for condos from the previous year. Inventory levels increased while demand remained high, putting pressure on housing supply.
FVREB April 2021 Statistics Package
- Fraser Valley real estate saw record-breaking home sales in April 2021, with 3,016 sales, surpassing the previous record set in 2016.
- New home listings also increased substantially in April 2021 compared to the previous year, helping improve housing supply.
- The large influx of new listings has started to slow price increases as the market responds to more inventory and buyers have more options.
Fraser Valley Real Estate Board Statistics - November 2021
- Home sales in the Fraser Valley region of BC continued to increase in November 2021, with 1,972 sales of all property types. This was a decrease of 9.2% from November 2020 but an increase of 1.8% from October 2021.
- New property listings also decreased, with 2,096 new listings in November 2021, down 5.5% from November 2020. Active inventory continued to decline sharply, down 47.9% from November 2020.
- The president of the Fraser Valley Real Estate Board said lack of housing supply remains the biggest challenge, and buyers and sellers are relying on their realtors' experience to navigate multiple offer situations and fast market conditions.
Fraser Valley Real Estate Board Statistics Package October 2021
- MLS home sales in the Fraser Valley remained strong in October at 1,938 sales, an increase of 3.9% from September but a decrease of 18.2% from October 2020.
- New property listings decreased 29% from October 2020 and 6.6% from September 2021, contributing to low inventory levels.
- Benchmark home prices increased across all major property types compared to September 2021, with detached homes seeing the largest increase of 2.5% to $1,396,700.
Fvreb August 2020 Stats Package
- Sales and new listings in the Fraser Valley set records in August 2020, with 2,039 sales (up 57.2% year-over-year) and 3,309 new listings (up 40.4% year-over-year).
- The average prices of single-family homes, townhomes, and apartments all increased compared to August 2019, with benchmark prices up 6.9%, 3%, and 4% respectively.
- REB President Chris Shields noted the market remains competitive with multiple offers and shorter days on market, and consumers are seeking expert guidance from REALTORS.
Fraser Valley Real Estate Board November 2020 statistics package
- Housing demand in the Fraser Valley region of BC continued at record levels in November, with home sales up 54.7% compared to November 2019.
- A total of 2,173 housing units of all types were sold in November, setting a new monthly sales record.
- The average number of days on the market for detached homes was 32 days, while townhomes sold within 25 days and apartments within 34 days.
- Benchmark home prices increased across all major property types compared to November 2019, with detached homes up 11.5%, townhomes up 5.8%, and apartments up 4.6%.
Aculist_TrendsMasterCity_Combo_SFR_Apr_2016
This document contains market data for single family homes in Foster City, Menlo Park, and San Carlos for April 2016. It shows the number of new listings, closed sales, median days on market, median sale price, percentage of list price received, and average price per square foot for the past year, last month, and this month with comparisons to last month. The median sale prices increased year-over-year in all three cities.
FVREB September 2021 Statistics Package
- Housing sales in the Fraser Valley decreased in September compared to August but were the second highest for the month of September in the past 100 years.
- New housing listings increased compared to August but inventory remains low.
- Demand remains strong across the region while low inventory continues to pose challenges for buyers. Benchmark home prices rose in September across all major property types compared to the previous year.
July fvreb stats package
- Home sales in the Fraser Valley rebounded in July, increasing 11.6% compared to June 2019. New listings decreased slightly.
- The benchmark prices for single family detached homes and townhomes decreased compared to last year, while prices for apartments remained unchanged.
- REALTORS saw more activity at open houses in July and an increase in first-time home buyers, indicating improved consumer confidence in the market.
Fvreb package april 2020
- Real estate activity in the Fraser Valley saw a steep decline in April 2020 in response to measures taken to reduce the spread of COVID-19. Sales were down 52% from March and 50% from April 2019, which was one of the slowest Aprils on record.
- New property listings also declined significantly, down 47% from March and 58% from the previous year. Despite fewer transactions, realtors continued advising clients through virtual services.
- Benchmark home prices in the region increased modestly for detached homes and townhouses compared to March 2020, while apartment prices remained stable. The real estate market remained balanced as new listings declined faster than sales.
The Fraser Valley Real Estate Statistics Package
- Home sales in the Fraser Valley region of BC were down 29.3% from the 10-year average for the month of June and were the second lowest total for June since 2000. New property listings also decreased.
- Both buyers and sellers are taking a wait-and-see approach in the current market, which has led to historically low home purchases and some sellers delaying listing their homes. This is creating more inventory and lower home prices compared to a year ago.
- The average number of days to sell a single-family detached home was 35.6 days in June, while townhomes sold in an average of 31.6 days and apartments in 37.5 days.
Fraser Valley Real Estate Board June 2020
- Property sales in the Fraser Valley more than doubled from May to June 2020, increasing 113% as buyers returned to the market.
- New property listings also increased significantly, rising 57% from May to June while active listings rose 9%.
- The average prices of detached homes, townhomes, and apartments all increased between 1-4% compared to June 2019, with benchmark prices also rising, indicating stability in the housing market despite the pandemic.
Fvreb aug 2019 stats package
The housing market in the Fraser Valley region of BC continued to stabilize in August 2019, with home sales increasing 12.3% compared to August 2018. Total home sales in August 2019 were 1,297, with sales of single-family detached homes up 18% and townhomes up 9.2% compared to the previous year. While active listings increased 9.6% year-over-year to 8,040, new property listings in August declined 8.5% compared to August 2018. Benchmark home prices decreased across property types compared to the previous year, with single-family detached prices down 5.4%, townhome prices down 4.9%, and apartment prices down 7.7%.
New London County Real Estate Update
This report of Single Family Home Sales in New London County is generated by the 10th of each month with information from the previous month. It includes new listings, pending and closed sales in New London County for the month of May
Fraser Valley Stats Package September 2019
The Fraser Valley Statistics Package for the real estate market of September 2019 with charts and graphs.
New London County Real Estate Update
This document summarizes real estate data for March 2016 in New London County, Connecticut. It reports that closed home sales increased 24.3% compared to February 2016 and 12.5% compared to March 2015. The median sold price decreased slightly by 2.8% compared to the previous month but was relatively flat compared to a year ago. Pending home sales were up 15.4% from the prior month while new listings increased 64.3% from February 2016.
Fvreb oct stats package 2019
- Home sales in the Fraser Valley increased significantly in October 2019 compared to both September 2019 and October 2018, with sales up 18.5% and 37.8% respectively.
- While new listings decreased compared to the previous year and month, overall active listings also declined, down 4.5% and 6.9%.
- Benchmark home prices were mixed, with detached homes up slightly but townhouses and apartments down slightly to moderately compared to the previous year.
Feb 20 package fvreb
- Home sales in the Fraser Valley increased 39% in February 2020 compared to January 2020 and 38% compared to February 2019, outpacing new listings which increased 15% month-over-month but decreased 15% year-over-year.
- Inventory levels remained below historical averages at 5,741 active listings as of the end of February, up 12% from January but down 10% from February 2019.
- Benchmark home prices in the region increased between 1-1.5% across detached homes, townhomes, and apartments compared to both the previous month and February 2019.
July 2013's Monthly Indicators report - Boston Real Estate Market Trends
Here's July 2013's Monthly Indicators report from the Greater Boston Association of Realtors.
What's going on in the Boston real estate market?
• July volume of closed sales (all property types) UP +17.2% over July, 2012
• July single-family market median sales price UP 4.5% over July, 2012
• July condo market median sales price UP 4% over July, 2012
August 2015 Greater Boston Real Estate Market Trends Report
The document provides an overview of housing market indicators for the Greater Boston region in August 2015. Key points include:
- Closed home sales increased 13.5% year-over-year for single-family homes and 4.6% for condominiums.
- The median sales price was up 2.0% to $499,900 for single-family homes and 9.8% to $460,000 for condominiums.
- Inventory levels decreased with months supply of inventory down 23.3% for single-family homes and 17.5% for condominiums.
More Related Content
What's hot
FVREB July 2020 Stats
- Sales and new listings in the Fraser Valley region reached near record-setting levels in July 2020, with 2,100 sales (a 44% increase over July 2019) and 3,549 new listings (a 27% increase over July 2019).
- The strong demand is attributed to pent-up demand from the spring market and record-low interest rates, while low inventory levels are putting upward pressure on home prices in some communities.
- Benchmark home prices in July increased between 1-5% compared to July 2019 across detached homes, townhomes, and apartments in the region.
Fvreb Sept 2020 Stats
- Housing market activity in the Fraser Valley reached record levels in September, with home sales and new listings seeing the highest numbers ever recorded for the month.
- Sales increased 66.1% compared to September 2019 and 9.4% compared to August 2020, reaching 2,231 total sales. New listings also saw a record at 3,515, up 26.9% and 6.2% respectively.
- Demand has shifted towards single family detached homes, making up 47% of sales compared to 43% in the same period last year. Benchmark home prices also increased across all property types.
San Francisco Market Focus May 2016
The monthly real estate snapshot report summarizes residential real estate activity in San Francisco for May 2016. Key metrics showed that new listings were down 10.8% for single family homes and 4.2% for condos from the previous year. Pending sales increased 18.2% for single family but decreased 3.4% for condos. Median sales prices were down slightly at 1.4% for single family homes and 1.1% for condos from the previous year. Inventory levels increased while demand remained high, putting pressure on housing supply.
FVREB April 2021 Statistics Package
- Fraser Valley real estate saw record-breaking home sales in April 2021, with 3,016 sales, surpassing the previous record set in 2016.
- New home listings also increased substantially in April 2021 compared to the previous year, helping improve housing supply.
- The large influx of new listings has started to slow price increases as the market responds to more inventory and buyers have more options.
Fraser Valley Real Estate Board Statistics - November 2021
- Home sales in the Fraser Valley region of BC continued to increase in November 2021, with 1,972 sales of all property types. This was a decrease of 9.2% from November 2020 but an increase of 1.8% from October 2021.
- New property listings also decreased, with 2,096 new listings in November 2021, down 5.5% from November 2020. Active inventory continued to decline sharply, down 47.9% from November 2020.
- The president of the Fraser Valley Real Estate Board said lack of housing supply remains the biggest challenge, and buyers and sellers are relying on their realtors' experience to navigate multiple offer situations and fast market conditions.
Fraser Valley Real Estate Board Statistics Package October 2021
- MLS home sales in the Fraser Valley remained strong in October at 1,938 sales, an increase of 3.9% from September but a decrease of 18.2% from October 2020.
- New property listings decreased 29% from October 2020 and 6.6% from September 2021, contributing to low inventory levels.
- Benchmark home prices increased across all major property types compared to September 2021, with detached homes seeing the largest increase of 2.5% to $1,396,700.
Fvreb August 2020 Stats Package
- Sales and new listings in the Fraser Valley set records in August 2020, with 2,039 sales (up 57.2% year-over-year) and 3,309 new listings (up 40.4% year-over-year).
- The average prices of single-family homes, townhomes, and apartments all increased compared to August 2019, with benchmark prices up 6.9%, 3%, and 4% respectively.
- REB President Chris Shields noted the market remains competitive with multiple offers and shorter days on market, and consumers are seeking expert guidance from REALTORS.
Fraser Valley Real Estate Board November 2020 statistics package
- Housing demand in the Fraser Valley region of BC continued at record levels in November, with home sales up 54.7% compared to November 2019.
- A total of 2,173 housing units of all types were sold in November, setting a new monthly sales record.
- The average number of days on the market for detached homes was 32 days, while townhomes sold within 25 days and apartments within 34 days.
- Benchmark home prices increased across all major property types compared to November 2019, with detached homes up 11.5%, townhomes up 5.8%, and apartments up 4.6%.
Aculist_TrendsMasterCity_Combo_SFR_Apr_2016
This document contains market data for single family homes in Foster City, Menlo Park, and San Carlos for April 2016. It shows the number of new listings, closed sales, median days on market, median sale price, percentage of list price received, and average price per square foot for the past year, last month, and this month with comparisons to last month. The median sale prices increased year-over-year in all three cities.
FVREB September 2021 Statistics Package
- Housing sales in the Fraser Valley decreased in September compared to August but were the second highest for the month of September in the past 100 years.
- New housing listings increased compared to August but inventory remains low.
- Demand remains strong across the region while low inventory continues to pose challenges for buyers. Benchmark home prices rose in September across all major property types compared to the previous year.
July fvreb stats package
- Home sales in the Fraser Valley rebounded in July, increasing 11.6% compared to June 2019. New listings decreased slightly.
- The benchmark prices for single family detached homes and townhomes decreased compared to last year, while prices for apartments remained unchanged.
- REALTORS saw more activity at open houses in July and an increase in first-time home buyers, indicating improved consumer confidence in the market.
Fvreb package april 2020
- Real estate activity in the Fraser Valley saw a steep decline in April 2020 in response to measures taken to reduce the spread of COVID-19. Sales were down 52% from March and 50% from April 2019, which was one of the slowest Aprils on record.
- New property listings also declined significantly, down 47% from March and 58% from the previous year. Despite fewer transactions, realtors continued advising clients through virtual services.
- Benchmark home prices in the region increased modestly for detached homes and townhouses compared to March 2020, while apartment prices remained stable. The real estate market remained balanced as new listings declined faster than sales.
The Fraser Valley Real Estate Statistics Package
- Home sales in the Fraser Valley region of BC were down 29.3% from the 10-year average for the month of June and were the second lowest total for June since 2000. New property listings also decreased.
- Both buyers and sellers are taking a wait-and-see approach in the current market, which has led to historically low home purchases and some sellers delaying listing their homes. This is creating more inventory and lower home prices compared to a year ago.
- The average number of days to sell a single-family detached home was 35.6 days in June, while townhomes sold in an average of 31.6 days and apartments in 37.5 days.
Fraser Valley Real Estate Board June 2020
- Property sales in the Fraser Valley more than doubled from May to June 2020, increasing 113% as buyers returned to the market.
- New property listings also increased significantly, rising 57% from May to June while active listings rose 9%.
- The average prices of detached homes, townhomes, and apartments all increased between 1-4% compared to June 2019, with benchmark prices also rising, indicating stability in the housing market despite the pandemic.
Fvreb aug 2019 stats package
The housing market in the Fraser Valley region of BC continued to stabilize in August 2019, with home sales increasing 12.3% compared to August 2018. Total home sales in August 2019 were 1,297, with sales of single-family detached homes up 18% and townhomes up 9.2% compared to the previous year. While active listings increased 9.6% year-over-year to 8,040, new property listings in August declined 8.5% compared to August 2018. Benchmark home prices decreased across property types compared to the previous year, with single-family detached prices down 5.4%, townhome prices down 4.9%, and apartment prices down 7.7%.
New London County Real Estate Update
This report of Single Family Home Sales in New London County is generated by the 10th of each month with information from the previous month. It includes new listings, pending and closed sales in New London County for the month of May
Fraser Valley Stats Package September 2019
The Fraser Valley Statistics Package for the real estate market of September 2019 with charts and graphs.
New London County Real Estate Update
This document summarizes real estate data for March 2016 in New London County, Connecticut. It reports that closed home sales increased 24.3% compared to February 2016 and 12.5% compared to March 2015. The median sold price decreased slightly by 2.8% compared to the previous month but was relatively flat compared to a year ago. Pending home sales were up 15.4% from the prior month while new listings increased 64.3% from February 2016.
Fvreb oct stats package 2019
- Home sales in the Fraser Valley increased significantly in October 2019 compared to both September 2019 and October 2018, with sales up 18.5% and 37.8% respectively.
- While new listings decreased compared to the previous year and month, overall active listings also declined, down 4.5% and 6.9%.
- Benchmark home prices were mixed, with detached homes up slightly but townhouses and apartments down slightly to moderately compared to the previous year.
Feb 20 package fvreb
- Home sales in the Fraser Valley increased 39% in February 2020 compared to January 2020 and 38% compared to February 2019, outpacing new listings which increased 15% month-over-month but decreased 15% year-over-year.
- Inventory levels remained below historical averages at 5,741 active listings as of the end of February, up 12% from January but down 10% from February 2019.
- Benchmark home prices in the region increased between 1-1.5% across detached homes, townhomes, and apartments compared to both the previous month and February 2019.
What's hot (20)
Fraser Valley Real Estate Board Statistics - November 2021
Fraser Valley Real Estate Board Statistics - November 2021
Fraser Valley Real Estate Board Statistics Package October 2021
Fraser Valley Real Estate Board Statistics Package October 2021
Fraser Valley Real Estate Board November 2020 statistics package
Fraser Valley Real Estate Board November 2020 statistics package
Similar to April 2011 final stats
July 2013's Monthly Indicators report - Boston Real Estate Market Trends
Here's July 2013's Monthly Indicators report from the Greater Boston Association of Realtors.
What's going on in the Boston real estate market?
• July volume of closed sales (all property types) UP +17.2% over July, 2012
• July single-family market median sales price UP 4.5% over July, 2012
• July condo market median sales price UP 4% over July, 2012
August 2015 Greater Boston Real Estate Market Trends Report
The document provides an overview of housing market indicators for the Greater Boston region in August 2015. Key points include:
- Closed home sales increased 13.5% year-over-year for single-family homes and 4.6% for condominiums.
- The median sales price was up 2.0% to $499,900 for single-family homes and 9.8% to $460,000 for condominiums.
- Inventory levels decreased with months supply of inventory down 23.3% for single-family homes and 17.5% for condominiums.
San Francisco Market Focus June 2016
Halfway through 2016, the San Francisco residential real estate market is performing as expected, with sales and prices up in most areas while inventory remains low. Specifically:
- Median sales prices increased 3.8% for single-family homes and 7% for condos over the past year.
- New listings were down 21% for single-family but up 13% for condos. Pending sales fell 1% for single-family and 16% for condos.
- Months of supply decreased 5% for single-family but increased 58% for condos, indicating the inventory issue is more pronounced in the condo market.
The document provides detailed data on housing activity and market metrics in San
San Francisco Market Focus August 2016
Residential real estate activity in San Francisco decreased in August 2016. New listings and pending sales declined for both single family homes and condos/co-ops compared to the previous year. The median sales price increased slightly for single family homes but decreased for condos/co-ops. Low inventory continued to be a challenge, putting upward pressure on home prices.
San Francisco Market Focus April 2016
The real estate market in San Francisco remained strong in April 2016, with several key metrics showing year-over-year increases. The median sales price rose 7.1% for single family homes to $1,400,000, and increased 6.6% for condos to $1,149,000. Meanwhile, new listings declined slightly while inventory levels were up. Overall the market conditions were described as predictable with low interest rates and steady price increases in desirable areas.
San Francisco Market Focus March 2016
The document provides a monthly snapshot of real estate activity in San Francisco for March 2016. Some key highlights include:
- Median home sale prices increased 8.4% year-over-year for single family homes but were flat for condos.
- New listings and pending sales decreased compared to previous months and year-ago levels across both single family homes and condos.
- Inventory levels remained flat for single family but increased 22.2% for condos, suggesting the market may be slowing.
- The report concludes that demand remains but low inventory could limit further sales growth in the year ahead if supply does not increase.
San Francisco Market Focus April 2015
The document provides residential real estate statistics for San Francisco for April 2015. It summarizes that new listings decreased 14.1% for single family homes and 15.8% for condos from the previous year. Median sales prices increased substantially, up 20.6% for single family homes to $1,326,500 and 21.7% for condos to $1,101,000. Months of inventory decreased for both single family homes and condos compared to the previous year.
January 2014 Greater Boston Real Estate Market Trends Report
The document provides an overview of the Greater Boston housing market in January 2014. It finds that closed sales of single-family homes decreased 6.0% year-over-year while condo sales increased 0.8%. The median sales price rose 12.8% for single-family homes and 13.9% for condos. Inventory levels fell substantially, with months supply of inventory decreasing 24.9% for single-family homes and 30.9% for condos. The housing market is continuing its recovery, though growth may moderate in 2014 with increases in seller activity, new construction, and fewer foreclosures expected.
San Francisco Market Focus May 2013
This monthly snapshot summarizes real estate activity in San Francisco for May 2013. Key points include:
- Median home sales prices increased 35.6% for single family homes and 18.2% for condos year-over-year.
- New listings rose 20.1% for single family but fell 5.1% for condos. Pending sales were up for both.
- Inventory levels decreased with months supply down 23.1% for single family and 36.4% for condos.
- The market remains heated with strong demand and constrained supply driving prices higher.
August 2016 Boston Real Estate Market Trends
- Closed sales for single-family homes decreased 0.4% in August 2016 compared to the previous year, while closed sales for condominiums decreased 4.1%. Pending sales increased for both single-family homes and condominiums. Inventory decreased significantly for both property types.
- The median sales price increased substantially for both single-family homes (+8.7%) and condominiums (+9.4%) in August 2016 compared to the previous year. Days on the market increased slightly for single-family homes but decreased for condominiums.
- Low inventory continues to be a major factor impacting the real estate market, keeping prices high despite slowing sales in some areas. Builders
August 2016 Boston Real Estate Market Trends
- Closed sales for single-family homes decreased 0.4% in August 2016 compared to the previous year, while closed sales for condominiums decreased 4.1%. Pending sales increased for both single-family homes and condominiums.
- Inventory decreased significantly for both single-family homes (28.1%) and condominiums (24.9%) compared to the previous year.
- Median sales prices increased substantially for both single-family homes (8.7%) and condominiums (9.4%).
April 2013's Monthly Indicators report - Boston Real Estate Market Trends
Here's April 2013's Monthly Indicators report from the Greater Boston Association of Realtors®. What's going on in the Boston real estate market?
• Shortage of homes to buy has pushed sales down in April as buyer interest remains high.
• Prices continue to move up because demand for available homes to buy is outpacing supply.
• Sellers are gaining confidence as new listings added to the market jumped in April.
San Francisco Market Focus January 2016
Residential real estate activity in San Francisco saw decreases in new listings and pending sales in January 2016 compared to the previous year. The median sales price increased 19.0% year-over-year for single family homes and 17.8% for condos. Inventory decreased for single family homes but increased for condos. Overall, the real estate market remained strong with continued price increases and steady activity levels.
December 2016 Greater Boston Real Estate Market Trends
Here’s December 2016’s Monthly Indicators report from the Greater Boston Association of Realtors® showing Boston real estate market trends.
September 2015 Greater Boston Real Estate Market Trends Report
The real estate market in the Greater Boston region experienced positive trends in the third quarter of 2015. New listings increased 10.9% for single-family homes and 11.3% for condominiums. Closed sales rose 15% for single-family homes and 4.1% for condominiums. Median sales prices increased 7.5% for single-family homes to $455,000 and 3.4% for condominiums to $428,500. Months of inventory decreased significantly. Overall, the housing market remains healthy with continued job growth and low interest rates.
San Francisco Market Focus June 2017
The document provides a monthly snapshot of real estate activity in San Francisco for June 2017. Some key points:
- Median sales prices for single-family homes increased 10.8% year-over-year while median prices for condos decreased 2.6%.
- New listings were down 18.1% for single family homes and 36% for condos compared to the previous year. Pending sales rose for both single family homes and condos.
- Inventory levels decreased significantly with months of supply dropping 30.4% for single family homes and 40% for condos.
San Francisco Market Focus February 2016
- Residential real estate activity in San Francisco saw a 26.5% year-over-year increase in the median sales price of single family homes to $1,410,000 in February 2016, though the median price of condos decreased 0.5% to $1,095,000.
- Inventory levels decreased for single family properties but increased for condos, while new listings were down 18.5% and 9.1% respectively and pending sales decreased for single family but increased for condos.
- Low inventory continues to be a key issue, constraining further growth in sales activity despite strong demand, low interest rates, and economic growth.
February 2015 Greater Boston Real Estate Market Trends Report
Here’s February 2015’s Monthly Indicators report from the Greater Boston Association of Realtors®
February condo sales closed down by almost two percent compared to the year before. Median prices continued to go up as supply continues to be down. Sellers were waiting out Mother Nature to add their homes to the market keeping new listings down in February.
• February single-family home sales: UP +5.0% over February 2014; median prices UP +7.9% ($439,500)
• February condo sales DOWN -1.8% over February 2014; median prices UP +3.5% ($403,568)
• Inventory in February DOWN -29.3% to 1,992 and Condominiums Down -32.9% to 1,057
• SF listings added to the market in February DOWN -38.7% over last year. (700 from 1,141 in 2014)
• Condo listings added to the market DOWN -33.7% over last year. (615 from 927 in 2014)
September 2016 Boston Real Estate Market Trends
- Closed home sales decreased for single-family homes but increased for condominiums in September 2016 compared to the previous year. Median home prices increased for both single-family homes and condominiums. Inventory levels decreased substantially for both housing types.
San Francisco Market Focus April 2017
Residential real estate activity in San Francisco saw decreases in new listings and pending sales in April 2017 compared to the previous year. The median sales price for single-family homes increased slightly by 1.6% to $1,402,500, while the median price for condos decreased by 4.3% to $1,100,000. Inventory levels also dropped, with months of supply decreasing by 30.8% for single-family homes and 25.8% for condos. Overall, the real estate market remains strong with high demand, though affordability issues persist for some buyers.
Similar to April 2011 final stats (20)
July 2013's Monthly Indicators report - Boston Real Estate Market Trends
July 2013's Monthly Indicators report - Boston Real Estate Market Trends
August 2015 Greater Boston Real Estate Market Trends Report
August 2015 Greater Boston Real Estate Market Trends Report
January 2014 Greater Boston Real Estate Market Trends Report
January 2014 Greater Boston Real Estate Market Trends Report
April 2013's Monthly Indicators report - Boston Real Estate Market Trends
April 2013's Monthly Indicators report - Boston Real Estate Market Trends
December 2016 Greater Boston Real Estate Market Trends
December 2016 Greater Boston Real Estate Market Trends
September 2015 Greater Boston Real Estate Market Trends Report
September 2015 Greater Boston Real Estate Market Trends Report
February 2015 Greater Boston Real Estate Market Trends Report
February 2015 Greater Boston Real Estate Market Trends Report
More from Doreen At Work
March 2012 youtube
The document contains market statistics charts showing housing prices, sales, inventory levels, and interest rates from 2004 to present. It summarizes that for 2012 year-to-date compared to 2011: average and median home prices are up slightly, home sales are up slightly, inventory and listings are down substantially, and foreclosures are also down while interest rates remain at historic lows.
Empire Title Nov 2011 Real Estate Stats
This document contains market statistics for the housing market from 2003 to 2011, including average and median home sale prices, number of home sales, active listings, months of inventory, and interest rates. It shows that while home prices and sales are up in 2011 compared to 2010, inventory levels remain high relative to sales.
Empire September 2011 Statistics [read only]
The document contains charts showing housing market trends in a certain location over several years. It tracks average and median home sale prices, number of monthly sales, active listings, and other metrics. Overall, it shows that after a peak in the mid-2000s, the housing market declined through 2009 but has since begun to recover.
August 2011 Empire Title Real Estate stats
This document contains charts and graphs summarizing housing market trends in a particular region over several years. It shows that while average home prices, median prices, and inventory levels have increased slightly in 2011 compared to 2010, the number of home sales and foreclosures are up. Mortgage interest rates are currently at historic lows.
July 2011 Real Estate stats
The document contains charts showing housing market trends from 2003-2011 including average and median home sales prices, number of sales, inventory levels, interest rates, and foreclosure rates. Overall, the housing market shows signs of recovery in 2011 compared to 2010, with price increases, more units sold, and similar inventory levels despite more listings, though foreclosures remain high.
Empire Title june 2011 real estate stats
The document contains charts and statistics about the housing market over time. It shows average and median home sale prices have increased 1.6-2.8% compared to last year. The number of homes sold has risen 6.2% while inventory levels and listings are up 2.6-9.0%. Foreclosures have increased 28%. Interest rates are at historic lows.
Springs Statistics for May 2011
The document shows two line graphs tracking average sales price and previous 12 month average sales price over time from March 2003 to March 2011. The average sales price fluctuates between $150,000 and $290,000 with an overall upward trend, while the 12 month average tracks the average sales price more smoothly over time.
February 2011 Real Estate Statistics
The document contains charts and graphs showing housing market trends from 2003-2011. It shows that over this period:
- Average and median home sales prices fluctuated but generally trended upward, with the average price rising 6.7% and median up 2.8% from 2010 to 2011 YTD.
- Home sales, inventory levels, and new listings all increased from 2010 to 2011 YTD, with units sold up 12.4% and inventory up 11.3%.
- Foreclosures as a percentage of total sales declined slightly from 2010 to 2011 YTD, down 5.7%.
More from Doreen At Work (8)
Recently uploaded
SVN Live 6.10.24 Weekly Property Broadcast
The SVN® organization shares a portion of their new weekly listings via their SVN Live® Weekly Property Broadcast. Visit https://svn.com/svn-live/ if you would like to attend our weekly call, which we open up to the brokerage community.
原版制作(Greenwich毕业证书)格林威治大学毕业证PDF成绩单一模一样
学校原件一模一样【微信:741003700 】《(Greenwich毕业证书)格林威治大学毕业证PDF成绩单》【微信:741003700 】学位证,留信认证(真实可查,永久存档)原件一模一样纸张工艺/offer、雅思、外壳等材料/诚信可靠,可直接看成品样本,帮您解决无法毕业带来的各种难题!外壳,原版制作,诚信可靠,可直接看成品样本。行业标杆!精益求精,诚心合作,真诚制作!多年品质 ,按需精细制作,24小时接单,全套进口原装设备。十五年致力于帮助留学生解决难题,包您满意。
本公司拥有海外各大学样板无数,能完美还原。
1:1完美还原海外各大学毕业材料上的工艺:水印,阴影底纹,钢印LOGO烫金烫银,LOGO烫金烫银复合重叠。文字图案浮雕、激光镭射、紫外荧光、温感、复印防伪等防伪工艺。材料咨询办理、认证咨询办理请加学历顾问Q/微741003700
【主营项目】
一.毕业证【q微741003700】成绩单、使馆认证、教育部认证、雅思托福成绩单、学生卡等!
二.真实使馆公证(即留学回国人员证明,不成功不收费)
三.真实教育部学历学位认证(教育部存档!教育部留服网站永久可查)
四.办理各国各大学文凭(一对一专业服务,可全程监控跟踪进度)
如果您处于以下几种情况:
◇在校期间,因各种原因未能顺利毕业……拿不到官方毕业证【q/微741003700】
◇面对父母的压力,希望尽快拿到;
◇不清楚认证流程以及材料该如何准备;
◇回国时间很长,忘记办理;
◇回国马上就要找工作,办给用人单位看;
◇企事业单位必须要求办理的
◇需要报考公务员、购买免税车、落转户口
◇申请留学生创业基金
留信网认证的作用:
1:该专业认证可证明留学生真实身份
2:同时对留学生所学专业登记给予评定
3:国家专业人才认证中心颁发入库证书
4:这个认证书并且可以归档倒地方
5:凡事获得留信网入网的信息将会逐步更新到个人身份内,将在公安局网内查询个人身份证信息后,同步读取人才网入库信息
6:个人职称评审加20分
7:个人信誉贷款加10分
8:在国家人才网主办的国家网络招聘大会中纳入资料,供国家高端企业选择人才
Hawthorn Module 1 Coverted to Slide Show - 04.06.2024.docx
half screen text in white and headings in orange and background in blue, the other half of the screen that relates to the text
AVRUPA KONUTLARI ESENTEPE - ENGLISH - Listing Turkey
Looking for a new home in Istanbul? Look no further than Avrupa Konutlari Esentepe! Our beautifully designed homes provide the perfect blend of luxury and comfort, making them the perfect choice for anyone looking for a high-quality home in the city.
With a wide range of apartment types available, from 1+1 to 4+1, we have something to suit every need and budget. Each apartment is designed with attention to detail and features spacious and bright living areas, making them the perfect place to relax and unwind after a long day.
One of the things that sets Avrupa Konutlari Esentepe apart from other developments is our focus on creating a community that is both comfortable and convenient. Our homes are surrounded by lush green spaces, perfect for enjoying a peaceful stroll or having a picnic with friends and family. Additionally, our complex includes a variety of social and recreational amenities, such as swimming pools, sports fields, and playgrounds, making it easy for residents to stay active and socialize with their neighbors.
https://listingturkey.com/property/avrupa-konutlari-esentepe/
Gurgaon Industrial Business Association.pdf
Presentation of Industrial Land for development of various business opportunities
Recent Trends Fueling The Surge in Farmhouse Demand in India
Embarking on the journey to acquire a farmhouse for sale is just the beginning; the real investment lies in crafting an environment that contributes to our mental and physical well-being while satisfying the soul. At Farmlandbazaar.com, India’s leading online marketplace dedicated to farm land, farmhouses, and agricultural lands, we understand the importance of transforming a humble farmland into a warm and inviting sanctuary. Let's explore the fundamental aspects that can elevate your farmhouse into a tranquil haven.
Sense Levent Kagithane Catalog - Listing Turkey
Sense Levent offers a luxurious living experience in the heart of Istanbul’s vibrant Levent district.
This cutting-edge development seamlessly integrates modern design with natural elements, featuring live evergreen plants maintained by an advanced irrigation system, ensuring lush greenery year-round.
The building’s elegant ceramic balconies are both stylish and durable, enhancing the overall aesthetic and functionality. Residents can enjoy the 700m Sky Lounge, which provides breathtaking views of Istanbul and a perfect space to relax and unwind.
Sense Levent promotes a healthy and active lifestyle with a full gym, swimming pool, sauna, and steam room, all available in the building. The interiors are crafted with high-quality materials, ensuring a luxurious and inviting living space.
Designed with young professionals in mind, Sense Levent features 1+1 and 2+1 units with smart floor plans and balconies. The project promises high investment returns, with an expected annual return of 6.5-7%, significantly above Istanbul’s average ROI.
Located in the rapidly growing and highly desirable Levent area, the development benefits from ongoing urban regeneration projects. Its prime location offers proximity to shopping malls, municipal buildings, universities, and public transportation, adding immense value to your investment.
Early investors can take advantage of discounted units during the construction phase, with an expected capital appreciation of +45% USD upon completion. Property Turkey provides comprehensive rental management services, ensuring a seamless and profitable investment experience.
Additionally, robust legal support and significant tax advantages are available through Property Turkey’s licensed Real Estate Investment Fund. Levent is a dynamic urban hub, ideal for young professionals with its numerous corporate headquarters and shopping malls.
Sense Levent is more than just a residence; it’s a place where dreams and opportunities come to life. Contact us today to secure your place in this exclusive development and experience the best of Istanbul living. Sense Levent: Sense the Opportunity. Live the Dream.
https://listingturkey.com/property/sense-levent/
Serviced Apartment Ho Chi Minh For Rental
GVRenting is the leading rental real estate company in Vietnam. We help you to find a serviced apartment for rent in Ho Chi Minh & Saigon. Discover our broad range of rental properties in Vietnam.
For more details https://gvrenting.com/
制作(ucr毕业证书)加州大学河滨分校毕业证学历学位证书原版一模一样
原版一模一样【微信:741003700 】【(ucr毕业证书)加州大学河滨分校毕业证学历学位证书】【微信:741003700 】学位证,留信认证(真实可查,永久存档)offer、雅思、外壳等材料/诚信可靠,可直接看成品样本,帮您解决无法毕业带来的各种难题!外壳,原版制作,诚信可靠,可直接看成品样本。行业标杆!精益求精,诚心合作,真诚制作!多年品质 ,按需精细制作,24小时接单,全套进口原装设备。十五年致力于帮助留学生解决难题,包您满意。
本公司拥有海外各大学样板无数,能完美还原海外各大学 Bachelor Diploma degree, Master Degree Diploma
1:1完美还原海外各大学毕业材料上的工艺:水印,阴影底纹,钢印LOGO烫金烫银,LOGO烫金烫银复合重叠。文字图案浮雕、激光镭射、紫外荧光、温感、复印防伪等防伪工艺。材料咨询办理、认证咨询办理请加学历顾问Q/微741003700
留信网认证的作用:
1:该专业认证可证明留学生真实身份
2:同时对留学生所学专业登记给予评定
3:国家专业人才认证中心颁发入库证书
4:这个认证书并且可以归档倒地方
5:凡事获得留信网入网的信息将会逐步更新到个人身份内,将在公安局网内查询个人身份证信息后,同步读取人才网入库信息
6:个人职称评审加20分
7:个人信誉贷款加10分
8:在国家人才网主办的国家网络招聘大会中纳入资料,供国家高端企业选择人才
Listing Turkey - Yeni Eyupevleri Istanbul
Discover Yeni Eyup Evleri 2, nestled among the rising values of Eyupsultan, offering the epitome of modern living in Istanbul.
With its spacious living areas, contemporary architecture, and meticulous details, Yeni Eyup Evleri 2 is poised to be the star of your happiest moments. Situated in the new favorite district of Eyupsultan, claim your spot and unlock the doors to a peaceful life alongside your loved ones. Nestled next to the historical and natural beauties of Eyupsultan, embrace the comfort of modern living and rediscover life.
Social Amenities:
Yeni Eyup 2 offers a life filled with joy with its green landscaping areas, gym, sauna, children’s play areas, café, outdoor pool, and basketball court. Reserve your place for unforgettable moments!
Reliable Structure:
With 1+1, 2+1, and 3+1 apartment options, Yeni Eyup Evleri 2 is designed with first-class materials and craftsmanship. The doors to a safe and comfortable life are here! Choose the option that suits you best and step into your dream home.
Project:
Yeni Eyup 2 is conveniently located, with Istanbul Airport just 26 minutes away, the Mecidiyeköy Metro Line 4 minutes away, and the Tram Stop 5 minutes away, making your life easier with its central location.
Location:
Your home is positioned in a privileged location, providing easy access to the city center, shopping malls, restaurants, schools, and other important places.
Yeni Eyup 2 offers 1+1, 2+1, and 3+1 apartment options designed to meet different needs. Find an option suitable for every lifestyle and open the doors to a comfortable life in your dream home.
https://listingturkey.com/property/yeni-eyup-evleri-2/
Best Construction Company in Haldwani UK
At Geomatrix, we Pride Ourselves on our Commitment to Superior Craftsmanship and client satisfaction. Our team Consists of Highly Qualified specialists including Architects, Engineers, project Managers, and skilled labourers who work seamlessly together to achieve ourclients' Objectives. Geomatrix is recognized as the Best Construction Company in Haldwani, Dedicated to bringing visions to life with unparalleled Expertise and Professionalism.
For more information visit:
https://geomatrix.co.in/
Things to Consider When Selling Your House - Summer 2024 Edition
If you're thinking about selling your home this summer, make sure you take some time to read this guide so that you understand the market.
Victory by Maskeen Group Surrey Floor plans June 2024 PDF
Victory by Maskeen Group Surrey Floor plans June 2024 PDF.
The KA Housing - Catalogue - Listing Turkey
Welcome to KA Housing, a distinguished real estate development nestled in the heart of Eyüpsultan, one of Istanbul’s most promising districts.
Just 10 minutes from the bustling city center, Eyüpsultan offers a serene escape with the convenience of urban living. The direct metro line ensures seamless connectivity to all parts of Istanbul, making it an ideal location for residents who seek both tranquility and vibrancy.
KA Housing boasts unparalleled accessibility, with proximity to Istanbul Airport only 30 minutes away, facilitating easy international travel. Effortless city access is guaranteed by direct metro and transportation links to Istanbul’s cultural and commercial hubs. Quick access to key metro lines connects you to every corner of the city within minutes, making commuting and exploring the city hassle-free.
The development offers luxurious living spaces with a range of unit layouts from 1+1 to 4+1, designed with meticulous attention to detail. Each unit features balconies or terraces, providing stunning vistas of Istanbul and enhancing the living experience. High-quality materials and superior craftsmanship ensure durability and elegance, while sound-proof insulation and high ceilings (2.95 m) offer comfort and sophistication.
Residents of KA Housing enjoy exclusive on-site amenities, including a state-of-the-art gym, outdoor swimming pool, yoga area, and walking paths. Entertainment options abound with a private cinema, children’s playground, and a variety of dining options including a café and restaurant. Security and convenience are paramount with 24/7 security, a dedicated carpark garage, and an IP intercom system.
KA Housing represents a prime investment opportunity with limited availability in a high-demand area, ensuring enduring value and potential for lucrative returns. Homes in this development provide exceptional value without compromising on quality, offering affordable luxury for discerning buyers. The construction is of the highest quality, built to the latest seismic and disaster resistance standards, ensuring safety and resilience.
The community and surroundings of KA Housing are enriched by close proximity to prestigious universities such as Haliç University, Bilgi University, and Istanbul Ticaret University, making it an ideal location for students and academics. The development is adjacent to the Alibeyköy stream leading into the Halic waters, offering serene natural escapes amidst lush greenery. Residents can enjoy the cultural richness of the area, surrounded by historical and cultural landmarks that blend leisure, nature, and culture seamlessly.
https://listingturkey.com/property/the-ka-housing/
House Construction Cost in Haldwani
If you're Planning to Build a House in Haldwani, Understanding the House Construction Cost in Haldwani is crucial. It's important to grasp the direct and indirect cost factors entailed in the Construction process before Initiating any work. This Understanding is pivotal for Efficient Budget allocation, allowing you to plan your finances more Effectively. Construction expenses can vary Significantly, Influenced by Diverse Elements such as site Location, raw material prices, Labour charges, and various other variables. Here at Geomatrix, we pride Ourselves on offering competitive rates for house construction in Haldwani, ensuring affordability without Compromising on quality and providing the best options within your budget. For a precise evaluation of the cost involved in constructing your dream home, consult our team of architects and construction experts.
For more information visit:
https://geomatrix.co.in/services/real-estate-project-management-in-haldwani/
Recently uploaded (20)
Addis Bleaching Mixed use Apartment- Documentation 6.pdf
Addis Bleaching Mixed use Apartment- Documentation 6.pdf
Hawthorn Module 1 Coverted to Slide Show - 04.06.2024.docx
Hawthorn Module 1 Coverted to Slide Show - 04.06.2024.docx
AVRUPA KONUTLARI ESENTEPE - ENGLISH - Listing Turkey
AVRUPA KONUTLARI ESENTEPE - ENGLISH - Listing Turkey
Recent Trends Fueling The Surge in Farmhouse Demand in India
Recent Trends Fueling The Surge in Farmhouse Demand in India
HollandRow_17x11_Insert_Floorplan_Feature sheet.pdf
HollandRow_17x11_Insert_Floorplan_Feature sheet.pdf
Things to Consider When Selling Your House - Summer 2024 Edition
Things to Consider When Selling Your House - Summer 2024 Edition
G+10 apartment 1- Sustainable apartment building.pdf
G+10 apartment 1- Sustainable apartment building.pdf
Victory by Maskeen Group Surrey Floor plans June 2024 PDF
Victory by Maskeen Group Surrey Floor plans June 2024 PDF
April 2011 final stats
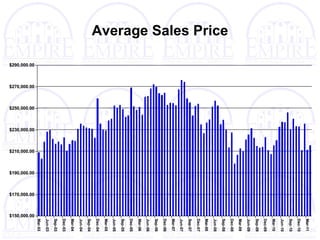
- 2. Sales Price Previous 12 Month Average
- 4. Sales Price Previous 12 Month Median
- 5. Number of Sales Per Month
- 6. Number of Sales Previous 12 Month Average
- 7. Number of Sales Per Month With Active Listings
- 8. Number of Sales With Sales Price Previous 12 Month Average
- 9. Number of Sales With Active Listings Previous 12 Month Average
- 10. Active Listings
- 11. Active Listings Previous 12 Months Average
- 12. Sales as a % of Active Listings
- 13. Sales as a % of Active Listing Previous 12 Month Average
- 14. Inventory in Number of Months
- 15. Update Foreclosures as a Percent of Sales
- 16. Freddie Mac 30 Fixed Rate Mortgage Jan - 1971 Apr – 2011
- 17. Percent of Sales by Price April 2011
- 18. Percent of Sales by Price Year to Date 2011
- 19. Percent of Sales by Price April 2011
- 20. Percent of Sales by Price Year to Date 2011
- 21. Percent of Sales from $140,000 - $399,999 April 2011
- 22. Percent of Sales from $140,000 - $399,999 Year to Date 2011
- 23. Percent of Sales by Price April 2011
- 24. Percent of Sales by Price Year to Date 2011
- 25. 2010 – 2011 1 st Quarter Comparison 2010 2011 % Change Jan Feb Mar Jan Feb Mar Jan Feb Mar Number of Sales 464 572 723 460 448 776 -0.9% -21.7% 7.3% Months of Inventory 5.62 5.9 6.35 6.37 6.45 6.64 13.3% 9.3% 4.6% Average Sales Price $211,008 $207,430 $215,625 $210,879 $235,684 $211,426 -0.1% 13.6% -1.9% Median Sales Price $178,290 $182,000 $189,900 $180,000 $190,457 $180,000 1.0% 4.6% -5.2%
- 26. 2010 – 2011 2nd Quarter Comparison 2010 2011 % Change Apr May Jun Apr May Jun Apr May Jun Number of Sales 792 0 0 748 0 0 -5.6% 0.0% 0.0% Months of Inventory 6.78 0.0 0.0 6.83 0.0 0.0 0.7% 0.0% 0.0% Average Sales Price $220,105 $0 $0 $215,466 $0 $0 -2.1% 0.0% 0.0% Median Sales Price $187,500 $0 $0 $184,950 $0 $0.0 -1.4% 0.0% 0.0%
- 27. 2010 – 2011 1 st Quarter Comparison 2010 2011 % Change Jan Feb Mar Jan Feb Mar Jan Feb Mar Foreclosures 365 376 470 411 288 272 12.6% -23.4% -42.1%
- 28. Update 2010 – 2011 2nd Quarter Comparison 2010 2011 % Change Apr May Jun Apr May Jun Apr May Jun Foreclosures 477 - - 276 - - -42.1% 0.0% 0.0%
- 29. Update Average Number of Foreclosures Per Month
- 31. April 2011 Sales Per Price Range
- 32. Update YTD 2011 Sales Per Price Range
- 34. Months of Inventory March 2010