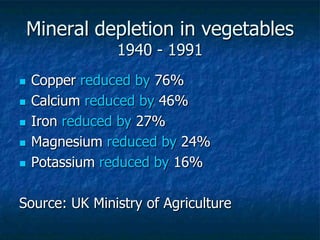
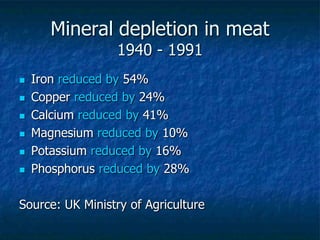
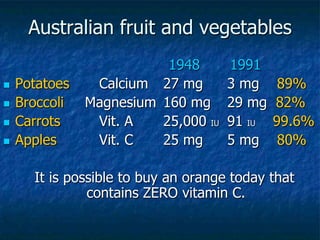
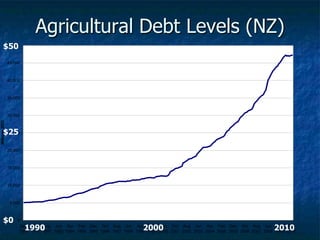
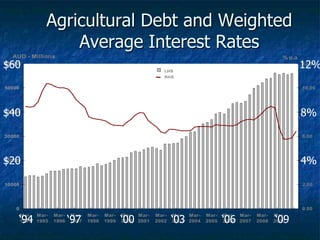
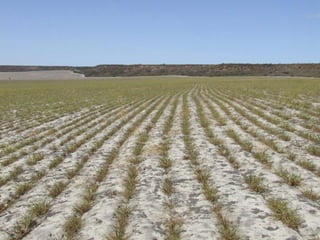
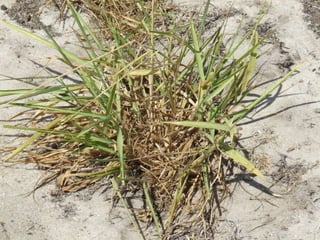
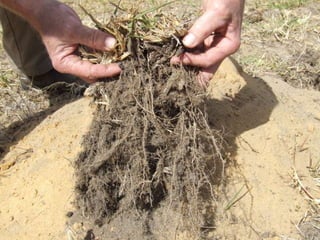
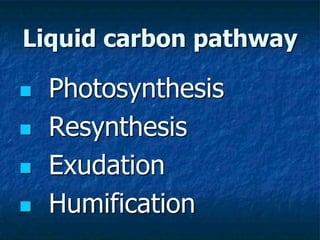
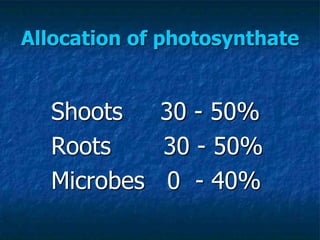
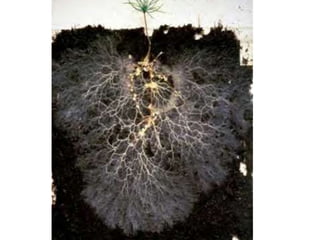
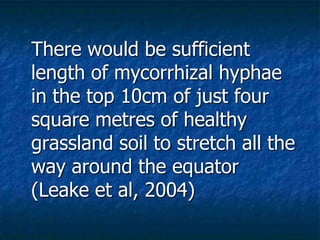
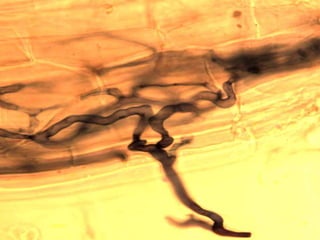
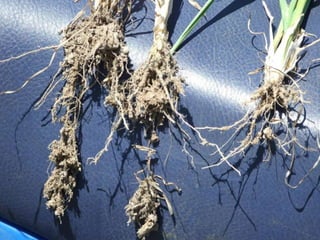
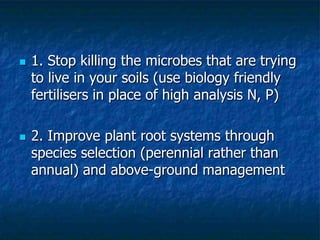
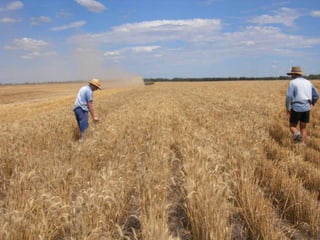
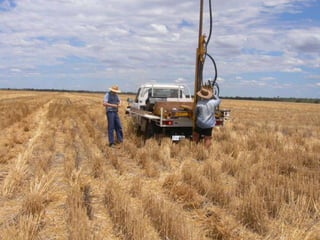
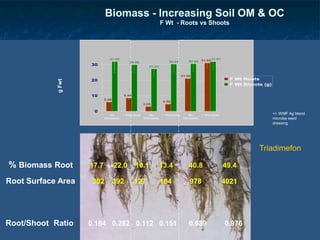
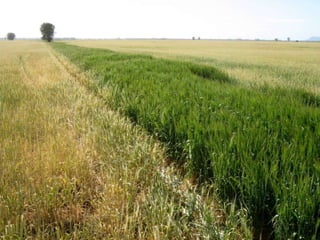
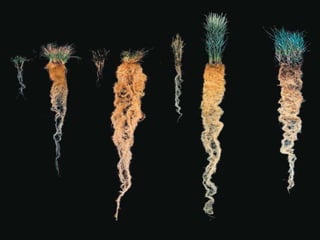
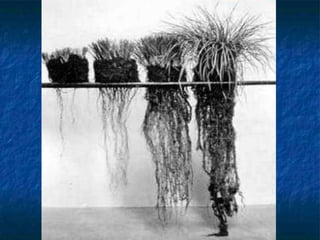
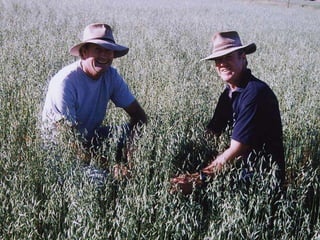
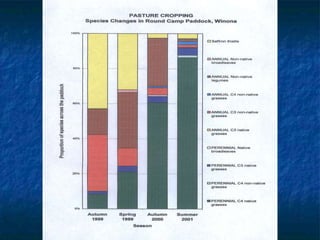
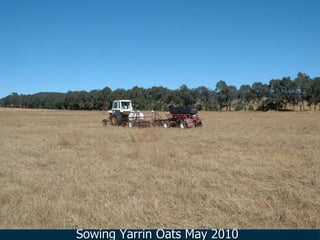
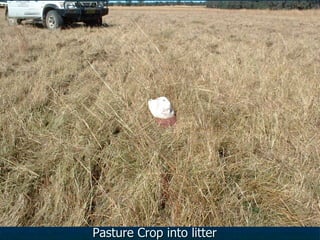
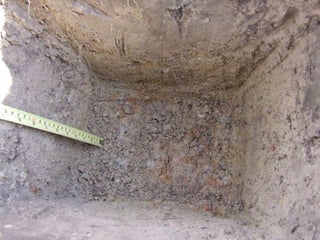
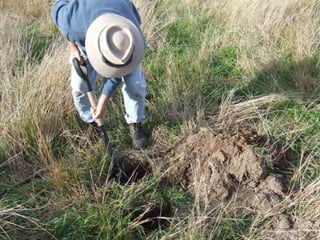
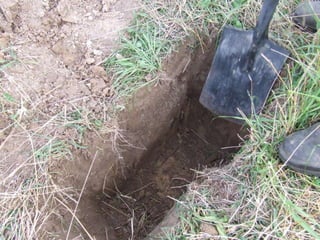
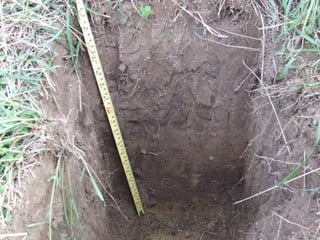
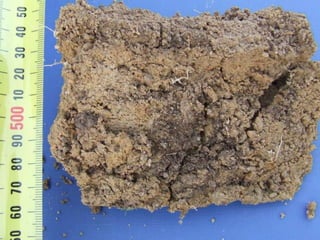
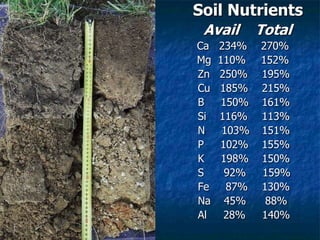
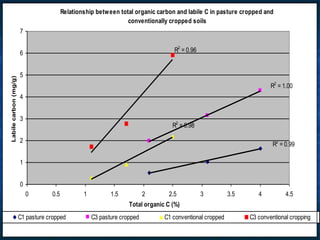
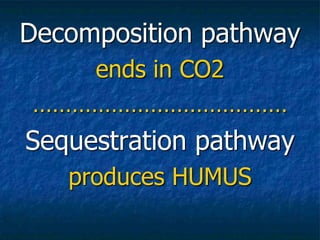
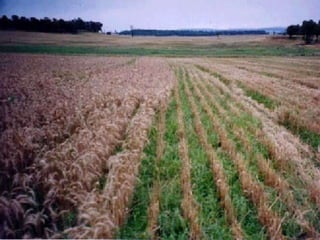
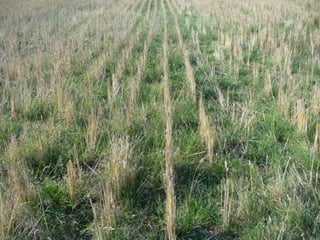
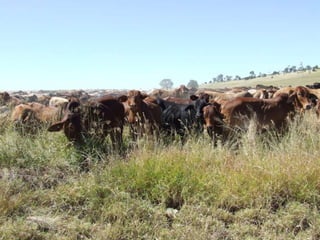
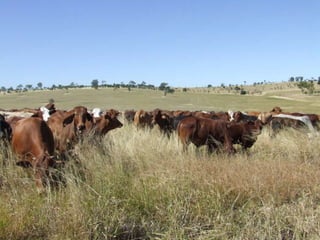
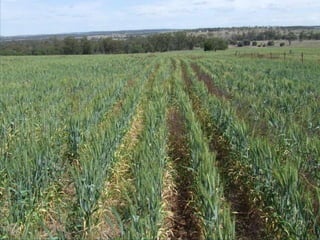
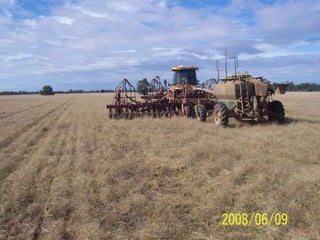
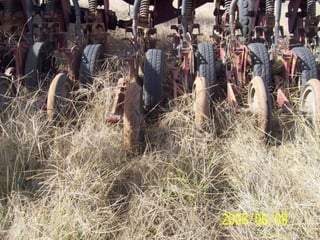
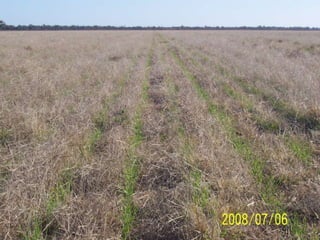
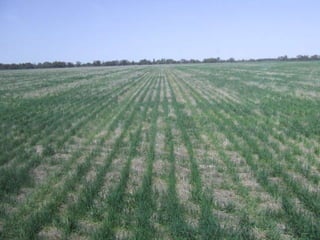
Soil building through
microbial processes
Dr Christine Jones
Sir Paul Edmund Strzelecki
Soil samples collected 1839 -1843
41 samples
 10 highest ranking soils had OM levels
from 11% to 37.75% (average 20%)
 10 lowest ranking soils had OM levels
from 2.2% to 5.0% (average 3.72%)
The organic carbon content
of most Australian topsoils is
now 50-80% less than the
original level – mostly as a
result of the loss of the soil
itself
Agriculture is about
FOOD
But there is something
fundamentally wrong
Mineral depletion in vegetables
1940 - 1991
 Copper reduced by 76%
 Calcium reduced by 46%
 Iron reduced by 27%
 Magnesium reduced by 24%
 Potassium reduced by 16%
Source: UK Ministry of Agriculture
Mineral depletion in meat
1940 - 1991
 Iron reduced by 54%
 Copper reduced by 24%
 Calcium reduced by 41%
 Magnesium reduced by 10%
 Potassium reduced by 16%
 Phosphorus reduced by 28%
Source: UK Ministry of Agriculture
Australian fruit and vegetables
1948 1991
 Potatoes Calcium 27 mg 3 mg 89%
 Broccoli Magnesium 160 mg 29 mg 82%
 Carrots Vit. A 25,000 IU 91 IU 99.6%
 Apples Vit. C 25 mg 5 mg 80%
It is possible to buy an orange today that
contains ZERO vitamin C.
It’s not only the quality of
the product that has
gone downhill
Farmers are no longer
making a profit either
Agricultural Debt Levels (AUS)
0
10000
20000
30000
40000
50000
60000
Mar-
94
Mar-
95
Mar-
96
Mar-
97
Mar-
98
Mar-
99
Mar-
00
Mar-
01
Mar-
02
Mar-
03
Mar-
04
Mar-
05
Mar-
06
Mar-
07
Mar-
08
Mar-
09
Source: RBA, Westpac Economics
AUD $M
$20
$40
$60
‘94 ‘97 ‘00 ‘03 ‘06 ‘09
Agricultural Debt Levels (NZ)
0
5,000
10,000
15,000
20,000
25,000
30,000
35,000
40,000
45,000
50,000
Dec
1990
Oct
1991
Aug
1992
Jun
1993
Apr
1994
Feb
1995
Dec
1995
Oct
1996
Aug
1997
Jun
1998
Apr
1999
Feb
2000
Dec
2000
Oct
2001
Aug
2002
Jun
2003
Apr
2004
Feb
2005
Dec
2005
Oct
2006
Aug
2007
Jun
2008
Apr
2009
Feb
2010
Millions
NZD
50
$50
$25
$0
1990 2000 2010
Agricultural Debt and Weighted
Average Interest Rates
0
10000
20000
30000
40000
50000
60000
Mar-
1994
Mar-
1995
Mar-
1996
Mar-
1997
Mar-
1998
Mar-
1999
Mar-
2000
Mar-
2001
Mar-
2002
Mar-
2003
Mar-
2004
Mar-
2005
Mar-
2006
Mar-
2007
Mar-
2008
Mar-
2009
0.00
2.00
4.00
6.00
8.00
10.00
12.00
LHS
RHS
AUD - Millions % p.a
‘94 ‘97 ‘00 ‘03 ‘06 ‘09
$20
$40
$60
4%
8%
12%
SOIL CARBON is the key driver for the
nutritional status of plants – and therefore
the mineral density in animals and people
SOIL CARBON is the key driver for soil
moisture holding capacity (frequently the
most limiting factor for production)
Soil carbon is the key driver for farm profit
How does
carbon get
into soil???
Liquid carbon pathway
 Photosynthesis
 Resynthesis
 Exudation
 Humification
Allocation of photosynthate
Shoots 30 - 50%
Roots 30 - 50%
Microbes 0 - 40%
There would be sufficient
length of mycorrhizal hyphae
in the top 10cm of just four
square metres of healthy
grassland soil to stretch all the
way around the equator
(Leake et al, 2004)
Soil nutrient levels (0-30cm) from between and within
Gatton Panic crowns, Binnu, WA, May 2009
________________________________________________________
Between Within Change
Organic carbon (%) 0.24 1.04 433%
Phosphorus (Colwell ppm) 21 71 338%
Potassium (Colwell ppm) 44 150 341%
Sulphur (ppm) 2.7 7.9 293%
pH (CaCl) 5.8 7.1 1.3 units
_______________________________________________
Source: Tim Wiley, WA Department of Agriculture and Food
(increased soil C = sequestration of 123tCO2/ha)
 It has been widely promoted by CSIRO
Division on Plant Industries that to
increase levels of soil carbon requires the
application of nutrients to soil and
increased fertiliser costs
 This is contrary to what is observed in
practice
The carbon and nutrients MYTH
 Increased C  normalized pH, increased CEC
 Increased C  increased availability of P, Ca,
K, S
 Increased C  increased availability of Cu,
Zn, Fe, Mo, B
 Increased C  reduced availability of Na, Al
The carbon and nutrients TRUTH
Microbes vs fertilisers
Very few nutrient deficiencies are absolute
– most are functional (due to poor soil
structure and/or lack of microbial
diversity)
Agrochemicals and synthetic fertilisers
significantly alter microbial populations
and the functional dynamics of soil
How do we
get more
microbes??
 1. Stop killing the microbes that are trying
to live in your soils (use biology friendly
fertilisers in place of high analysis N, P)
 2. Improve plant root systems through
species selection (perennial rather than
annual) and above-ground management
MAP MAP + Triad Mineral Fert
Root/Shoot Ratio 0.184 0.282 0.112 0.151 0.689 0.976
Biomass - Increasing Soil OM & OC
F Wt - Roots vs Shoots
g
Fwt 31.95
29.88
27.23
30.24 30.53 31.05
21.02
4.58
3.05
8.44
5.88
31.81
0
10
20
30
No
Microbes
+ Microbes No
Microbes
+ Microbes No
Microbes
+ Microbes
F Wt Roots
F Wt Shoots (g)
% Biomass Root 17.7 22.0 10.1 13.4 40.8 49.4
Root Surface Area 302 392 127 184 978 4021
Triadimefon
+/- WMF Ag blend
microbe seed
dressing
Soil has always been
Australia’s biggest export
Even today, soil loss is greater
than agricultural production
 For example, average wheat yield 1.2 t/ha
 Average soil loss on wheat farms 15 t/ha
How can we turn that
around and rebuild
healthy, porous,
carbon-rich topsoil?
February 2010
Sowing Yarrin Oats May 2010
Pasture Crop into litter
Emerging Crop
10th September 2010
10th October 2010
February 2010
10th September 2010
The difference in land
management techniques
Adjoining paddocks March 2010
Planned grazed and
Pasture Cropped
Continuously grazed
and fertilised annually
Soil CARBON
Winona 90.1tC/ha
Neighbour 43.4tC/ha
Difference of 46.7 tC/ha
= 171 t CO2/ha
sequestered
Soil CARBON
Since 2008, the
sequestration
rate has been
37 tCO2/ha/yr
Soil CARBON
0 – 4” 150%
4 – 8” 243%
8 – 12” 317%
12 – 16” 413%
16 – 20” 157%
Soil Nutrients
Avail Total
Ca 234% 270%
Mg 110% 152%
Zn 250% 195%
Cu 185% 215%
B 150% 161%
Si 116% 113%
N 103% 151%
P 102% 155%
K 198% 150%
S 92% 159%
Fe 87% 130%
Na 45% 88%
Al 28% 140%
Soil Integrity Index
Accreditation system for soils based on
 Microbial diversity
 Soil water holding capacity
 Soil carbon content
Simple code on food labels, eg star system
(one, two or three stars)
Food quality labelling
The urban population could have a
major impact on soil health through
food choices, if guided by labelling
based on the ecological integrity of
the production system
What kind of
carbon????
Relationship between total organic carbon and labile C in pasture cropped and
conventionally cropped soils
R2
= 0.99
R2
= 1.00
R2
= 0.98
R2
= 0.96
0
1
2
3
4
5
6
7
0 0.5 1 1.5 2 2.5 3 3.5 4 4.5
Total organic C (%)
Labile
carbon
(mg/g)
C1 pasture cropped C3 pasture cropped C1 conventional cropped C3 conventional cropping
Decomposition pathway
ends in CO2
…………………………………
Sequestration pathway
produces HUMUS
CSIRO report p.42
"A potentially troubling, but
also somewhat intriguing,
issue is that there is no readily
apparent explanation for some
of the very large SOC gains
being anecdotally reported."
 From Dlugokencky et al (2009). Yearly
variations in methane from 1983 to 2009.
Measurements in parts per billion.

Keynote ~ Soil building through microbial pathways ~ mechanisms for soil carbon sequestration ~ Christine Jones,rvd

  • 1.
    Soil building through microbialprocesses Dr Christine Jones
  • 4.
    Sir Paul EdmundStrzelecki Soil samples collected 1839 -1843 41 samples  10 highest ranking soils had OM levels from 11% to 37.75% (average 20%)  10 lowest ranking soils had OM levels from 2.2% to 5.0% (average 3.72%)
  • 5.
    The organic carboncontent of most Australian topsoils is now 50-80% less than the original level – mostly as a result of the loss of the soil itself
  • 16.
    Agriculture is about FOOD Butthere is something fundamentally wrong
  • 17.
    Mineral depletion invegetables 1940 - 1991  Copper reduced by 76%  Calcium reduced by 46%  Iron reduced by 27%  Magnesium reduced by 24%  Potassium reduced by 16% Source: UK Ministry of Agriculture
  • 18.
    Mineral depletion inmeat 1940 - 1991  Iron reduced by 54%  Copper reduced by 24%  Calcium reduced by 41%  Magnesium reduced by 10%  Potassium reduced by 16%  Phosphorus reduced by 28% Source: UK Ministry of Agriculture
  • 19.
    Australian fruit andvegetables 1948 1991  Potatoes Calcium 27 mg 3 mg 89%  Broccoli Magnesium 160 mg 29 mg 82%  Carrots Vit. A 25,000 IU 91 IU 99.6%  Apples Vit. C 25 mg 5 mg 80% It is possible to buy an orange today that contains ZERO vitamin C.
  • 20.
    It’s not onlythe quality of the product that has gone downhill Farmers are no longer making a profit either
  • 21.
    Agricultural Debt Levels(AUS) 0 10000 20000 30000 40000 50000 60000 Mar- 94 Mar- 95 Mar- 96 Mar- 97 Mar- 98 Mar- 99 Mar- 00 Mar- 01 Mar- 02 Mar- 03 Mar- 04 Mar- 05 Mar- 06 Mar- 07 Mar- 08 Mar- 09 Source: RBA, Westpac Economics AUD $M $20 $40 $60 ‘94 ‘97 ‘00 ‘03 ‘06 ‘09
  • 22.
    Agricultural Debt Levels(NZ) 0 5,000 10,000 15,000 20,000 25,000 30,000 35,000 40,000 45,000 50,000 Dec 1990 Oct 1991 Aug 1992 Jun 1993 Apr 1994 Feb 1995 Dec 1995 Oct 1996 Aug 1997 Jun 1998 Apr 1999 Feb 2000 Dec 2000 Oct 2001 Aug 2002 Jun 2003 Apr 2004 Feb 2005 Dec 2005 Oct 2006 Aug 2007 Jun 2008 Apr 2009 Feb 2010 Millions NZD 50 $50 $25 $0 1990 2000 2010
  • 23.
    Agricultural Debt andWeighted Average Interest Rates 0 10000 20000 30000 40000 50000 60000 Mar- 1994 Mar- 1995 Mar- 1996 Mar- 1997 Mar- 1998 Mar- 1999 Mar- 2000 Mar- 2001 Mar- 2002 Mar- 2003 Mar- 2004 Mar- 2005 Mar- 2006 Mar- 2007 Mar- 2008 Mar- 2009 0.00 2.00 4.00 6.00 8.00 10.00 12.00 LHS RHS AUD - Millions % p.a ‘94 ‘97 ‘00 ‘03 ‘06 ‘09 $20 $40 $60 4% 8% 12%
  • 24.
    SOIL CARBON isthe key driver for the nutritional status of plants – and therefore the mineral density in animals and people SOIL CARBON is the key driver for soil moisture holding capacity (frequently the most limiting factor for production) Soil carbon is the key driver for farm profit
  • 25.
  • 32.
    Liquid carbon pathway Photosynthesis  Resynthesis  Exudation  Humification
  • 33.
    Allocation of photosynthate Shoots30 - 50% Roots 30 - 50% Microbes 0 - 40%
  • 35.
    There would besufficient length of mycorrhizal hyphae in the top 10cm of just four square metres of healthy grassland soil to stretch all the way around the equator (Leake et al, 2004)
  • 38.
    Soil nutrient levels(0-30cm) from between and within Gatton Panic crowns, Binnu, WA, May 2009 ________________________________________________________ Between Within Change Organic carbon (%) 0.24 1.04 433% Phosphorus (Colwell ppm) 21 71 338% Potassium (Colwell ppm) 44 150 341% Sulphur (ppm) 2.7 7.9 293% pH (CaCl) 5.8 7.1 1.3 units _______________________________________________ Source: Tim Wiley, WA Department of Agriculture and Food (increased soil C = sequestration of 123tCO2/ha)
  • 39.
     It hasbeen widely promoted by CSIRO Division on Plant Industries that to increase levels of soil carbon requires the application of nutrients to soil and increased fertiliser costs  This is contrary to what is observed in practice The carbon and nutrients MYTH
  • 40.
     Increased C normalized pH, increased CEC  Increased C  increased availability of P, Ca, K, S  Increased C  increased availability of Cu, Zn, Fe, Mo, B  Increased C  reduced availability of Na, Al The carbon and nutrients TRUTH
  • 41.
    Microbes vs fertilisers Veryfew nutrient deficiencies are absolute – most are functional (due to poor soil structure and/or lack of microbial diversity) Agrochemicals and synthetic fertilisers significantly alter microbial populations and the functional dynamics of soil
  • 43.
    How do we getmore microbes??
  • 44.
     1. Stopkilling the microbes that are trying to live in your soils (use biology friendly fertilisers in place of high analysis N, P)  2. Improve plant root systems through species selection (perennial rather than annual) and above-ground management
  • 47.
    MAP MAP +Triad Mineral Fert Root/Shoot Ratio 0.184 0.282 0.112 0.151 0.689 0.976 Biomass - Increasing Soil OM & OC F Wt - Roots vs Shoots g Fwt 31.95 29.88 27.23 30.24 30.53 31.05 21.02 4.58 3.05 8.44 5.88 31.81 0 10 20 30 No Microbes + Microbes No Microbes + Microbes No Microbes + Microbes F Wt Roots F Wt Shoots (g) % Biomass Root 17.7 22.0 10.1 13.4 40.8 49.4 Root Surface Area 302 392 127 184 978 4021 Triadimefon +/- WMF Ag blend microbe seed dressing
  • 52.
    Soil has alwaysbeen Australia’s biggest export Even today, soil loss is greater than agricultural production  For example, average wheat yield 1.2 t/ha  Average soil loss on wheat farms 15 t/ha
  • 53.
    How can weturn that around and rebuild healthy, porous, carbon-rich topsoil?
  • 63.
  • 65.
  • 66.
  • 67.
  • 68.
  • 69.
  • 70.
  • 71.
  • 75.
    The difference inland management techniques Adjoining paddocks March 2010 Planned grazed and Pasture Cropped Continuously grazed and fertilised annually
  • 83.
    Soil CARBON Winona 90.1tC/ha Neighbour43.4tC/ha Difference of 46.7 tC/ha = 171 t CO2/ha sequestered
  • 85.
    Soil CARBON Since 2008,the sequestration rate has been 37 tCO2/ha/yr
  • 87.
    Soil CARBON 0 –4” 150% 4 – 8” 243% 8 – 12” 317% 12 – 16” 413% 16 – 20” 157%
  • 90.
    Soil Nutrients Avail Total Ca234% 270% Mg 110% 152% Zn 250% 195% Cu 185% 215% B 150% 161% Si 116% 113% N 103% 151% P 102% 155% K 198% 150% S 92% 159% Fe 87% 130% Na 45% 88% Al 28% 140%
  • 91.
    Soil Integrity Index Accreditationsystem for soils based on  Microbial diversity  Soil water holding capacity  Soil carbon content Simple code on food labels, eg star system (one, two or three stars)
  • 92.
    Food quality labelling Theurban population could have a major impact on soil health through food choices, if guided by labelling based on the ecological integrity of the production system
  • 93.
  • 94.
    Relationship between totalorganic carbon and labile C in pasture cropped and conventionally cropped soils R2 = 0.99 R2 = 1.00 R2 = 0.98 R2 = 0.96 0 1 2 3 4 5 6 7 0 0.5 1 1.5 2 2.5 3 3.5 4 4.5 Total organic C (%) Labile carbon (mg/g) C1 pasture cropped C3 pasture cropped C1 conventional cropped C3 conventional cropping
  • 98.
    Decomposition pathway ends inCO2 ………………………………… Sequestration pathway produces HUMUS
  • 100.
    CSIRO report p.42 "Apotentially troubling, but also somewhat intriguing, issue is that there is no readily apparent explanation for some of the very large SOC gains being anecdotally reported."
  • 127.
     From Dlugokenckyet al (2009). Yearly variations in methane from 1983 to 2009. Measurements in parts per billion.