Call Girls Service Nagpur Maya Call 7001035870 Meet With Nagpur Escorts
Weekly market report
1. `
Page 1 of 6
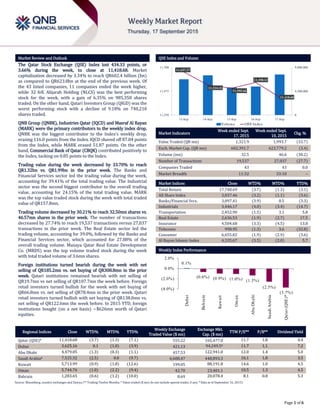
Market Review and Outlook QSE Index and Volume
The Qatar Stock Exchange (QSE) Index lost 434.33 points, or
3.66% during the week, to close at 11,418.68. Market
capitalization decreased by 3.34% to reach QR602.4 billion (bn)
as compared to QR623.8bn at the end of the previous week. Of
the 43 listed companies, 11 companies ended the week higher,
while 32 fell. Alijarah Holding (NLCS) was the best performing
stock for the week, with a gain of 6.35% on 985,358 shares
traded. On the other hand, Qatari Investors Group (QIGD) was the
worst performing stock with a decline of 9.18% on 740,210
shares traded.
QNB Group (QNBK), Industries Qatar (IQCD) and Masraf Al Rayan
(MARK) were the primary contributors to the weekly index drop.
QNBK was the biggest contributor to the Index’s weekly drop,
erasing 116.0 points from the Index. IQCD shaved off 87.84 points
from the Index, while MARK erased 51.87 points. On the other
hand, Commercial Bank of Qatar (CBQK) contributed positively to
the Index, tacking on 0.85 points to the Index.
Trading value during the week decreased by 33.70% to reach
QR1.32bn vs. QR1.99bn in the prior week. The Banks and
Financial Services sector led the trading value during the week,
accounting for 39.41% of the total trading value. The Industrial
sector was the second biggest contributor to the overall trading
value, accounting for 24.15% of the total trading value. MARK
was the top value traded stock during the week with total traded
value of QR157.8mn.
Trading volume decreased by 30.21% to reach 32.50mn shares vs.
46.57mn shares in the prior week. The number of transactions
decreased by 27.74% to reach 19,537 transactions versus 27,037
transactions in the prior week. The Real Estate sector led the
trading volume, accounting for 39.0%, followed by the Banks and
Financial Services sector, which accounted for 27.88% of the
overall trading volume. Mazaya Qatar Real Estate Development
Co. (MRDS) was the top volume traded stock during the week
with total traded volume of 3.6mn shares.
Foreign institutions turned bearish during the week with net
selling of QR185.2mn vs. net buying of QR308.8mn in the prior
week. Qatari institutions remained bearish with net selling of
QR19.7mn vs net selling of QR107.7mn the week before. Foreign
retail investors turned bullish for the week with net buying of
QR66.8mn vs. net selling of QR78.4mn in the prior week. Qatari
retail investors turned bullish with net buying of QR138.0mn vs.
net selling of QR122.6mn the week before. In 2015 YTD, foreign
institutions bought (on a net basis) ~$626mn worth of Qatari
equities.
Market Indicators
Week ended Sept.
17, 2015
Week ended Sept.
10, 2015
Chg. %
Value Traded (QR mn) 1,321.9 1,993.7 (33.7)
Exch. Market Cap. (QR mn) 602,391.7 623,779.2 (3.4)
Volume (mn) 32.5 46.6 (30.2)
Number of Transactions 19,537 27,037 (27.7)
Companies Traded 43 43 0.0
Market Breadth 11:32 33:10 –
Market Indices Close WTD% MTD% YTD%
Total Return 17,748.69 (3.7) (1.3) (3.1)
All Share Index 3,037.46 (3.2) (1.1) (3.6)
Banks/Financial Svcs. 3,097.41 (3.9) 0.5 (3.3)
Industrials 3,446.17 (4.0) (3.4) (14.7)
Transportation 2,452.90 (1.5) 3.1 5.8
Real Estate 2,636.53 (1.9) (2.7) 17.5
Insurance 4,504.68 (3.3) (4.5) 13.8
Telecoms 998.95 (1.3) 3.6 (32.8)
Consumer 6,655.82 (1.9) (2.9) (3.6)
Al Rayan Islamic Index 4,335.67 (3.5) (2.0) 5.7
Market Indices
Weekly Index Performance
Regional Indices Close WTD% MTD% YTD%
Weekly Exchange
Traded Value ($ mn)
Exchange Mkt.
Cap. ($ mn)
TTM P/E** P/B** Dividend Yield
Qatar (QSE)* 11,418.68 (3.7) (1.3) (7.1) 555.22 165,477.0 11.7 1.8 4.4
Dubai 3,625.16 0.1 (1.0) (3.9) 421.13 94,249.5# 11.7 1.1 7.2
Abu Dhabi 4,479.05 (1.3) (0.3) (1.1) 457.53 122,941.0 12.0 1.4 5.0
Saudi Arabia# 7,525.32 (2.5) 0.0 (9.7) 6,688.47 448,893.3 16.1 1.8 3.5
Kuwait 5,713.99 (0.9) (1.8) (12.6) 199.05 88,191.8 14.6 1.0 4.5
Oman 5,744.76 (1.0) (2.2) (9.4) 42.70 23,401.1 10.5 1.3 4.5
Bahrain 1,283.65 (0.6) (1.2) (10.0) 8.69 20,078.4 8.1 0.8 5.3
Source: Bloomberg, country exchanges and Zawya (** Trailing Twelve Months; * Value traded ($ mn) do not include special trades, if any; # Data as of September 16, 2015)
11,657.27
11,534.32
11,503.66
11,558.13
11,418.68
0
4,500,000
9,000,000
11,250
11,475
11,700
13-Sep 14-Sep 15-Sep 16-Sep 17-Sep
Volume QSEIndex
0.1%
(0.6%) (0.9%) (1.0%) (1.3%)
(2.5%)
(3.7%)
(4.0%)
(2.0%)
0.0%
2.0%
Dubai
Bahrain
Kuwait
Oman
AbuDhabi
SaudiArabia
Qatar(QSE)*
2. Page 2 of 6
News
Economic News
Qatar begins work at 2022 FIFA World Cup final venue – According
to the tournament officials, Qatar has begun construction work in
Lusail, where the 2022 FIFA World Cup final will be played.
Preparatory work, including the stationing of site offices and five
kilometers of hoarding, have gone up at the site in Lusail, north of
the capital, Doha. The opening game of the 2022 tournament will
also be staged at the 80,000-seater Lusail Stadium. The Stadium's
Project Director, Mubarak Al-Khulaifi said that organizers were
pleased to have initiated a presence on the site, which has a
special significance for Qataris. Lusail is the sixth venue currently
under construction for the 2022 FIFA World Cup, the first to be
played in the Middle East. The Stadium is being designed by
British architects Foster and Partners. (Gulf-Times.com)
Qatar earmarks more than 95% infrastructure investments for
road transport projects – Qatar has earmarked more than 95% of
its investments in infrastructure development for road transport
projects, especially to expand the highways network to more than
8,500km, as well as build 200 bridges and 30 tunnels over the
next five to seven years. HE the Transport Minister Jassim Seif
Ahmed al-Sulaiti said most of the proposed projects would be
completed at least two years before Qatar hosts the 2022 FIFA
World Cup. He said Qatar's GDP has grown more than 20 times in
two decades and the trend is expected to continue in the coming
years as well, attributing the growth to the continuous rise in the
production of hydrocarbons and their exports. The minister
pointed out that the growth in the non-hydro-carbon sector and
the services sector has also contributed to the overall
development of the country. Acknowledging that Qatar is facing
mounting challenges on account of some of the major
commitments that need to be addressed in less than a decade, the
minister hoped the introduction and application of new
techniques as well as solutions in different areas of transport
would help Qatar attain its targets well on schedule. The minister
further added that Qatar's spending on transport projects will be
unaffected by low oil prices. (Gulf-Times.com, Qatar Tribune)
Qatar Rail: Around 50% of Doha Metro tunneling work completed –
Qatar Rail said that around 50% of the 113-kilometer long
tunneling works for Doha Metro has been completed with the
help of 21 tunnel boring machines (TBM) that are advancing
underground at full swing. Qatar Rail Managing Director Abdulla
Abdulaziz Al Subaie said that the Doha Metro project is advancing
as per schedule with QR60bn worth of contracts awarded to nine
joint ventures. He said Doha metro system construction works are
being carried out over two stages, the first of which sees the
construction of three out of the four lines and 37 stations and
these lines are expected to be thrown open to the public by late
2019. Currently, transport projects worth $44bn are under
construction in Qatar and projects worth $35bn are due to be
awarded over the next three years. Meanwhile, Al Subaie said that
Qatar Rail broke the world record and entered the Guinness Book
for the largest number of TBM operating at the same time under
one city. (Peninsula Qatar)
Market & Corporate News
Nebras Power signs deal for 500MW project in Indonesia – Nebras
Power and Indonesia’s electricity corporation, PT PLN (Persero),
have signed an agreement for the construction of a 500 megawatt
(MW) gas-powered power plant in Northern Sumatra, worth
around $300mn. In addition, there will be a gas distribution
system and also a gas receiving terminal. Nebras Power Chairman
Fahad bin Hamad al-Mohannadi did not reveal specific details of
the project but said that the two companies were still in the
finalization phase of negotiations on the uptake of the contract
and the fuel supply agreement. Citing Indonesia’s plans to
generate 35,000MW over the next five years, Al-Mohannadi said
Nebras is open to plans of increasing the power plant’s capacity.
(Gulf-Times.com)
IHGS seeks shareholders’ nod for QR20mn capital increase –
Islamic Holding Group (IHGS) has invited its shareholders to
attend the extraordinary general assembly meeting (EGM) on
October 6, 2015. The EGM will consider increasing the company's
capital by 50% from QR40mn to QR60mn through the issuance of
2mn new shares. The shares will be offered for subscription to the
eligible shareholders that have the right to subscribe at a rate of
one new share for each two existing shares at a nominal value of
QR10 plus a share premium of QR40 per share. Shareholders will
consider assigning a date of the initial public offering (IPO) in
accordance with the regulations of the Qatar Financial Markets
Authority or authorize the board of directors to determine the
initial date, dates of payment, eligibility for subscription and to
assign an issuance manager and auditor in charge to follow up the
IPO process. The EGM will also consider a recommendation to
amend Article (6) of the Articles of Association after finalizing the
increase in capital. (QSE)
Banks worried over payment default by real estate developers –
According to a survey conducted by Qatar Central Bank (QCB),
payment default by real estate developers and contractors are
causing major concerns to Qatar’s conventional banks. The QCB
survey on ‘risk perception of banks’ for the years 2014, 2015 and
2016 has revealed that defaults by infrastructure sector is equally
a matter of concern for these banks, but not a major problem for
Islamic and foreign banks. The risk average that ranges between
1-6, shows the risk of default by real estate developers and
contractors has been ranked the highest (One) for the year 2014
and “2” for 2015 and 2016. The risk average for default in
infrastructure are ‘2’,’3’ and ‘3’ for the year 2014, 2015 and 2016,
respectively. Variations in oil prices have been projected highly
risky for foreign banks and Islamic banks. For the conventional
banks, the risk average is ‘3’,’2’ and ‘1’ for the years 2014, 2015
and 2016, respectively. Foreign banks see the decline in fiscal
balance as a problem. The survey that forms a part of the central
bank’s latest financial stability report showed most of the banks
expect overall credit, market, liquidity and systemic risk to
remain unchanged or increase during 2015 and 2016. (Peninsula
Qatar)
Milaha: Qatar transport boom set to continue in coming years –
Qatar Navigation (Milaha) said the boom in Qatar’s transport
sector is expected to continue over the coming years, fueled by
significant investments in the sector across all modes of transport.
Milaha president and Chief Executive Abdulrahman Essa al-
Mannai said that in light of the massive investments in Qatar, it is
a good time to be part of Qatar’s transport sector. The momentum
can be felt across all segments, including land, air and sea with
development of rail and road networks, expansion of airport, and
a new seaport. (Gulf-Times.com)
QNBK to open branch in Saudi Arabia – The Saudi Council of
Ministers (SCM) has granted a license to QNB Group (QNBK) to
open a branch in Saudi Arabia. Out of the 12 foreign banks
licensed to operate in Saudi, five are Gulf lenders; two are from
Bahrain and one each from Kuwait, the UAE and Oman. Other
foreign lenders include JP Morgan, Deutsche Bank and Morgan
Stanley. (Peninsula Qatar)
3. Page 3 of 6
Qatar Stock Exchange
Top Gainers Top Decliners
Source: Qatar Stock Exchange (QSE) Source: Qatar Stock Exchange (QSE)
Most Active Shares by Value (QR Million) Most Active Shares by Volume (Million)
Source: Qatar Stock Exchange (QSE) Source: Qatar Stock Exchange (QSE)
Investor Trading Percentage to Total Value Traded Net Traded Value by Nationality (QR Million)
Source: Qatar Stock Exchange (QSE) Source: Qatar Stock Exchange (QSE)
6.4%
3.7%
3.0% 2.9%
1.5%
0.0%
3.0%
6.0%
9.0%
National
Leasing
Mannai Corp. Al Ahli Bank Al Khaleej
Takaful
Insurance
Qatar Cinema
& Film
Distribution
-9.2%
-6.8%
-5.3% -5.1% -4.8%
-12.0%
-8.0%
-4.0%
0.0%
Qatari Investors
Group
Industries Qatar QNB Group Qatar
International
Islamic Bank
Masraf Al Rayan
157.8
133.0
120.9
114.6
84.7
0.0
60.0
120.0
180.0
Masraf Al
Rayan
QNB Group Mazaya Qatar Industries
Qatar
Barwa Real
Estate
7.5
3.6
3.0
2.3
2.0
0.0
3.0
6.0
9.0
Mazaya Qatar Masraf Al
Rayan
Ezdan Real
Estate
Vodafone
Qatar
Barwa Real
Estate
0%
20%
40%
60%
80%
100%
Buy Sell
36.34%
25.90%
20.11%
21.60%
15.23%
10.18%
28.31%
42.32%
Qatari Individuals Qatari Institutions
Non-Qatari Individuals Non-Qatari Institutions
746
576
628
694
118
(118)
(200) - 200 400 600 800
Qatari
Non-Qatari
Net Investment Total Sold Total Bought
4. Page 4 of 6
TECHNICAL ANALYSIS OF THE QSE INDEX
Source: Bloomberg
The QSE Index could not maintain its recovery, and as expected, it could not break above the 11,900 level. The week was concluded with a 3.66% drop vs the
week before. As a result, the Index is still flat but more to the downtrend. Breaking below 11,000 can set further selloff, and maintaining above might bring
stability to the recent fluctuations.
DEFINITIONS OF KEY TERMS USED IN TECHNICAL ANALYSIS
RSI (Relative Strength Index) indicator – RSI is a momentum oscillator that measures the speed and change of price movements. The RSI oscillates between 0 to
100. The index is deemed to be overbought once the RSI approaches the 70 level, indicating that a correction is likely. On the other hand, if the RSI approaches
30, it is an indication that the index may be getting oversold and therefore likely to bounce back.
MACD (Moving Average Convergence Divergence) indicator – The indicator consists of the MACD line and a signal line. The divergence or the convergence of the
MACD line with the signal line indicates the strength in the momentum during the uptrend or downtrend, as the case may be. When the MACD crosses the signal
line from below and trades above it, it gives a positive indication. The reverse is the situation for a bearish trend.
Candlestick chart – A candlestick chart is a price chart that displays the high, low, open, and close for a security. The ‘body’ of the chart is portion between the
open and close price, while the high and low intraday movements form the ‘shadow’. The candlestick may represent any time frame. We use a one-day
candlestick chart (every candlestick represents one trading day) in our analysis.
Doji candlestick pattern – A Doji candlestick is formed when a security's open and close are practically equal. The pattern indicates indecisiveness, and based on
preceding price actions and future confirmation, may indicate a bullish or bearish trend reversal.
Shooting Star/Inverted Hammer candlestick patterns – These candlestick patterns have a small real body (open price and close price are near to each other),
and a long upper shadow (large intraday movement on the upside). The Shooting Star is a bearish reversal pattern that forms after a rally. The Inverted Hammer
looks exactly like a Shooting Star, but forms after a downtrend. Inverted Hammers represent a potential bullish trend reversal.
5. Page 5 of 6
Source: Bloomberg
Company Name
Price
(Sept 17)
% Change 5-
Day
% Change
YTD
Market Cap.
QR Million TTM P/E P/B Div. Yield
Qatar National Bank 185.50 (5.26) (12.87) 129,800 11.8 2.3 4.0
Qatar Islamic Bank 115.00 (4.17) 12.52 27,174 15.5 1.9 3.7
Commercial Bank of Qatar 55.80 0.18 (10.39) 18,226 9.7 1.1 5.7
Doha Bank 49.80 (2.35) (12.63) 12,867 9.4 1.0 8.0
Al Ahli Bank 48.00 3.00 (3.30) 8,722 13.7 2.0 2.8
Qatar International Islamic Bank 75.00 (5.06) (8.20) 11,353 13.2 2.2 5.3
Masraf Al Rayan 42.70 (4.79) (3.39) 32,025 15.3 3.2 4.1
Al Khaliji Bank 21.01 (2.23) (4.72) 7,564 12.4 1.3 4.8
National Leasing 17.76 6.35 (11.20) 879 N/M 0.7 4.8
Dlala Holding 19.90 (2.21) (40.49) 565 N/M 2.0 N/A
Qatar & Oman Investment 13.75 0.36 (10.71) 433 6.7 1.2 5.8
Islamic Holding Group 116.10 (1.78) (6.75) 464 31.9 7.5 2.6
Banking and Financial Services 250,072
Zad Holding 92.00 0.44 9.52 1,203 10.4 1.5 4.3
Qatar German Co. for Medical Devices 13.32 (3.34) 31.23 154 N/M 1.0 N/A
Salam International Investment 12.27 (1.13) (22.59) 1,403 18.0 0.9 4.9
Medicare Group 165.00 (2.08) 41.03 4,644 23.6 5.3 1.1
Qatar Cinema & Film Distribution 40.10 1.52 0.25 252 19.4 1.8 2.3
Qatar Fuel 152.00 (2.50) (25.60) 12,838 11.2 2.0 5.9
Qatar Meat and Livestock 52.80 (2.22) (12.58) 950 15.5 4.0 4.7
Al Meera Consumer Goods 251.60 (1.02) 25.80 5,032 23.4 3.8 3.6
Consumer Goods and Services 26,476
Qatar Industrial Manufacturing 42.40 (2.86) (2.19) 2,015 12.1 1.4 7.1
Qatar National Cement 103.00 0.98 (14.17) 5,563 13.1 2.1 3.5
Industries Qatar 125.80 (6.81) (25.12) 76,109 12.8 2.4 5.6
Qatari Investors Group 44.50 (9.18) 7.49 5,533 23.7 2.4 1.7
Qatar Electricity and Water 214.90 (1.42) 14.61 23,639 14.8 3.6 3.5
Mannai Corp. 97.90 3.71 (10.18) 4,466 9.1 2.1 6.1
Aamal 13.68 (1.16) (5.44) 8,618 13.6 1.2 7.0
Gulf International Services 59.20 (4.52) (39.03) 11,002 7.1 2.9 9.3
Mesaieed Petrochemical Holding 20.99 0.29 -28.8 26,370 20.4 1.9 5.2
Industrials 163,315
Qatar Insurance 92.80 (4.33) 17.79 17,133 18.2 3.0 2.3
Doha Insurance 23.00 (2.04) (20.69) 1,150 13.0 1.1 4.3
Qatar General Insurance & Reinsurance 55.50 (0.89) 8.18 4,415 4.7 0.8 3.1
Al Khaleej Takaful Insurance 35.00 2.94 (20.77) 893 16.5 1.4 3.7
Qatar Islamic Insurance 73.00 (2.01) (7.59) 1,095 14.6 3.5 5.5
Insurance 24,686
United Development 23.30 (1.85) (1.23) 8,250 12.1 0.8 5.4
Barw a Real Estate 43.05 (2.16) 2.74 16,752 2.7 0.9 5.1
Ezdan Real Estate 18.35 (1.87) 22.99 48,673 33.4 1.7 2.2
Mazaya Qatar Real Estate Development 16.00 (2.20) (12.27) 1,680 9.7 1.3 1.8
Real Estate 75,355
Qatar Telecom 74.60 (0.27) (39.79) 23,896 16.7 1.1 5.4
Vodafone Qatar 13.48 (3.71) (18.05) 11,396 N/M 2.2 1.6
Telecoms 35,292
Qatar Navigation (Milaha) 98.00 (1.51) (1.51) 11,223 9.4 0.8 5.6
Gulf Warehousing 70.90 1.29 25.71 3,372 21.0 3.8 2.1
Qatar Gas Transport (Nakilat) 22.50 (2.22) (2.60) 12,600 13.2 3.2 5.3
Transportation 27,196
Qatar Exchange 602,392
6. Contacts
Saugata Sarkar Sahbi Kasraoui QNB Financial Services SPC
Head of Research Head of HNI Contact Center: (+974) 4476 6666
Tel: (+974) 4476 6534 Tel: (+974) 4476 6544 PO Box 24025
saugata.sarkar@qnbfs.com.qa sahbi.alkasraoui@qnbfs.com.qa Doha, Qatar
Disclaimer and Copyright Notice: This publication has been prepared by QNB Financial Services SPC (“QNBFS”) a wholly-owned subsidiary of QNB SAQ (“QNB”). QNBFS is regulated by the Qatar
Financial Markets Authority and the Qatar Exchange QNB SAQ is regulated by the Qatar Central Bank. This publication expresses the views and opinions of QNBFS at a given time only. It is not an offer,
promotion or recommendation to buy or sell securities or other investments, nor is it intended to constitute legal, tax, accounting, or financial advice. QNBFS accepts no liability whatsoever for any
direct or indirect losses arising from use of this report. Any investment decision should depend on the individual circumstances of the investor and be based on specifically engaged investment advice.
We therefore strongly advise potential investors to seek independent professional advice before making any investment decision. Although the information in this report has been obtained from
sources that QNBFS believes to be reliable, we have not independently verified such information and it may not be accurate or complete. QNBFS does not make any representations or warranties as to
the accuracy and completeness of the information it may contain, and declines any liability in that respect. For reports dealing with Technical Analysis, expressed opinions and/or recommendations
may be different or contrary to the opinions/recommendations of QNBFS Fundamental Research as a result of depending solely on the historical technical data (price and volume). QNBFS reserves the
right to amend the views and opinions expressed in this publication at any time. It may also express viewpoints or make investment decisions that differ significantly from, or even contradict, the views
and opinions included in this report. This report may not be reproduced in whole or in part without permission from QNBFS
COPYRIGHT: No part of this document may be reproduced without the explicit written permission of QNBFS.
Page 6 of 6