1. Round Robin Algorithm Scheduling Algorithm
RR Scheduling Example:
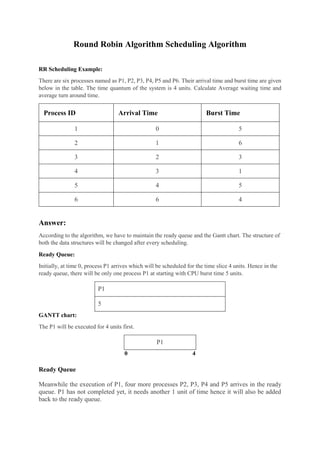
There are six processes named as P1, P2, P3, P4, P5 and P6. Their arrival time and burst time are given
below in the table. The time quantum of the system is 4 units. Calculate Average waiting time and
average turn around time.
Process ID Arrival Time Burst Time
1 0 5
2 1 6
3 2 3
4 3 1
5 4 5
6 6 4
Answer:
According to the algorithm, we have to maintain the ready queue and the Gantt chart. The structure of
both the data structures will be changed after every scheduling.
Ready Queue:
Initially, at time 0, process P1 arrives which will be scheduled for the time slice 4 units. Hence in the
ready queue, there will be only one process P1 at starting with CPU burst time 5 units.
P1
5
GANTT chart:
The P1 will be executed for 4 units first.
P1
0 4
Ready Queue
Meanwhile the execution of P1, four more processes P2, P3, P4 and P5 arrives in the ready
queue. P1 has not completed yet, it needs another 1 unit of time hence it will also be added
back to the ready queue.
2. Process P2 P3 P4 P5 P1
Burst Time 6 3 1 5 1
GANTT chart
After P1, P2 will be executed for 4 units of time which is shown in the Gantt chart.
P1 P2
0 4 8
Ready Queue
During the execution of P2, one more process P6 is arrived in the ready queue. Since P2 has
not completed yet hence, P2 will also be added back to the ready queue with the remaining
burst time 2 units.
P3 P4 P5 P1 P6 P2
3 1 5 1 4 2
GANTT chart
After P1 and P2, P3 will get executed for 3 units of time since its CPU burst time is only 3
seconds.
P1 P2 P3
0 4 8 12
Ready Queue
Since P3 has been completed, hence it will be terminated and not be added to the ready queue.
The next process will be executed is P4.
P4 P5 P1 P6 P2
1 5 1 4 2
GANTT chart
After, P1, P2 and P3, P4 will get executed. Its burst time is only 1 unit which is lesser then the
time quantum hence it will be completed.
3. P1 P2 P3 P4
0 4 8 11 12
Ready Queue
The next process in the ready queue is P5 with 5 units of burst time. Since P4 is completed
hence it will not be added back to the queue.
P5 P1 P6 P2
5 1 4 2
GANTT chart
P5 will be executed for the whole time slice because it requires 5 units of burst time which is
higher than the time slice.
P1 P2 P3 P4 P5
0 4 8 11 12 16
Ready Queue
P5 has not been completed yet; it will be added back to the queue with the remaining burst time
of 1 unit.
P1 P6 P2 P5
1 4 2 1
GANTT Chart
The process P1 will be given the next turn to complete its execution. Since it only requires 1
unit of burst time hence it will be completed.
P1 P2 P3 P4 P5 P1
0 4 8 11 12 16 17
Ready Queue
P1 is completed and will not be added back to the ready queue. The next process P6 requires
only 4 units of burst time and it will be executed next.
4. P6 P2 P5
4 2 1
GANTT chart
P6 will be executed for 4 units of time till completion.
P1 P2 P3 P4 P5 P1 P6
0 4 8 11 12 16 17 21
Ready Queue
Since P6 is completed, hence it will not be added again to the queue. There are only two
processes present in the ready queue. The Next process P2 requires only 2 units of time.
P2 P5
2 1
GANTT Chart
P2 will get executed again, since it only requires only 2 units of time hence this will be
completed.
P1 P2 P3 P4 P5 P1 P6 P2
0 4 8 11 12 16 17 21 23
Ready Queue
Now, the only available process in the queue is P5 which requires 1 unit of burst time. Since
the time slice is of 4 units hence it will be completed in the next burst.
P5
1
GANTT chart
P5 will get executed till completion.
P1 P2 P3 P4 P5 P1 P6 P2 P5
0 4 8 11 12 16 17 21 23 24
5. As, we know to calculate:
Turn Around Time = Completion Time - Arrival Time
Waiting Time = Turn Around Time - Burst Time
Process
ID
Arrival
Time
Burst
Time
Completion
Time
Turn Around
Time
(Completion Time –
Arrival Time)
Waiting
Time
(Turn Around Time –
Arrival Time)
1 0 5 17 17 12
2 1 6 23 22 16
3 2 3 11 9 6
4 3 1 12 9 8
5 4 5 24 20 15
6 6 4 21 15 11
Avg Waiting Time = ∑
=(12+16+6+8+15+11)/6
=68/6
= 11.33 ms
Avg Turn Around Time = ∑
=(17+22+9+9+20+15)/6
=92/6
= 15.33 ms
Turn Around time of All Process
Waiting Time of All Process
No of Process
No of Process