SlideShare a Scribd company logo
1 of 11
Table S1. The equations of epidemiologic indicators in the article
Number Equation
Equation 1. Point prevalence
=
Number of cases of a disease present in the population at a specified time
Number of persons in the population at that moment
× 1000
Equation 2. Period prevalence
=
Number of cases of a disease present in the population at a specified period
Average number of persons in the population at that period
× 1000
Equation 3.
Cumulative incidence rate =
Number of new cases of a disease occurring in the population
during a specified period of time
Number of persons who are (disease−free and) at risk of developing the disease
during that period of time
× 1000
Equation 4. Person-time incidence rate
=
Number of new cases of a disease occurring in a population during a specified period of time
Total person − time (∑Person − Time)
Equation 5. Overall attack rate =
Number of new cases
Number of total population
× 100 (or × 1000)
Primary attack rate =
Number of new cases among denominator
Number of susceptible people
exposed to the source of the disease
× 100 (or × 1000)
Equation 6. Secondary attack rate
=
Number of new cases developed during the maximum incubation period of the pathogen
Number of susceptible people who were in contact with the primary cases
× 100
=
Number of new cases developed during the maximum incubation period of the pathogen
Number of susceptible household members who were in contact with the primary cases
× 100
Equation 7. Crude death rate =
Number of crude deaths during a specified year
Number of average (or midpoint) population
during that year
× 1000
Equation 8. Cause − specific death rate =
Number of deaths due to a specific cause during a specified year
Number of average (or midpoint) population during that year
× 100000
Equation 9. Age − specific death rate =
Number of deaths in a specific age group
Number of population in a specific age group
× 100000
Equation 10. Sex − specific death rate =
Number of deaths in a specific sex
Number of population of that sex
× 100000
Equation 11. Female age-specific death rate, age 30 to 44
=
Number of deaths in women aged 30− 44
due to breast cancer in a specified year
Midpoint population number of women aged 30− 44 in that year
× 100000
Equation 12. Case-fatality rate (%) =
Number of patients who die from a specific disease in a specific period
Number of patients with that disease in that period
× 100
Equation 13. Death-to-case ratio =
Number of deaths from a specific disease in a certain period
Number of new cases of that disease detected in that period
× 100
Equation 14. Proportional mortality (%) =
Number of deaths from a specific cause in a specified year
Number of total deaths in that year
× 100
Equation 15. Proportional mortality ratio =
PM of specific population B
PM of specific population A
× 100
Or
Observed PM in specific population B
Expected PM in standard population
× 100
Equation 16.
Infant mortality rate =
Number of deaths in a specified year of
children less than 1 year of age
Number of live births in the same year
× 1000
Equation 17. Neonatal mortality rate =
Number of deaths in infants under 28 days of age in a given period
Number of live births in the same period
× 1000
Equation 18.
α − index =
Infant mortality rate
Neonatal mortality rate
Equation 19.
Perinatal mortality rate =
Number of perinatal deaths
Total births in perinatal period
× 1,000
=
Fetal deaths from the completion of gestational week 22 plus neonatal deaths in a given period
Fetal deaths from the completion of gestational week 22+ live births in a given period
× 1000
Equation 20. Maternal mortality ratio (MMR)
=
Number of maternal deaths due to pregnancy, childbirth and postpartum complications in a specified year
Number of births in that year
× 100000
Equation 21.
Crude birth rate =
Number of live births in residents
in an area in a specified year
Average or midyear population
in the area in that year
× 1000
Equation 22.
General fertility rate =
Number of live births during a year
Midyear female population aged 15 − 49
in the same area in the same year
× 1000
Equation 23.
Age − specific fertility rate =
Number of live births occurring
during a specified year in women
of a specific age group
Number of person − years lived
during that year
by women of that age group
× 1000
Equation 24.
Total fertility rate = ∑ Age − specific fertility rate
49
x=15
Table S2. The examples and questions of epidemiologic indicators explained in this article
Number Questionand answer
Question 1. Forty new cases of disease A have occurred in a community of 1000 individuals who had never experienced the disease for
the previous 10 years. What is the cumulative incidence rate of disease A in this community?
Answer 1. The cumulative incidence rate of disease A = 40/1000 for 10 years. Alternatively, the cumulative incidence rate of disease
A in this community is 4 cases per 1000 person-years.
Question 2 Figure 1 shows the number of people in a sample population at various time points and the number of cases who developed
a disease for various durations. Calculate the prevalence on January 1, 1991 and on December 31, 1993. Express the rate
per 10000 population.
Answer 2. Point prevalence on January 1, 1991 = 2/1000 × 10000 = 20 patients per 10000 population
Point prevalence on December 31, 1993 = 3/2000 × 10000 = 15 patients per 10000 population
Question 3. Calculate the period prevalence from January 1, 1992 to December 31, 1992, using (a) the midpoint population of people
alive on July 1, 1992 as the denominator, and (b) the average number of persons in the population from the beginning and
the end of 1992 as the denominator
Answer 3. (a) 6/1300 × 10000 = 46 cases per 10,000 population
(b) 6/([1200+1500]/2) × 10000 = 44 cases per 10000 population
Question 4. Calculate the period prevalence from January 1, 1991 to December 31, 1993, using the average number of persons in the
population from the beginning to the end of the period.
Answer 4. Period prevalence from 1991 to 1993 = 10 / ([1000+2000]/2) × 10000 = 67 patients per 10000 population
Question 5. Calculate the cumulative incidence rate of disease A per 10000 population from January 1, 1991 to December 31, 1993,
using the average number of persons in the population from the beginning to the end of the period.
Answer 5. Numerator = 8 new cases (the ninth and tenth patients are excluded because they were diagnosed prior to the period of
interest)
Denominator = (The average number of persons in the population from January 1, 1991 to December 31, 1993) – 2 (the
ninth and tenth patients who became no longer susceptible to the disease)
Therefore, the cumulative incidence per 10000 population
=
(10 [total number of patients]− 2 [prevalent cases diagnosed before 1991 ])
(Average number of the population from 1991 to 1993)− 2 (prevalent cases)
× 10,000
= 8 / 1498 × 10000 = 0.67 cases per 10000 in 3 years
Question 6. Figure S2 shows a population in which cardiovascular disease occurred in some individuals. Calculate the person-time
incidence rate of cardiovascular disease in this population.
Answer 6. Numerator = 5 cases observed during 7 years of follow-up
Denominator = Sum of susceptible person-years of the healthy population observed = 40 person-years
Person-time incidence rate = 12.5 cases per 100 person-years (note that the person-time after onset of disease is not
counted).
Question 7. Calculate the cumulative incidence rate of cardiovascular disease.
Answer 7. (During 7 years of observation)
Numerator = Number of new cases observed (5)
Denominator = Sum of susceptible persons (10)
Cumulative incidence rate = 50 cases per 100 population per 7 years
Question 8. Calculate the average duration of cardiovascular disease in the population of figure S2.
Answer 8. Prevalence = Incidence × (Average) Duration
Numerator = Total duration of illness (11 years)
Denominator = Total number of incident cases (5)
Therefore, the average duration is 2.2 years.
Question 9. Table S3 shows a summary of data from the Middle East respiratory syndrome (MERS) outbreak in hospital A, where the
index case was hospitalized in 2015. The index case was in ward B from May 15 to May 17. Subsequently, from May 15
to May 21, 13 of 70 inpatients in ward B were confirmed as MERS cases. In ward C, where patients who had not been
diagnosed with MERS in ward B were transferred, 7 additional cases of MERS were confirmed from May 20 to May 29.
Calculate the attack rate among nurses in ward B of hospital A when the index case was hospitalized in 2015. Sixteen
nurses were on duty during the exposure period, and two confirmed cases were reported within 14 days (the maximum
incubation period of MERS) after the index case left.
Answer 9. Attack rate = (2 ⁄ 16) × 100% = 12.5%
Question 10. Table S4 shows the general characteristics and numbers of deaths of MERS-confirmed patients in hospital A during the
2015 Middle East respiratory syndrome (MERS) outbreak in Korea. Calculate the case-fatality rate among all patients.
Answer 10. 6/36 × 100 = 16.7%
Question 11. In table S4, shen sex- and age-specific fatalities are compared, which characteristic affected fatality most strongly?
Answer 11. Case-fatality rate among males: 15.0% (=3/20), case-fatality among females: 18.8% (=3/16); case-fatality rate in 20- to 49-
year-olds: 0%, case-fatality rate in 50- to 69-year-olds: 23.1% (=3/13), case-fatality rate in 70- to 79-year-olds: 50.0%
(=3/6).
Question 12. The health bureau from a country reported a total of 15075 new patients with tuberculosis in 2002, and 802 tuberculosis
deaths in the same period. Calculate the death-to-case ratio in 2002 and interpret it.
Answer 12. 802
15075
× 100 = 5.3%
5.3 deaths occurred per 100 new tuberculosis cases. This indicator is a ratio, not a proportion, since most mortality cases
in 2002 were new tuberculosis cases prior to 2002. Most of the 802 deaths probably did not occur among the 15075 new
patients.
Figure S1. An example of several prevalent cases of disease A in a sample population between 1991 and 1993.
Figure S2. An example of the 10 new cases of coronary artery disease in a region.
Table S3. Outbreak status of Middle East respiratory syndrome (MERS) at hospital A, Korea, 2015
Inpatients who stayed in the same
ward as MERS cases or a nearby
ward
Healthy persons who were in contact
with MERS cases
Ward B
(May 15-21)
Ward C
(May 20-29)
Caregivers,
visitors
Nurses in
ward B
Nurses in
ward C
Total (n) 70 148 277 16 20
Confirmed
cases
13 7 3 2 1
Source from: Kim KM et al., 2015.
Table S4. General characteristics and numbers of deaths of MERS-confirmed patients
Characteristics n (%) Deaths (n)
Total 36 (100) 6
Sex Male 20 (55.5) 3
Female 16 (44.4) 3
Age (y) 20-49 17 (47.2) 0
50-69 13 (36.1) 3
70-79 6 (16.7) 3
Infection Primary 26 (72.2) 4
Secondary 10 (27.8) 2
Source from: Kim KM et al., 2015

More Related Content

Similar to Epidemiology Equations and Indicators Explained

Epidemiology, risk,rate,ratio,odd ratio
Epidemiology, risk,rate,ratio,odd ratioEpidemiology, risk,rate,ratio,odd ratio
Epidemiology, risk,rate,ratio,odd ratioSofiulAlam9
 
Disease occurrence measurment lec-4.pptx
Disease occurrence measurment lec-4.pptxDisease occurrence measurment lec-4.pptx
Disease occurrence measurment lec-4.pptxSaeedAbdiali
 
Data and epidemiology 2.pptx
Data and epidemiology 2.pptxData and epidemiology 2.pptx
Data and epidemiology 2.pptxAbdallahAlasal1
 
Data and epidemiology 2.pptx
Data and epidemiology 2.pptxData and epidemiology 2.pptx
Data and epidemiology 2.pptxAbdallahAlasal1
 
PRINCIPLE OF EPIDEMIOLOGY.pptx
PRINCIPLE OF  EPIDEMIOLOGY.pptxPRINCIPLE OF  EPIDEMIOLOGY.pptx
PRINCIPLE OF EPIDEMIOLOGY.pptxAyshaAlrawi1
 
Chapter 3Measures of Morbidity and Mortality Used in Epidemiol
Chapter 3Measures of Morbidity and Mortality Used in EpidemiolChapter 3Measures of Morbidity and Mortality Used in Epidemiol
Chapter 3Measures of Morbidity and Mortality Used in EpidemiolEstelaJeffery653
 
Measurement of Epidemiology(1).ppt
Measurement of Epidemiology(1).pptMeasurement of Epidemiology(1).ppt
Measurement of Epidemiology(1).pptMuhammadAdnanAkbar5
 
Ch 15 Measures of morbidity..doc
Ch 15 Measures of morbidity..docCh 15 Measures of morbidity..doc
Ch 15 Measures of morbidity..docAbedurRahman5
 
Morbidity & mortality
Morbidity & mortalityMorbidity & mortality
Morbidity & mortalityHalyna Lugova
 
MEASURES OF DISEASE FREQUENCY. ASSOSCIATION AND IMPACT
MEASURES OF DISEASE FREQUENCY. ASSOSCIATION AND IMPACTMEASURES OF DISEASE FREQUENCY. ASSOSCIATION AND IMPACT
MEASURES OF DISEASE FREQUENCY. ASSOSCIATION AND IMPACTAneesa K Ayoob
 
Understanding epidemiology study in medical statistics
Understanding epidemiology study in medical statisticsUnderstanding epidemiology study in medical statistics
Understanding epidemiology study in medical statisticsLaud Randy Amofah
 
Epidemiology for nursing student
Epidemiology for nursing studentEpidemiology for nursing student
Epidemiology for nursing studentPatel Dharmendra
 
mudule 3 Measure of health and Health Related Events.pdf
mudule 3 Measure of health and Health Related Events.pdfmudule 3 Measure of health and Health Related Events.pdf
mudule 3 Measure of health and Health Related Events.pdfteddiyfentaw
 
Topic 2 MEASURES OF DISEASE FREQUENCY.pptx
Topic 2 MEASURES OF DISEASE FREQUENCY.pptxTopic 2 MEASURES OF DISEASE FREQUENCY.pptx
Topic 2 MEASURES OF DISEASE FREQUENCY.pptxkihembopamelah
 
Principles and Methods of Epidemiologic Study
Principles and Methods of Epidemiologic StudyPrinciples and Methods of Epidemiologic Study
Principles and Methods of Epidemiologic StudyDugoGadisa
 

Similar to Epidemiology Equations and Indicators Explained (20)

Epidemiology, risk,rate,ratio,odd ratio
Epidemiology, risk,rate,ratio,odd ratioEpidemiology, risk,rate,ratio,odd ratio
Epidemiology, risk,rate,ratio,odd ratio
 
Disease occurrence measurment lec-4.pptx
Disease occurrence measurment lec-4.pptxDisease occurrence measurment lec-4.pptx
Disease occurrence measurment lec-4.pptx
 
Data and epidemiology 2.pptx
Data and epidemiology 2.pptxData and epidemiology 2.pptx
Data and epidemiology 2.pptx
 
Data and epidemiology 2.pptx
Data and epidemiology 2.pptxData and epidemiology 2.pptx
Data and epidemiology 2.pptx
 
PRINCIPLE OF EPIDEMIOLOGY.pptx
PRINCIPLE OF  EPIDEMIOLOGY.pptxPRINCIPLE OF  EPIDEMIOLOGY.pptx
PRINCIPLE OF EPIDEMIOLOGY.pptx
 
Chapter 3Measures of Morbidity and Mortality Used in Epidemiol
Chapter 3Measures of Morbidity and Mortality Used in EpidemiolChapter 3Measures of Morbidity and Mortality Used in Epidemiol
Chapter 3Measures of Morbidity and Mortality Used in Epidemiol
 
Measurement of Epidemiology(1).ppt
Measurement of Epidemiology(1).pptMeasurement of Epidemiology(1).ppt
Measurement of Epidemiology(1).ppt
 
Ch 15 Measures of morbidity..doc
Ch 15 Measures of morbidity..docCh 15 Measures of morbidity..doc
Ch 15 Measures of morbidity..doc
 
Morbidity & mortality
Morbidity & mortalityMorbidity & mortality
Morbidity & mortality
 
Week 2 ppt
Week 2 pptWeek 2 ppt
Week 2 ppt
 
MEASURES OF DISEASE FREQUENCY. ASSOSCIATION AND IMPACT
MEASURES OF DISEASE FREQUENCY. ASSOSCIATION AND IMPACTMEASURES OF DISEASE FREQUENCY. ASSOSCIATION AND IMPACT
MEASURES OF DISEASE FREQUENCY. ASSOSCIATION AND IMPACT
 
2.epidemilogic measures
2.epidemilogic measures2.epidemilogic measures
2.epidemilogic measures
 
Measures of mortality
Measures of mortalityMeasures of mortality
Measures of mortality
 
Measuring Disease.pptx
Measuring Disease.pptxMeasuring Disease.pptx
Measuring Disease.pptx
 
Understanding epidemiology study in medical statistics
Understanding epidemiology study in medical statisticsUnderstanding epidemiology study in medical statistics
Understanding epidemiology study in medical statistics
 
Epidemiology for nursing student
Epidemiology for nursing studentEpidemiology for nursing student
Epidemiology for nursing student
 
mudule 3 Measure of health and Health Related Events.pdf
mudule 3 Measure of health and Health Related Events.pdfmudule 3 Measure of health and Health Related Events.pdf
mudule 3 Measure of health and Health Related Events.pdf
 
Topic 2 MEASURES OF DISEASE FREQUENCY.pptx
Topic 2 MEASURES OF DISEASE FREQUENCY.pptxTopic 2 MEASURES OF DISEASE FREQUENCY.pptx
Topic 2 MEASURES OF DISEASE FREQUENCY.pptx
 
1.D.1.DiseFreq.ppt
1.D.1.DiseFreq.ppt1.D.1.DiseFreq.ppt
1.D.1.DiseFreq.ppt
 
Principles and Methods of Epidemiologic Study
Principles and Methods of Epidemiologic StudyPrinciples and Methods of Epidemiologic Study
Principles and Methods of Epidemiologic Study
 

Recently uploaded

Organic Name Reactions for the students and aspirants of Chemistry12th.pptx
Organic Name Reactions  for the students and aspirants of Chemistry12th.pptxOrganic Name Reactions  for the students and aspirants of Chemistry12th.pptx
Organic Name Reactions for the students and aspirants of Chemistry12th.pptxVS Mahajan Coaching Centre
 
Mastering the Unannounced Regulatory Inspection
Mastering the Unannounced Regulatory InspectionMastering the Unannounced Regulatory Inspection
Mastering the Unannounced Regulatory InspectionSafetyChain Software
 
Employee wellbeing at the workplace.pptx
Employee wellbeing at the workplace.pptxEmployee wellbeing at the workplace.pptx
Employee wellbeing at the workplace.pptxNirmalaLoungPoorunde1
 
Hybridoma Technology ( Production , Purification , and Application )
Hybridoma Technology  ( Production , Purification , and Application  ) Hybridoma Technology  ( Production , Purification , and Application  )
Hybridoma Technology ( Production , Purification , and Application ) Sakshi Ghasle
 
Arihant handbook biology for class 11 .pdf
Arihant handbook biology for class 11 .pdfArihant handbook biology for class 11 .pdf
Arihant handbook biology for class 11 .pdfchloefrazer622
 
mini mental status format.docx
mini    mental       status     format.docxmini    mental       status     format.docx
mini mental status format.docxPoojaSen20
 
How to Make a Pirate ship Primary Education.pptx
How to Make a Pirate ship Primary Education.pptxHow to Make a Pirate ship Primary Education.pptx
How to Make a Pirate ship Primary Education.pptxmanuelaromero2013
 
Nutritional Needs Presentation - HLTH 104
Nutritional Needs Presentation - HLTH 104Nutritional Needs Presentation - HLTH 104
Nutritional Needs Presentation - HLTH 104misteraugie
 
Q4-W6-Restating Informational Text Grade 3
Q4-W6-Restating Informational Text Grade 3Q4-W6-Restating Informational Text Grade 3
Q4-W6-Restating Informational Text Grade 3JemimahLaneBuaron
 
A Critique of the Proposed National Education Policy Reform
A Critique of the Proposed National Education Policy ReformA Critique of the Proposed National Education Policy Reform
A Critique of the Proposed National Education Policy ReformChameera Dedduwage
 
Presentation by Andreas Schleicher Tackling the School Absenteeism Crisis 30 ...
Presentation by Andreas Schleicher Tackling the School Absenteeism Crisis 30 ...Presentation by Andreas Schleicher Tackling the School Absenteeism Crisis 30 ...
Presentation by Andreas Schleicher Tackling the School Absenteeism Crisis 30 ...EduSkills OECD
 
Beyond the EU: DORA and NIS 2 Directive's Global Impact
Beyond the EU: DORA and NIS 2 Directive's Global ImpactBeyond the EU: DORA and NIS 2 Directive's Global Impact
Beyond the EU: DORA and NIS 2 Directive's Global ImpactPECB
 
Interactive Powerpoint_How to Master effective communication
Interactive Powerpoint_How to Master effective communicationInteractive Powerpoint_How to Master effective communication
Interactive Powerpoint_How to Master effective communicationnomboosow
 
Accessible design: Minimum effort, maximum impact
Accessible design: Minimum effort, maximum impactAccessible design: Minimum effort, maximum impact
Accessible design: Minimum effort, maximum impactdawncurless
 
Separation of Lanthanides/ Lanthanides and Actinides
Separation of Lanthanides/ Lanthanides and ActinidesSeparation of Lanthanides/ Lanthanides and Actinides
Separation of Lanthanides/ Lanthanides and ActinidesFatimaKhan178732
 
Web & Social Media Analytics Previous Year Question Paper.pdf
Web & Social Media Analytics Previous Year Question Paper.pdfWeb & Social Media Analytics Previous Year Question Paper.pdf
Web & Social Media Analytics Previous Year Question Paper.pdfJayanti Pande
 
Z Score,T Score, Percential Rank and Box Plot Graph
Z Score,T Score, Percential Rank and Box Plot GraphZ Score,T Score, Percential Rank and Box Plot Graph
Z Score,T Score, Percential Rank and Box Plot GraphThiyagu K
 

Recently uploaded (20)

Organic Name Reactions for the students and aspirants of Chemistry12th.pptx
Organic Name Reactions  for the students and aspirants of Chemistry12th.pptxOrganic Name Reactions  for the students and aspirants of Chemistry12th.pptx
Organic Name Reactions for the students and aspirants of Chemistry12th.pptx
 
TataKelola dan KamSiber Kecerdasan Buatan v022.pdf
TataKelola dan KamSiber Kecerdasan Buatan v022.pdfTataKelola dan KamSiber Kecerdasan Buatan v022.pdf
TataKelola dan KamSiber Kecerdasan Buatan v022.pdf
 
Mastering the Unannounced Regulatory Inspection
Mastering the Unannounced Regulatory InspectionMastering the Unannounced Regulatory Inspection
Mastering the Unannounced Regulatory Inspection
 
Mattingly "AI & Prompt Design: Structured Data, Assistants, & RAG"
Mattingly "AI & Prompt Design: Structured Data, Assistants, & RAG"Mattingly "AI & Prompt Design: Structured Data, Assistants, & RAG"
Mattingly "AI & Prompt Design: Structured Data, Assistants, & RAG"
 
Employee wellbeing at the workplace.pptx
Employee wellbeing at the workplace.pptxEmployee wellbeing at the workplace.pptx
Employee wellbeing at the workplace.pptx
 
Hybridoma Technology ( Production , Purification , and Application )
Hybridoma Technology  ( Production , Purification , and Application  ) Hybridoma Technology  ( Production , Purification , and Application  )
Hybridoma Technology ( Production , Purification , and Application )
 
Arihant handbook biology for class 11 .pdf
Arihant handbook biology for class 11 .pdfArihant handbook biology for class 11 .pdf
Arihant handbook biology for class 11 .pdf
 
mini mental status format.docx
mini    mental       status     format.docxmini    mental       status     format.docx
mini mental status format.docx
 
How to Make a Pirate ship Primary Education.pptx
How to Make a Pirate ship Primary Education.pptxHow to Make a Pirate ship Primary Education.pptx
How to Make a Pirate ship Primary Education.pptx
 
Nutritional Needs Presentation - HLTH 104
Nutritional Needs Presentation - HLTH 104Nutritional Needs Presentation - HLTH 104
Nutritional Needs Presentation - HLTH 104
 
Q4-W6-Restating Informational Text Grade 3
Q4-W6-Restating Informational Text Grade 3Q4-W6-Restating Informational Text Grade 3
Q4-W6-Restating Informational Text Grade 3
 
A Critique of the Proposed National Education Policy Reform
A Critique of the Proposed National Education Policy ReformA Critique of the Proposed National Education Policy Reform
A Critique of the Proposed National Education Policy Reform
 
Presentation by Andreas Schleicher Tackling the School Absenteeism Crisis 30 ...
Presentation by Andreas Schleicher Tackling the School Absenteeism Crisis 30 ...Presentation by Andreas Schleicher Tackling the School Absenteeism Crisis 30 ...
Presentation by Andreas Schleicher Tackling the School Absenteeism Crisis 30 ...
 
Beyond the EU: DORA and NIS 2 Directive's Global Impact
Beyond the EU: DORA and NIS 2 Directive's Global ImpactBeyond the EU: DORA and NIS 2 Directive's Global Impact
Beyond the EU: DORA and NIS 2 Directive's Global Impact
 
Interactive Powerpoint_How to Master effective communication
Interactive Powerpoint_How to Master effective communicationInteractive Powerpoint_How to Master effective communication
Interactive Powerpoint_How to Master effective communication
 
Accessible design: Minimum effort, maximum impact
Accessible design: Minimum effort, maximum impactAccessible design: Minimum effort, maximum impact
Accessible design: Minimum effort, maximum impact
 
Separation of Lanthanides/ Lanthanides and Actinides
Separation of Lanthanides/ Lanthanides and ActinidesSeparation of Lanthanides/ Lanthanides and Actinides
Separation of Lanthanides/ Lanthanides and Actinides
 
INDIA QUIZ 2024 RLAC DELHI UNIVERSITY.pptx
INDIA QUIZ 2024 RLAC DELHI UNIVERSITY.pptxINDIA QUIZ 2024 RLAC DELHI UNIVERSITY.pptx
INDIA QUIZ 2024 RLAC DELHI UNIVERSITY.pptx
 
Web & Social Media Analytics Previous Year Question Paper.pdf
Web & Social Media Analytics Previous Year Question Paper.pdfWeb & Social Media Analytics Previous Year Question Paper.pdf
Web & Social Media Analytics Previous Year Question Paper.pdf
 
Z Score,T Score, Percential Rank and Box Plot Graph
Z Score,T Score, Percential Rank and Box Plot GraphZ Score,T Score, Percential Rank and Box Plot Graph
Z Score,T Score, Percential Rank and Box Plot Graph
 

Epidemiology Equations and Indicators Explained

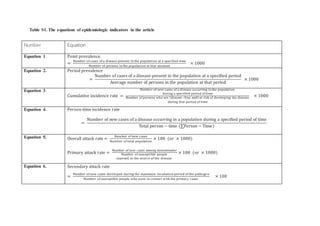
  • 1. Table S1. The equations of epidemiologic indicators in the article Number Equation Equation 1. Point prevalence = Number of cases of a disease present in the population at a specified time Number of persons in the population at that moment × 1000 Equation 2. Period prevalence = Number of cases of a disease present in the population at a specified period Average number of persons in the population at that period × 1000 Equation 3. Cumulative incidence rate = Number of new cases of a disease occurring in the population during a specified period of time Number of persons who are (disease−free and) at risk of developing the disease during that period of time × 1000 Equation 4. Person-time incidence rate = Number of new cases of a disease occurring in a population during a specified period of time Total person − time (∑Person − Time) Equation 5. Overall attack rate = Number of new cases Number of total population × 100 (or × 1000) Primary attack rate = Number of new cases among denominator Number of susceptible people exposed to the source of the disease × 100 (or × 1000) Equation 6. Secondary attack rate = Number of new cases developed during the maximum incubation period of the pathogen Number of susceptible people who were in contact with the primary cases × 100
  • 2. = Number of new cases developed during the maximum incubation period of the pathogen Number of susceptible household members who were in contact with the primary cases × 100 Equation 7. Crude death rate = Number of crude deaths during a specified year Number of average (or midpoint) population during that year × 1000 Equation 8. Cause − specific death rate = Number of deaths due to a specific cause during a specified year Number of average (or midpoint) population during that year × 100000 Equation 9. Age − specific death rate = Number of deaths in a specific age group Number of population in a specific age group × 100000 Equation 10. Sex − specific death rate = Number of deaths in a specific sex Number of population of that sex × 100000 Equation 11. Female age-specific death rate, age 30 to 44 = Number of deaths in women aged 30− 44 due to breast cancer in a specified year Midpoint population number of women aged 30− 44 in that year × 100000 Equation 12. Case-fatality rate (%) = Number of patients who die from a specific disease in a specific period Number of patients with that disease in that period × 100 Equation 13. Death-to-case ratio = Number of deaths from a specific disease in a certain period Number of new cases of that disease detected in that period × 100 Equation 14. Proportional mortality (%) = Number of deaths from a specific cause in a specified year Number of total deaths in that year × 100 Equation 15. Proportional mortality ratio = PM of specific population B PM of specific population A × 100
  • 3. Or Observed PM in specific population B Expected PM in standard population × 100 Equation 16. Infant mortality rate = Number of deaths in a specified year of children less than 1 year of age Number of live births in the same year × 1000 Equation 17. Neonatal mortality rate = Number of deaths in infants under 28 days of age in a given period Number of live births in the same period × 1000 Equation 18. α − index = Infant mortality rate Neonatal mortality rate Equation 19. Perinatal mortality rate = Number of perinatal deaths Total births in perinatal period × 1,000 = Fetal deaths from the completion of gestational week 22 plus neonatal deaths in a given period Fetal deaths from the completion of gestational week 22+ live births in a given period × 1000 Equation 20. Maternal mortality ratio (MMR) = Number of maternal deaths due to pregnancy, childbirth and postpartum complications in a specified year Number of births in that year × 100000 Equation 21. Crude birth rate = Number of live births in residents in an area in a specified year Average or midyear population in the area in that year × 1000 Equation 22. General fertility rate = Number of live births during a year Midyear female population aged 15 − 49 in the same area in the same year × 1000
  • 4. Equation 23. Age − specific fertility rate = Number of live births occurring during a specified year in women of a specific age group Number of person − years lived during that year by women of that age group × 1000 Equation 24. Total fertility rate = ∑ Age − specific fertility rate 49 x=15
  • 5. Table S2. The examples and questions of epidemiologic indicators explained in this article Number Questionand answer Question 1. Forty new cases of disease A have occurred in a community of 1000 individuals who had never experienced the disease for the previous 10 years. What is the cumulative incidence rate of disease A in this community? Answer 1. The cumulative incidence rate of disease A = 40/1000 for 10 years. Alternatively, the cumulative incidence rate of disease A in this community is 4 cases per 1000 person-years. Question 2 Figure 1 shows the number of people in a sample population at various time points and the number of cases who developed a disease for various durations. Calculate the prevalence on January 1, 1991 and on December 31, 1993. Express the rate per 10000 population. Answer 2. Point prevalence on January 1, 1991 = 2/1000 × 10000 = 20 patients per 10000 population Point prevalence on December 31, 1993 = 3/2000 × 10000 = 15 patients per 10000 population Question 3. Calculate the period prevalence from January 1, 1992 to December 31, 1992, using (a) the midpoint population of people alive on July 1, 1992 as the denominator, and (b) the average number of persons in the population from the beginning and the end of 1992 as the denominator Answer 3. (a) 6/1300 × 10000 = 46 cases per 10,000 population (b) 6/([1200+1500]/2) × 10000 = 44 cases per 10000 population Question 4. Calculate the period prevalence from January 1, 1991 to December 31, 1993, using the average number of persons in the
  • 6. population from the beginning to the end of the period. Answer 4. Period prevalence from 1991 to 1993 = 10 / ([1000+2000]/2) × 10000 = 67 patients per 10000 population Question 5. Calculate the cumulative incidence rate of disease A per 10000 population from January 1, 1991 to December 31, 1993, using the average number of persons in the population from the beginning to the end of the period. Answer 5. Numerator = 8 new cases (the ninth and tenth patients are excluded because they were diagnosed prior to the period of interest) Denominator = (The average number of persons in the population from January 1, 1991 to December 31, 1993) – 2 (the ninth and tenth patients who became no longer susceptible to the disease) Therefore, the cumulative incidence per 10000 population = (10 [total number of patients]− 2 [prevalent cases diagnosed before 1991 ]) (Average number of the population from 1991 to 1993)− 2 (prevalent cases) × 10,000 = 8 / 1498 × 10000 = 0.67 cases per 10000 in 3 years Question 6. Figure S2 shows a population in which cardiovascular disease occurred in some individuals. Calculate the person-time incidence rate of cardiovascular disease in this population. Answer 6. Numerator = 5 cases observed during 7 years of follow-up Denominator = Sum of susceptible person-years of the healthy population observed = 40 person-years Person-time incidence rate = 12.5 cases per 100 person-years (note that the person-time after onset of disease is not counted).
  • 7. Question 7. Calculate the cumulative incidence rate of cardiovascular disease. Answer 7. (During 7 years of observation) Numerator = Number of new cases observed (5) Denominator = Sum of susceptible persons (10) Cumulative incidence rate = 50 cases per 100 population per 7 years Question 8. Calculate the average duration of cardiovascular disease in the population of figure S2. Answer 8. Prevalence = Incidence × (Average) Duration Numerator = Total duration of illness (11 years) Denominator = Total number of incident cases (5) Therefore, the average duration is 2.2 years. Question 9. Table S3 shows a summary of data from the Middle East respiratory syndrome (MERS) outbreak in hospital A, where the index case was hospitalized in 2015. The index case was in ward B from May 15 to May 17. Subsequently, from May 15 to May 21, 13 of 70 inpatients in ward B were confirmed as MERS cases. In ward C, where patients who had not been diagnosed with MERS in ward B were transferred, 7 additional cases of MERS were confirmed from May 20 to May 29. Calculate the attack rate among nurses in ward B of hospital A when the index case was hospitalized in 2015. Sixteen nurses were on duty during the exposure period, and two confirmed cases were reported within 14 days (the maximum incubation period of MERS) after the index case left. Answer 9. Attack rate = (2 ⁄ 16) × 100% = 12.5% Question 10. Table S4 shows the general characteristics and numbers of deaths of MERS-confirmed patients in hospital A during the
  • 8. 2015 Middle East respiratory syndrome (MERS) outbreak in Korea. Calculate the case-fatality rate among all patients. Answer 10. 6/36 × 100 = 16.7% Question 11. In table S4, shen sex- and age-specific fatalities are compared, which characteristic affected fatality most strongly? Answer 11. Case-fatality rate among males: 15.0% (=3/20), case-fatality among females: 18.8% (=3/16); case-fatality rate in 20- to 49- year-olds: 0%, case-fatality rate in 50- to 69-year-olds: 23.1% (=3/13), case-fatality rate in 70- to 79-year-olds: 50.0% (=3/6). Question 12. The health bureau from a country reported a total of 15075 new patients with tuberculosis in 2002, and 802 tuberculosis deaths in the same period. Calculate the death-to-case ratio in 2002 and interpret it. Answer 12. 802 15075 × 100 = 5.3% 5.3 deaths occurred per 100 new tuberculosis cases. This indicator is a ratio, not a proportion, since most mortality cases in 2002 were new tuberculosis cases prior to 2002. Most of the 802 deaths probably did not occur among the 15075 new patients.
  • 9. Figure S1. An example of several prevalent cases of disease A in a sample population between 1991 and 1993.
  • 10. Figure S2. An example of the 10 new cases of coronary artery disease in a region. Table S3. Outbreak status of Middle East respiratory syndrome (MERS) at hospital A, Korea, 2015 Inpatients who stayed in the same ward as MERS cases or a nearby ward Healthy persons who were in contact with MERS cases Ward B (May 15-21) Ward C (May 20-29) Caregivers, visitors Nurses in ward B Nurses in ward C Total (n) 70 148 277 16 20
  • 11. Confirmed cases 13 7 3 2 1 Source from: Kim KM et al., 2015. Table S4. General characteristics and numbers of deaths of MERS-confirmed patients Characteristics n (%) Deaths (n) Total 36 (100) 6 Sex Male 20 (55.5) 3 Female 16 (44.4) 3 Age (y) 20-49 17 (47.2) 0 50-69 13 (36.1) 3 70-79 6 (16.7) 3 Infection Primary 26 (72.2) 4 Secondary 10 (27.8) 2 Source from: Kim KM et al., 2015