Understanding epidemiology study in medical statistics
•
1 like•52 views

An epidemiologist studies the distribution and determinants of diseases in human populations. They identify the causes of diseases and evaluate preventive and therapeutic measures. There are two main types of epidemiology - descriptive epidemiology examines disease distribution while analytic epidemiology tests hypotheses about disease causes and interventions. Observational studies include case-control studies, cohort studies, cross-sectional studies, and ecological studies. Epidemiologists measure disease occurrence through morbidity (prevalence and incidence) and mortality. Prevalence is the proportion of a population with a disease, while incidence is the proportion developing a disease over time.

Recommended
Recommended
More Related Content
What's hot
What's hot (20)
Similar to Understanding epidemiology study in medical statistics
Similar to Understanding epidemiology study in medical statistics (20)
Recently uploaded
Recently uploaded (20)
Understanding epidemiology study in medical statistics
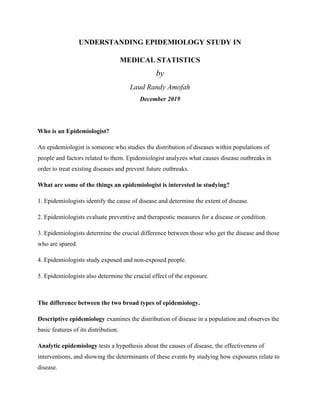
- 1. UNDERSTANDING EPIDEMIOLOGY STUDY IN MEDICAL STATISTICS by Laud Randy Amofah December 2019 Who is an Epidemiologist? An epidemiologist is someone who studies the distribution of diseases within populations of people and factors related to them. Epidemiologist analyzes what causes disease outbreaks in order to treat existing diseases and prevent future outbreaks. What are some of the things an epidemiologist is interested in studying? 1. Epidemiologists identify the cause of disease and determine the extent of disease. 2. Epidemiologists evaluate preventive and therapeutic measures for a disease or condition. 3. Epidemiologists determine the crucial difference between those who get the disease and those who are spared. 4. Epidemiologists study exposed and non-exposed people. 5. Epidemiologists also determine the crucial effect of the exposure. The difference between the two broad types of epidemiology. Descriptive epidemiology examines the distribution of disease in a population and observes the basic features of its distribution. Analytic epidemiology tests a hypothesis about the causes of disease, the effectiveness of interventions, and showing the determinants of these events by studying how exposures relate to disease.
- 2. Using examples to distinguish between the four forms of Observational study in epidemiology. a) Case-Control - A case-control is a type of observational that examines multiple exposures in relation to an outcome; subjects are defined as cases and controls, and exposure histories are compared. It identifies the cases (a group known to have the outcome) and the controls (a group known to be free of the outcome). For example; In 1993, the National Institute of Environmental Health Sciences funded a study in Iowa regarding the possible relationship between radon levels and the incidence of cancer. The study gathered information from 413 participants who had developed lung cancer and compared those results with 614 participants who did not have lung cancer. b) Cohort studies - Examines multiple health effects of exposure; subjects are defined according to their exposure levels and followed over time for outcome occurrence. For example; A recent article in the BBC News Health section described a study concerning dementia and "mid-life ills". According to the article, researches followed more than 11,000 people over a period of 12-14 years. They found that smoking, diabetes, and high blood pressure were all factors in the onset of dementia. c) Cross-sectional studies – Involves looking at data from a population at one specific point in time. For example; In 2004, researchers published an article in the New England Journal of Medicine regarding the relationship between the mental health of soldiers exposed to combat stress. The study collected information from soldiers in four combat infantry units either before their deployment to Iraq or three to four months after their return from combat duty. d) Ecological studies – This is an observational study defined by the level at which data are analyzed, namely at the population or group level, rather than the individual level. Ecological studies are often used to measure the prevalence and incidence of disease, particularly when the disease is rare. For example; exposure and risk factors are known only at the group level, such as the average air pollution concentration in different cities. The occurrence of the health outcome may also be
- 3. only known at the group level, such as overall mortality rates from chronic lung disease in the same cities with measured levels of air pollution. Measuring Disease Occurrence Morbidity: The incidence of disease, as a rate of a population that is affected. The measure of Morbidity is Prevalence and Incidence. Mortality: The death rate of a population. The measure of Mortality Incidence. Defining Prevalence; Is the proportion of a specific population having a particular disease. Let prevalence denote as p, p is a number between 0 and 1. If multiplied by 100 it is a percentage. Defining Incidence; Is the proportion of a specific, disease-free population developing a particular disease in a specific study period. Let incidence denote as I, I is a number between 0 and 1. If multiplied by 100 it is a percentage. Example 1; In a school with a population of 3052, there have occurred 11 cases of skin cancer. An epidemiologist is studying the case. i. What quantity can be used in measuring the disease occurrence in the school? Answer: Prevalence ii. Compute the quantity for the measure of skin cancer occurrence. Let prevalence denote p p = 11/3052 p = 0.0036 p = 0.0036 * 100 p = 0.36%
- 4. iii. Construct an 80% confidence interval for the quantity computed. 𝑝̂= 0.0036 Var(𝑝̂) = 𝑝(1 − 𝑝̂) n Var(𝑝̂) = 0.0036 (1 −0.0036) 3052 Var(𝑝̂) = 0.000001176 SD(𝑝̂) = √𝑉𝑎𝑟(𝑝̂) SD(𝑝̂) = √0.000001176 SD(𝑝̂) = 0.001084 80% CI is given by: 𝑝̂ ± Za/2 × SD(𝑝̂) 0.0036 ± 1.282× 0.001084 (0.00221,0.00499) Example 2; In a myopia-free rural community of 1000 adults, there have occurred 19 new cases of myopia within 3 years. i. What quantity can an epidemiologist use in measuring the myopia occurrence in the rural community? Answer: Incidence ii. Compute the quantity Let I denote Incidence I = 19/1000 I = 0.019 I = 0.019 * 100 I = 1.9%
- 5. iii. Construct a 95% CI for the quantity. 𝐼̂= 0.019 Var(𝐼̂) = 𝐼(1 − 𝐼̂) n Var(𝐼̂) = 0.019 (1 −0.019) 1000 Var(𝐼̂) = 0.0000186 SD(𝐼̂) = √ 𝑉𝑎𝑟(𝐼̂) SD(𝐼̂) = √0.0000186 SD(𝐼̂) = 0.00431 95% CI is given by: 𝐼̂ ± Za/2 × SD(𝐼̂) 0.019 ± 1.96× 0.00431 (0.0106,0.027) Example 3; In the rural community of Keti, the prevalence of malaria was 6.75% in 2017. In 2018, the population of Keti increased by 320 and the new cases of malaria recorded was 30. Using the above information [hint: population for Keti in 2018 was 1200] i. Compute the current incidence rate of malaria. Let I denote Incidence I = 30/1200 I = 0.025 I = 0.025 * 100 I = 2.5%
- 6. ii. Construct a 95% CI for the incidence rate. 𝐼̂= 0.025 Var(𝐼̂) = 𝐼(1 − 𝐼̂) n Var(𝐼̂) = 0.025(1 −0.025) 1200 Var(𝐼̂) = 0.0000203 SD(𝐼̂) = √ 𝑉𝑎𝑟(𝐼̂) SD(𝐼̂) = √0.0000203 SD(𝐼̂) = 0.00506 95% CI is given by: 𝐼̂ ± Za/2 × SD(𝐼̂) 0.025 ± 1.96× 0.00506 (0.01508,0.03491) iii. Compute the current prevalence rate of malaria. Let p be the prevalence in 2017 Population of Keti in 2017 = 1200 – 320 = 880 p = 6.75/100 p = 0.0675 𝑝 = 𝑁𝑢𝑚𝑏𝑒𝑟 𝑜𝑓 𝑝𝑒𝑜𝑝𝑙𝑒 𝑤𝑖𝑡ℎ 𝑚𝑎𝑙𝑎𝑟𝑖𝑎 𝑁𝑢𝑚𝑏𝑒𝑟 𝑜𝑓 𝑝𝑒𝑜𝑝𝑙𝑒 𝑖𝑛 𝑡ℎ𝑒 𝑝𝑜𝑝𝑢𝑙𝑎𝑡𝑖𝑜𝑛 𝑁𝑢𝑚𝑏𝑒𝑟 𝑜𝑓 𝑝𝑒𝑜𝑝𝑙𝑒 ℎ𝑎𝑣𝑖𝑛𝑔 𝑚𝑎𝑙𝑎𝑟𝑖𝑎 𝑖𝑛 2017 = 880 × 0.0675 = 59.4 ≈ 60 New cases in 2018 =30
- 7. Current number of malaria cases = 60+30 = 90 Current prevalence = 90/1200= 0.075 iv. Construct a 95% CI for the prevalence rate. 𝑝̂= 0.075 Var(𝑝̂) = 𝑝(1 − 𝑝̂) n Var(𝑝̂) = 0.075 (1 −0.075) 1200 Var(𝑝̂) = 0.0000578125 SD(𝑝̂) = √𝑉𝑎𝑟(𝑝̂) SD(𝑝̂) = √0.0000578125 SD(𝑝̂) = 0.007603 95% CI is given by: 𝑝̂ ± Za/2 × SD(𝑝̂) 0.075 ± 1.96× 0.007603 (0.0601, 0.0889) Example 4; 2x2 Contingency table Case No Case Total Exposed 52 213 265 Non-Exposed 9 116 125 Total 61 329 490 Compute the following:
- 8. i. P(Exposed) P(Exposed) = 265/490 P(Exposed) = 0.541 ii. P(Case) P(Case) = 61/490 P(Case) = 0.124 iii. P(Exposed| Case) P(Exposed| Case) = 52/61 P(Exposed| Case) = 0.852 iv. P(Case | Exposed) P(Case| Exposed) = 52/265 P(Case| Exposed) = 0.196 v. P(Non-Exposed | Cases) P(Non-Exposed| Case) = 9/61 P(Non-Exposed| Case) = 0.148 vi. P(No Case) P(No Case) = 329/490 P(No Case) = 0.671