Pupillometry for Clinical Diagnosis
•
2 likes•2,135 views

The document discusses preprocessing techniques for pupillometry data, including outlier detection, denoising, and analysis using machine learning. It reviews literature on pupillometry research and key measures obtained from pupillometry. Methods discussed for preprocessing pupillometry signals include removing outliers due to blinks, denoising using techniques like PCA decomposition and wavelet analysis, and exploring denoising autoencoders to learn the statistical structure of pupillometry signals and reconstruct clean signals.

Recommended
More Related Content
What's hot
What's hot (20)
Similar to Pupillometry for Clinical Diagnosis
Similar to Pupillometry for Clinical Diagnosis (20)
More from PetteriTeikariPhD
More from PetteriTeikariPhD (20)
Recently uploaded
Recently uploaded (20)
Pupillometry for Clinical Diagnosis
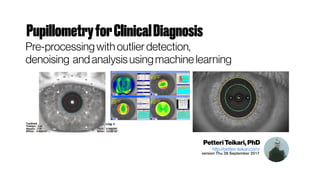
- 1. PupillometryforClinicalDiagnosis Pre-processingwith outlier detection, denoising andanalysis usingmachinelearning PetteriTeikari,PhD http://petteri-teikari.com/ version Thu 28 September 2017
- 5. PupillometryKey measures http://dx.doi.org/10.1167/iovs.15-17357 W. Szczepanowska-Nowak, A. Hachol, and H. Kasprzak. System for measurement of the consensual pupil light reflex. Optica Applicata, XXXIV(4), 2004. Pupillary parameters and units, adapted from Straub et al. 1994 http://dx.doi.org/10.1038/srep33373
- 6. PLRDiagnosticsfor example for glaucoma http://dx.doi.org/10.1038/srep33373 http://dx.doi.org/10.1016/j.ophtha.2015.06.002 Graphs showing impaired pupillary constriction responses in patients with primary open-angle glaucoma. Dose-response curves for pupillary constriction for controls (n = 161, black traces) and patients with glaucoma (n = 40) who were exposed to (A) blue 469-nm light (blue trace), and (B) red 631-nm light (red trace). For both colors of light, the magnitude of the pupillary light reflex was reduced in glaucomatous eyes as the irradiance of light was increased (>11.5 log photons/cm2 per second). Pupil diameter is expressed as a percentage of the dark pupil measured before each light exposure. Asterisks show significant differences in pupillary responses between controls and patients with glaucoma. The mean ± standard error of the mean is shown.
- 8. PLROutliersdueto blinks, themostcommonartifact LIGHTON Samples12,001 – 36,000 (120 Hz) DARK post-ligthcontrol DARK pret-ligth control Inputwith blinks Lowesssmoothed (frac= 0.02, sm.nonparametric.lowess) “Withoutoutliers” with std >1.96 from Lowess smoothing
- 9. PLRSignal
- 10. PLRDenoising Notalotof workdevotedtothis https://doi.org/10.1109/NEBC.2010.5458283 | Cited by 3 http://dx.doi.org/10.1167/iovs.02-0468 | Cited by 69 https://www.ncbi.nlm.nih.gov/pubmed/8295842 | Cited by 27 The raw pupil data included breaks due to blinks. These were removed by a custom algorithm that replaced the missing data with a linear fit from pre- to postblink diameters. Wavelet analysis (Reverse Biorthogonal Wavelet 3.7; Wavelet Toolbox ver. 4.1; The MathWorks, Natick, Ma) was used to decompose the time-varying pupil signal intoaseriesof components Raw deblinked pupil diameter, denoised pupil diameter, and fatigue wave amplitude in three patients undertaking a perimetric- type test for 10 minutes. (a) A patient whose pupil started to constrict after just 1 minute, (b) a patient who showed no pupillary changes over the whole recording session, and (c) a patient who demonstrated large pupillary fatigue waves after 4 minutes of recording. http://dx.doi.org/10.1167/iovs.09-4413
- 11. PLRDecomposition PCADecompositionofcomponents,inawaydenoisingthesignal A principle component analysis* (PCA) was used to investigate whether the variance in the pupillary responses could be accounted for in terms of functionally separable components. The method of analysis (PCA) was described previously (Young etal.,1993;Young& Kennish,1993) http://dx.doi.org/10.1016/0042-6989(94)00188-R | Cited by 32 “NOISE+ARTIFACTS” A principal component analysis (PCA) of photoreceptor excitations in natural images revealed that melanopsin activation contributes to the PC-pathway but reduced the percentage of variance explained by the PC-pathway compared with the model without including melanopsin activation (Barrionuevo & Cao, 2014). Since PCA is a linear transformation, the results showed by Barrionuevo and Cao (2014) could be interpreted as a lack of linearity in the interaction of melanopsin inputs with the rod of cone imputs in the PC- pathway. PCAappliedabitdifferentky fromKimuraandYoung(1995) ForPCAandotherdimensionalityreductiontechniques,see:
- 12. BiosignalDenoising MoreworkonEEGandECG RQ Quiroga, H Garcia - Clinical Neurophysiology, 2003 - Elsevier http://dx.doi.org/10.1016/S1388-2457(02)00365-6 Cited by 356 Related articles
- 13. BiosignalDenoising MoreworkonEEGandECG http://dx.doi.org/10.1016/j.bspc.2011.11.003 http://dx.doi.org/10.1016/j.sigpro.2016.10.019 ECG denoising was studies as a typical case study and compared with conventional bandpass, WD and SGF filters. All Matlab source codes of the proposed method are online available in the open-source electro-physiological toolbox (OSET) R. Sameni, The Open-Source Electrophysiological Toolbox (OSET), version 3.1 (2014). 〈http://www.oset.ir〉 http://dx.doi.org/10.1016/j.compbiomed.2007.06.003 Cited by 316 - Related articles
- 14. SignalDenoising Whydoesthisevenmatter? SciRep.2016;6:33373.Publishedonline2016Sep13. doi: 10.1038/srep33373PMCID: PMC5020729 QuadrantFieldPupillometry Detects Melanopsin DysfunctioninGlaucoma SuspectsandEarlyGlaucoma PrakashAdhikari,1,2 AndrewJ. Zele,a,1,2 RaviThomas,3,4 and BeatrixFeiglb,1,3,5 NospecificdescriptionofhowPLRswerefiltered beforethecomputationofthemetricsabove. The stimulus presentation, pupil recording, and analysis were controlled by custom Matlab software (version 7.12.0; Mathworks, Nitick, MA, USA). The blink artefacts were identified and extracted by a customized algorithm during software analysis of pupil recordings using linear interpolation. Ourfriend “custom algorithm”again So they assume that their mean±SD are correct however they would filter the artifacted signals Whatvalueistocomparetwomeansifthemeansare obtainedviasuboptimalartifacthandling?
- 16. DenoisingAutoencoder Theideain anutshell AlotofPLR tracesfor training “EncodestruePLR” Noiseisrandomamongtrainingsamples i.e.theresidualofPCA Decodershould returntruePLR with‘inpainted’ signal tomissing partsdue to artifacts RAWsignals withartifacts,and measurement/ physiological noise
- 17. DenoisingAutoencoder by P Vincent - 2010 - Cited by 1261 - Related articles - Slides Data-drivenreconstructionof “trueclean”signal Geometric Intelligence ->Uber Just Bought Geometric Intelligence http://dx.doi.org/10.1038/nature14541 “The link to Bayesian machine learning is that the better the probabilistic model one learns, the higher the compression rate can be. These models need to be flexible and adaptive, since different kinds of sequences have very different statistical patterns (say, Shakespeare’s plays or computer source code). It turns out that some of the world’s best compression algorithms (for example, Sequence Memoizer and PPM with dynamic parameter updates) are equivalent to Bayesian non-parametric models of sequences, and improvements to compression are being made through a better understanding of how to learn the statistical structure of sequences. Future advances in compression will come with advances in probabilistic machine learning, including special compression methods for non-sequence data such as images, graphs and other structured objects.” WhatisthestatisticalstructureofPLR signal?Try tolearnthe structure unsupervised from the data Denoisingautoencoderbroadlydefined Anyunsupervised denoisingmethod suitable for time-series such as ourPLR
- 18. DenoisingAutoencoder:Biosignaltimeseries As a primary diagnostic tool for cardiac diseases, electrocardiogram (ECG) signals are often contaminated by various kinds of noise, such as baseline wander, electrode contact noise and motion artifacts. In this paper, we propose a contractive denoising technique to improve the performance of current denoising auto-encoders (DAEs) for ECG signal denoising. Based on the Frobenius norm of the Jacobean matrix for the learned features with respect to the input, we develop a stacked contractive denoising auto-encoder (CDAE) to build a deep neural network (DNN) for noise reduction, which can significantly improve the expression of ECG signals through multi-level feature extraction. The experimental results show that the new stacked contractive denoising auto-encoder (CDAE) algorithm performs better than the conventional ECG denoising method, specifically with more than 2.40 dB improvement in the signal-tonoise ratio (SNR) and nearly 0.075 to 0.350 improvements in the root mean square error (RMSE). Astackedcontractivedenoisingauto-encoder forECGsignaldenoising PengXiong, Hongrui Wang,Ming Liu,FengLin,ZengguangHouand Xiuling Liu http://dx.doi.org/10.1088/0967-3334/37/12/2214 Semi-supervisedStackedLabelConsistent AutoencoderforReconstructionand Analysisof BiomedicalSignals AngshulMajumdar,AnupriyaGogna, andRababWard IEEETransactionson BiomedicalEngineering ( Volume: 64, Issue:9,Sept.2017 ) https://doi.org/10.1109/TBME.2016.2631620 The proposed semi- supervised stacked autoencoder is suitable for simultaneously addressing the reconstruction and classification problem. However it can also be used when there is no necessity to reconstruct. One can use the same samples at the input and the output and the corresponding class labels (if available); this would result in an autoencoder based classifier that learns and that can be applicable to any problem. In the future we would test how the proposed method excels on benchmark deep learning datasets.
- 20. DenoisingAutoencoder:Relatedapproaches#1 https://arxiv.org/abs/1610.01935 https://doi.org/10.1109/DSAA.2016.10 In this work, we demonstrate how generative models such as Hidden Markov Models (HMM) and Long Short-Term Memory (LSTM) artificial neural networkscanbeusedtoextracttemporalinformationfromthedynamicdata. http://dx.doi.org/10.1155/2016/5642856 https://arxiv.org/abs/1610.01741 https://arxiv.org/abs/1511.06406 https://github.com/jiwoongim/DVAE https://arxiv.org/abs/1603.06277v3 | https://github.com/mattjj/svae
- 21. DenoisingAutoencoder:Relatedapproaches#2 An illustration of how we combine a new generative nonlinear ICA model with the new learning principle called time-contrastive learning(TCL). Independentcomponentanalysis A Hyvärinen, J Karhunen, E Oja - 2004 - Cited by9475 NaturalImageStatistics: A ProbabilisticApproach to EarlyComputatio nalVision. AHyvärinen, J Hurri, POHoyer - 2009-.Cited by 466
- 22. DenoisingAutoencoder:Relatedapproaches#3 Electrocardiogram signaldenoising basedonempiricalmodedecomposition technique:anoverview G.Han, B.Lin and Z.Xu JournalofInstrumentation, Volume12, March2017 http://dx.doi.org/10.1088/1748-0221/12/03/P03010 Electrocardiogram (ECG) signal is nonlinear and non-stationary weak signal which reflects whether the heart is functioning normally or abnormally. ECG signal is susceptible to various kinds of noises such as high/low frequency noises, powerline interference and baseline wander. Hence, the removal of noises from ECG signal becomes a vital link in the ECG signal processing and plays a significant role in the detection and diagnosis of heart diseases. The review will describe the recent developments of ECG signal denoising based on Empirical Mode Decomposition (EMD) technique including high frequency noise removal, powerline interference separation, baseline wander correction, the combining of EMD and Other Methods, EEMD technique. EMD technique is a quite potential and prospective but not perfect method in the application of processing nonlinear and non-stationary signal like ECG signal. The EMD combined with other algorithms is a good solution to improve the performance of noise cancellation. The pros and cons of EMD technique in ECG signal denoising are discussed in detail. Finally, the future work and challenges in ECG signal denoising based on EMD techniqueare clarified. Whenthesignalisdisturbedbycontinuousweaknoises, modemixingisoftencaused bysignalintermittency.ThemodemixingisdefinedasasingleIMFconsistingof signalsofwidelydisparatescales,orasignalofasimilarscaledistributing indifferentIMF components[Wu and Huang2009;Cited by 3295 articles] .Modemixingisthemajor disadvantageinEMD denoising,henceensembleempiricalmodedecomposition(EEMD)wasintroducedto removethemodemixing effect.Byaddingwhitenoise,themodemixingcanbe eliminatedlargelyinEEMD.Theamplitudeofwhitenoiseshallbefinite,notinfinitesimal anditisnotnecessarilysmall.Asthelevelofaddednoiseisnotofcriticalimportance,as longasitisoffiniteamplitude,EEMDcanbeusedwithoutanysignificantsubjective intervention[Wu and Huang2009;Cited by 3295articles] . Generally,EMD/EEMDmakestheECGsignallookcleanerthanIIR,butdistorts amplitudeof thepeaksmore.EMDtechniquecombinedwithother algorithms(such asadaptivefilters,statisticalapproachesandwavelettransform)isa prospectiveandefficientmethodinECGsignaldenoising.TheEEMDisanimproved versionofEMDandbetterthanthetraditionalmethodsinECGsignaldenoising.Itcan largelyeliminatethemodemixingandpreservethephysicaluniquenessof decomposition. Classification ofMMGSignalBased onEMD LuluCheng,JiejingWang,ChuanjiangLi,XiaojieZhan,ChongmingZhang,ZimingQi,ZiqiangZhang https://doi.org/10.1007/978-981-10-6370-1_3
- 25. Time-serieswithmissingdata http://papers.nips.cc/paper/6160-temporal-regularized-matrix-factorization-for-high-di mensional-time-series-prediction Forecasting with Full Observations. We first compare various methods on the task of forecasting values in the test set, given fully observed training data. For synthetic, we consider one-point ahead forecasting task and use the last ten time points as the test periods. For electricity and traffic, we consider the 24-hour ahead forecasting task and use last seven days as the test periods. From Table 2, we can see that TRMF-AR outperforms all the other methods on both metrics considered. Forecasting with Missing Values. We next compare the methods on the task of forecasting in the presence of missing values in the data. We use the Walmart datasets here, and consider 6-week ahead forecasting and use last 54 weeks as the test periods. Note that SVD-AR(1) and AR(1) cannot handle missing values. The second part of Table 2 shows that we again outperform other methods. Missing Value Imputation We next consider the case of imputing missing values in the data. As in [9], we assume that blocks of data are missing, corresponding to sensor malfunctions for example, over a length of time. To create data with missing entries, we first fixed the percentage of data that we were interested in observing, and then uniformly at random occluded blocks of a predetermined length (2 for synthetic data and 5 for the real datasets). The goal was to predict the occluded values. Table 3 shows that TRMF outperforms the methods we compared to on almost all cases. TREATING MISSING DATA Various options 1. Zero-Imputation Set to zero when missing data 2. FORWARD-FILLING use previous values 3. MISSINGNESS Treat the missing value as a signal, as lack of a value measured e.g. in an ICU can carry information itself ( Lipton et al. 2016) 4. BAYESIAN STATE-SPACE MODELING to fill the missing data (Luttinen et al. 2016, BayesPy package) 5. GENERATIVE MODELING Train the deep network to generate missing samples (Im et al. 2016, RNN GAN; see also github: sequence_gan)
- 26. PLRUncertaintySimpleGaussian Process approach 95%confidenceintervals 1.96 * standard deviation gp_kernel = ExpSineSquared(1.0, 5.0, periodicity_bounds=(1e-2, 1e1)) + WhiteKernel(1e-1) sklearn.gaussian_process.GaussianProcessRegressor See e.g. Probabilistic non-linear principal component analysis with Gaussian process latent variable models N Lawrence - Journal of Machine Learning Research, 2005 We refer to this model as a Gaussian process latent variable model (GP-LVM). Through analysis of the GP-LVM objective function, we relate the model to popular spectral techniques such as kernel PCA and multidimensional scaling. We then review a practical algorithm for GP ...Cited by 660
- 27. GaussianProcesses”ofcourse” get deepalso DeepLearning withGaussian Process December 2,2016 GaussianProcess isastatisticalmodelwhere observationsareinthecontinuousdomain,tolearnmore check out atutorialongaussianprocess (byUniv.of Cambridge’s ZoubinG.).GaussianProcessisaninfinite- dimensionalgeneralizationof multivariatenormaldistributions. ResearchersfromUniversityofSheffield–AndreasC. DamanianouandNeilD.Lawrence– startedusingGaussianProcesswithDeepBeliefNetworks (in2013) .ThisBlogpostcontainsrecentpapersrelatedto combiningDeepLearningwithGaussianProcess. Bestregards, AmundTveit http://dx.doi.org/10.1007/978-3-319-34111-8_6 “How can Gaussian processes possibly replace neural networks? Have we thrown the baby out with the bathwater?” questioned MacKay (1998). It was the late 1990s, and researchers had grown frustrated with the many design choices associated with neural networks – regarding architecture, activation functions, and regularisation – and the lack of a principled framework to guide in these choices. http://www.jmlr.org/proceedings/papers/v51/wilson16.pdf
- 28. GaussianProcessesBackground #1 “Gaussian process (GP) is a popular non-parametric model for Bayesian inference. However, the performance of GP is often limited in temporal applications, where the input–output pairs are sequentially-ordered, and often exhibit time-varying non-stationarity and heteroscedasticity.” - http://doi.org/10.1016/j.neucom.2017.01.072 Heinonen et al. (2015): The standard GP model assumes that the model parameters stay constant over the input space. This includes the observational noise variance ω2 , as well as the signal variance σ2 and the lengthscale of the covariance function. The signal variance determines the signal amplitude, while the characteristic lengthscale defines the local ‘support’ neighborhood of the function. In many real world problems either the noise variance or the signal smoothness, or both, vary over the input space, implying a heteroscedatic noise model or a nonstationary function dynamics, respectively (Le et al., 2005) (see also Wang and Neal (2012)). In both cases, the analytical posterior of the GP becomes intractable (Tolvanen et al., 2014). For instance, in biological studies, rapid signal changes are often observed quickly after perturbations, with the signal becoming smoother in time (Heinonen et al., 2015). http://proceedings.mlr.press/v51/wang16c.pdf However, traditional GPs are often limited when the underlying function exhibits complex non-stationarity [1,2], or dependencies between the output dimensions. Many GP variants have been proposed to address non-stationarity, e.g., by designing non- stationary covariance functions [1,2,3], or warping GPs with different nonlinear functions [4,5,6]. Multi-output GP approaches have also been investigated [7,8,9] to better capture correlations between outputs. However, in multi-output GP approaches, the correlations between outputs remain independent of the input space. Hence their performance is often limited when data reflects input-dependent nonstationarity [10,11] or heteroscedastic noise. [1] C. E. Rasmussen, C. K. I. Williams, Gaussian Process for Machine learning, MIT Press, 2006. [2] C. J. Paciorek, M. J. Schervish, Nonstationary Covariance Functions for Gaussian Process Regression, in: NIPS, 2004. [3] A. M. Schmidt, A. O’Hagan, Bayesian Inference for Non-stationary Spatial Covariance Structure via Spatial Deformations, Journal of the Royal Statistical Society: Series B 65 (3) (2003) 743 758. [4] E. Snelson, C. E. Rasmussen, Z. Ghahramani, Warped Gaussian Processes, in: NIPS, 2004. [5] R. P. Adams, O. Stegle, Gaussian Process Product Models for Nonparametric Nonstationarity, in: ICML, 2008. [6] M. L´azaro-Gredilla, Bayesian Warped Gaussian Processes, in: NIPS, 2012. [7] P. Boyle, M. Frean, Dependent gaussian processes, in: NIPS, 2004. [8] E. V. Bonilla, K. M. A. Chai, C. K. I. Williams, Multi- task Gaussian Process Prediction, in: NIPS, 2008. [9] M. Alvarez, N. D. Lawrence, Sparse Convolved Gaussian Processes for Multi-output Regression, in: NIPS, 2008. [10] A. G. Wilson, D. A. Knowles, Z. Ghahramani, Gaussian Process Regression Networks, in: ICML, 2012. [11] A. C. Damianou, N. D. Lawrence, Deep Gaussian Processes, in: AISTATS, 2013.
- 29. GaussianProcessesBackground #2 http://www.jmlr.org/proceedings/papers/v51/saul16.pdf SheffieldML/ChainedGP “We have introduced “Chained Gaussian Process” models. They allow us to make predictions which are based on a non-linear combination of underlying latent functions. This gives a far more flexible formalism than the generalized linear models that are classicallyappliedin thisdomain”
- 30. GaussianProcessesin Healthcare#1 AnalogyofPLRto heartrate recordings, in whichthe artifactscanoccurin bursts (Stegle etal. 2008)
- 32. GaussianProcessesin Healthcare#3 https://doi.org/10.1109/BIBE.2012.6399671 https://doi.org/10.1109/TBME.2012.2210715 Time series dynamics are investigated by using in-sample forecasting and comparing the results from exponential smoothing with baseline methods. The expected prediction error is estimated using out of sample forecasting with exponential smoothing and Gaussian process regression. For both approaches,we forecast the next mood rating starting from asmallmarginandcontinuingtotheendoftheseries
- 33. GaussianProcessesin Healthcare#4 http://doi.org/10.1016/j.mvr.2017.03.008 Demonstration of the Gaussian modelling of finger photoplethysmographic (PPG) waveform. We provide evidence that the Gaussian modelling of arterial pulses can be potentially used to as a processing tool to identify waveform characteristics changes. https://arxiv.org/abs/1703.09112 “Our method, MedGP, incorporates 24 clinical and lab covariates and supports a rich reference data set from which the relationships between these observed covariates may be inferred and exploited for high-quality inference of patient state over time. In this paper, we propose a flexible and efficient framework for estimating the temporal dependencies across multiple sparse and irregularly sampled medical time series data. We developed a model with multi- output Gaussian process regression with a highly structured kernel.”
- 34. GaussianProcessesin Healthcare#5 https://arxiv.org/abs/1608.06476 Our method can distinguish oscillatory gene expression from random fluctuations of nonoscillatory expression in single-cell time series, despite peak-to-peak variability in period and amplitude of single-cell oscillations. We show that our method outperforms the Lomb- Scargle periodogram (often used in circadian biology / chronobiology to assess the period of circadian oscillators) in successfully classifying cells as oscillatory or non-oscillatory in data simulated from a simple genetic oscillator model and in experimental data. (A) Time series example of dynamics generated by two oscillatory OUosc covariance functions added together, with a period of 2.5 and 24 hours. Covariance parameters are: σ1 = 5, α1 = 0.001, β1 = 2π/24, σ2 = 1, α2 = 0.1, β2 = 2π/2.5. (B) The corresponding time series from (A) after detrending with a length scale of 7.5 hours. http://dx.doi.org/10.1007/978-3-319-22533-3_17 “Gaussian processes (GPs) provide an explicit probabilistic, nonparametric Bayesian approach to metric regression problems. This not only provides probabilistic predictions, but also gives the ability to cope with missing data and infer model parameters such as those that control the function’s shape, noise level and dynamics of the signal. “ http://proceedings.mlr.press/v56/Futoma16.pdf
- 37. TimeSeriesasimages https://doi.org/10.1109/EMBC.2016.7590825 Music as image as well http://coding-geek.com/how-shazam-works/ https://www.slideshare.net/KeunwooChoi/deep-learning-for-music-classification-20160524
- 38. AnalogytoMusic Genreclassificationforexample #1 https://github.com/crmne/Genretron https://arxiv.org/abs/1507.04761 https://arxiv.org/abs/1703.09179 http://dx.doi.org/10.1016/j.asoc.2016.12.024 https://doi.org/10.1109/LSP.2017.2657381
- 39. Text/SpeechProcessingwithMemory SequentialData Recent empirical results on long-term dependency tasks have shown that neural networks augmented with an external memory can learn the long-term dependency tasks more easily and achieve better generalization than vanilla recurrent neural networks (RNN). We suggest that memory augmented neural networks can reduce the effects of vanishing gradients by creating shortcut (or wormhole) connections. Based on this observation, we propose a novel memory augmented neural network model called TARDIS (Temporal Automatic Relation Discovery in Sequences). https://arxiv.org/abs/1701.08718
- 40. Text/SpeechProcessing Medical Data https://arxiv.org/abs/1612.01848 “Temporal data arise in these real-world applications often involves a mixture of long-term and short-term patterns, for which traditional approaches such as Autoregressive models and Gaussian Process may fail. “ LSTNet uses the Convolution Neural Network (CNN) to extract short-term local dependency patterns among variables, and the Recurrent Neural Network (RNN) to discover long-term patterns and trends
- 41. ActionRecognition Fly Behavior https://arxiv.org/abs/1611.00094 | http://www.vision.caltech.edu/~eeyjolfs/behavior_modeling/ Behavior is complex and may be perceived at different time-scales of resolution: position, trajectory, action, activity. While position and trajectory are geometrical notions, action and activity are semantic in nature. The analysis of behavior may therefore be divided into two steps: a) detection and tracking, where the pose of the body over time is estimated, and b) action/activity detection and classification, where motion is segmented into meaningful intervals, each one of which is associated with a goal or a purpose. Supervised learning is a powerful tool for learning classifiers from examples of actions provided by an expert (Kabra et al., 2013; Eyjolfsdottir et al., 2014). However, it has two drawbacks. First, it requires a lot of training examples which involves time consuming and painstaking annotation. Second, behavior measurement is limited to actions that a human can perceive and believes to be important. We propose a framework that takes advantage of both labeled and unlabeled sequences, by simultaneously predicting future motion and detecting actions, allowing the system to learn action classifiers from fewer expert labels and to discover unbiased behavior representations Paper: arXiv Poster: WiML Data: coming soon Code: coming soon
- 42. ActionRecognition Gaitandmovement http://people.virginia.edu/~jg9ur/deep-learning1.pdf This paper is motivated by this and further aim to answer the following question: can we identify the temporal gait patterns in terms of the holistic gait assessment? Traditionally this suffers from the statistical property of the causality inference method adopted by previous study. We proposed a deep convolutional neural network (CNN) to learn the temporal and spectral associations among the time- series motion data captured by the inertial body sensors. http://dx.doi.org/10.1080/17445760.2015.1044007 http://dx.doi.org/10.1007/s11517-016-1546-1 https://dx.doi.org/10.3389/fnhum.2016.00319
- 43. ActionRecognition Humanactivity recognition(HAR)withActigraphy https://arxiv.org/abs/1607.04867 Chen et al. [36] and Bulling et al. [37] present comprehensive reviews of sensor-based activity recognition literature. The most recent work in this domain includes knowledge-based inference [38], [39], ensemble methods [40], [41], data-driven approaches [42], [43], and ontology- based techniques [44]. [36] L. Chen, J. Hoey, C. D. Nugent, D. J. Cook, and Z. Yu, “Sensorbased activity recognition,” IEEE Transactions on Systems, Man, and Cybernetics, Part C (Applications and Reviews), vol. 42, no. 6, pp. 790– 808, Nov 2012. [37] A. Bulling, U. Blanke, and B. Schiele, “A tutorial on human activity recognition using body-worn inertial sensors,” ACM Comput. Surv., vol. 46, no. 3, pp. 33:1–33:33, Jan. 2014. [Online]. Available: http://doi.acm.org/10.1145/2499621 [38] A. Calzada, J. Liu, C. D. Nugent, H. Wang, and L. Martinez, “Sensorbased activity recognition using extended belief rule- based inference methodology,” in 2014 36th Annual International Conference of the IEEE Engineering in Medicine and Biology Society, Aug 2014, pp. 2694–2697. [39] D. Biswas, A. Cranny, N. Gupta, K. Maharatna, J. Achner, J. Klemke, M. Jbges, and S. Ortmann, “Recognizing upper limb movements with wrist worn inertial sensors using k-means clustering classification,” Human Movement Science, vol. 40, pp. 59 – 76, 2015. [Online]. Available: http://www.sciencedirect.com/science/article/pii/S0167945714002115 [40] A. M. Tripathi, D. Baruah, and R. D. Baruah, “Acoustic sensor based activity recognition using ensemble of one-class classifiers,” in Evolving and Adaptive Intelligent Systems (EAIS), 2015 IEEE International Conference on, Dec 2015, pp. 1–7. [41] C. Catal, S. Tufekci, E. Pirmit, and G. Kocabag, “On the use of ensemble of classifiers for accelerometer-based activity recognition,” Applied Soft Computing, vol. 37, pp. 1018 – 1022, 2015. [Online]. Available: http://www.sciencedirect.com/science/article/pii/S1568494615000447 [42] R. Akhavian and A. Behzadan, “Wearable sensor-based activity recognition for data-driven simulation of construction workers’ activities,” in 2015 Winter Simulation Conference (WSC), Dec 2015, pp. 3333–3344. [43] L. Liu, Y. Peng, M. Liu, and Z. Huang, “Sensor-based human activity recognition system with a multilayered model using time series shapelets,” Knowledge-Based Systems, vol. 90, pp. 138 – 152, 2015. [Online]. Available: http://www.sciencedirect.com/science/article/pii/S0950705115003639 [44] G. Okeyo, L. Chen, H. Wang, and R. Sterritt, “Dynamic sensor data segmentation for real-time knowledge-driven activity recognition,”Pervasive and Mobile Computing, vol. 10, Part B, pp. 155 – 172, 2014. [Online]. Available: http://www.sciencedirect.com/science/article/pii/S1574119212001393 TheActiGraphGT3X+isaclinical-gradewearabledevicethathasbeenpreviouslyvalidatedagainst clinicalpolysomnography[58].
- 44. ActionRecognition Motor EEGclassification https://arxiv.org/abs/1703.05051 “Our results show that recent advances from the machine learning field, including batch normalization and exponential linear units, together with a cropped training strategy, boosted the deep ConvNets decoding performance, reaching or surpassing that of the widely-used filter bank common spatial patterns (FBCSP) decoding algorithm. While FBCSP is designed to use spectral power modulations, the features used by ConvNets are not fixed a priori.”
- 47. ActionRecognition EEGSleep#2 https://arxiv.org/abs/1610.01741 “The main idea is to combine the generative capability of Deep Belief Network (DBN) with a discriminative ability and sequence pattern recognizing capability of Long Short-term Memory (LSTM)”
- 49. ActionRecognition Electrocardiography (ECG) http://dx.doi.org/10.1016/j.ins.2016.01.082 https://doi.org/10.1109/ICAT.2015.7340540 Normal (N), atrial premature contraction (APC), premature ventricular contraction (PVC), right bundle branch block (RBBB) and left bundle branch block (LBBB). Experimental results demonstrated that Multiscale Principal Component Analysis (MSPCA) can clean ECG signals without removing any significant information from it. System which used MSPCA for signal denoising (MSPCA-WPD- RotF) resulted in the highest performances with classification accuracy of 99.94%. F http://doi.org/10.1016/j.cmpb.2015.12.008 “Hidden Markov models (HMM) is widely used to audio and speech signal anaysis and recognition [141] ; [142]. Coast et al. [132] used HMM for the arrhythmia classification problem, other studies have used this technique to analyze ECG signals. For instance, Andreao et al. [143] validated the use of HMM for ECG analysis in medical clinics (real world).”
- 50. ActionRecognitionNotethe predictive side of themodels http://sci-hub.cc/10.1007/s00221-015-4501-8 Needtofeed somethingbacktothetestingprocedure itself? http://dx.doi.org/10.1016/0042-6989(95)00016-X, Cited by 504 https://doi.org/10.1145/2607023.2607029 http://dx.doi.org/10.1016/j.tins.2015.02.002 http://dx.doi.org/10.1167/17.1.13 https://doi.org/10.1109/IROS.2016.7759764
- 51. ActionRecognition+feedbackSSVEP https://dx.doi.org/10.1167%2F15.6.4 Conceptual illustration of steady-state responses in time and frequency domains. The spatial pattern of the broadband measure depended on the “stimulus” https://doi.org/10.1101/108993 http://doi.org/10.1016/j.cnp.2017.03.002 In other words, generate complex input based on complex response in real-time
- 54. PLRTransformations:Hilbert-Huangtransform? http://dx.doi.org/10.1016/j.bspc.2016.06.002 The development of the HHT was motivated by the need to describe non- linear and non-stationary distorted waves. It was developed at the National Aeronautics and Space Administration’s (NASA’s) Goddard Space Flight Center (GSFC). Since its introduction, it has shown the ability to analyze non-linear and non-stationary data in many areas of research (bio- signal, chemistry and chemical engineering, financial applications and others). As indicated by Flandrin et al. (2004) [Cited by 1994], one of the advantages of the HHT is that its data-driven criteria is not fully dependent on a theoretical input or formula. Also, the HHT analyses non- stationary signals locally. There are two processes involved in the HHT: the empirical mode decomposition (EMD) and the Hilbert spectral analysis (HSA). The keypart ofthemethodis thepre-processing step,the EMD, with which any complicated data set can be decomposed into a finite and often small number of intrinsic mode functions (IMF). With the Hilbert transform, the IMF yields instantaneous frequencies as functions of time that give sharp identifications of embedded structures. The final presentation of the results is a time-frequency energy distribution, which has been designated as the Hilbert spectrum. Comparisons with the Wavelet and Fourier analyses showed that the HHT method offers much better temporal and frequency resolutions Our characterization analysis is of a preliminary nature and many issues have yet to be addressed and investigated rigorously; nevertheless, from the obtained results, the HHT seems to have much potential for this initial approach. The application of non-traditional alternatives to the study of pupillograms poses a great opportunity to understand behaviors and to mitigate diseases or specific medical conditions.
- 55. PLRTransformations:FractalAnalysis? https://arxiv.org/abs/0804.0747 https://doi.org/10.3389/fphys.2012.00417 Fractal wavelet analysis uses a waveform of limited duration with an average value of zero for variable-sized windowing allowing an equally precise characterization of low and high frequency dynamics in the signal. Wavelet analysis methods can be used to estimate the singularity spectrum of a multifractal signal by exploiting the multifractal formalism (Muzy et al., 1991, 1993, 1994; Mallat and Hwang, 1992; Bacry et al., 1993; Arneodo et al., 1995, 1998; Mallat, 1999; Figure 5). http://dx.doi.org/10.1073/pnas.0806087106
- 56. PLRNormalization/Dimensionalityreduction? Z-normalization: In order to make meaningful comparisons between two time series, both must be normalized. While this may seem intuitive, and was explicitly empirically demonstrated a decade ago in a widely cited paper (Keogh and Kasetty 2003, Cited by 1074), many research efforts do not seem to realize this http://www.cs.ucr.edu/~eamonn/SIGKDD_trillion.pdf WHITENING (Sphering)? http://ufldl.stanford.edu/wiki/index.php/Whitening http://stackoverflow.com/questions/6574782/how-to-whiten-matrix-in-pca https://arxiv.org/abs/1406.1134 https://cran.r-project.org/web/packages/ForeCA/ForeCA.pdf https://arxiv.org/abs/1205.4591 Despite the fact that they do not consider the temporal nature of data, http://dx.doi.org/10.1561/2200000059 Anima Anandkumar
- 57. PLRArtifactsandNoise? http://dx.doi.org/10.1117/12.2237057 The effect of pupil diameter was further explored by Stark & Atchison [73]. Their results confirmed that the LFC (≤0.6 Hz) tended to increase with small pupils and that, in general, HFC (1.3–2.1 Hz) did not depend upon pupil size. Both components were found to increase with the mean level of the accommodation response. Later work of Day et al. [67] also found that RMS fluctuations increased with small pupils, although at each pupil size absolute values for myopes were always higher than those for emmetropes. http://dx.doi.org/10.1371/journal.pone.0054207 Degree ofinstrumentation error? Could pupils fluctuatedifferently in glaucoma? If so, can it bespotted from therecording?
- 58. PLRArtifactsandNoise? Level of smoothing CreatinggroundtruthsforPLRreconstructionpipeline Oversmoothed data Manuallycorrectthese smoothingresult? Analogous“airbrushing”toPhotoshop masking,toobtainanoptimalmixtureof supersmoothandlightlyfilteredPLRtrace(to saveannotator’stimeandbuildatool)
- 60. PLRDeepLearningNoexamplesofthisyet? ARVO2017 AnnualMeetingAbstracts 489PupilSession Wednesday,May10,20173:45PM–5:30PM ProgramNumber: 5095 PosterBoardNumber: B0705 Thedynamicpupillometryassessesretinal functionsincataractpatients JunYuan,CaipingHu. Ophthalmology, HubeiUniversityofScience and Technology, Xianning, China; Ophthalmology, ZhengzhouSecond Hospital, Zhengzhou, China. ProgramNumber: 5094PosterBoardNumber: B0704 Evaluationof QuantitativePupillometryfor DetectionofIntracranialPressureChangesin HealthyandIdiopathicIntracranial HypertensionSubjects TimothySoeken,AlAlonso,AaronGrant,Eusebia Calvillo,JonathanClark,DoritDonoviel,EricBershad Ophthalmology, SanAntonioUniformed Services HealthEducationConsortium, FortSam Houston, TX; 2Baylor College ofMedicine, Houston, TX ProgramNumber: 5093 PosterBoardNumber: B0703 TheipRGC-DrivenPupilResponsewithLight ExposureinChildren LisaA.Ostrin Optometry, University of HoustonCollege ofOptometry, Houston, TX These all could benefit for example frommachine learning approach instead ofthe normalclinicallinear ROC classifierusing distributions of some simple scalarmeasure NeurOptics https://www.linkedin.com/company /1069098/
- 61. TimeSeriesDeepLearning LSTMFully ConvolutionalNetworksforTime SeriesClassification FazleKarim, SomshubraMajumdar, HoushangDarabi, ShunChen (Submittedon8Sep2017) https://arxiv.org/abs/1709.05206 Timeseriesclassificationfrom scratchwith deepneuralnetworks: Astrongbaseline ZhiguangWang; WeizhongYan; TimOates NeuralNetworks(IJCNN),2017 https://doi.org/10.1109/IJCNN.2017.7966039 ConditionalTimeSeriesForecastingwith ConvolutionalNeuralNetworks AnastasiaBorovykh,Sander Bohte,CornelisW.Oosterlee (Lastrevised16Mar2017) https://arxiv.org/abs/1703.04691 AutoregressiveConvolutionalNeural NetworksforAsynchronousTimeSeries MikolajBinkowski, GautierMarti, PhilippeDonnat (Lastrevised17Aug2017) https://arxiv.org/abs/1703.04122 https://arxiv.org/abs/1703.04122 https://arxiv.org/abs/1703.04691 https://arxiv.org/abs/1709.05206 https://doi.org/10.1109/IJCNN.2017.7966039