Pavement Design Report by priyanshu kumar 9608684800
•
1 like•151 views

Flexible pavement design report

Recommended
More Related Content
What's hot
What's hot (20)
Similar to Pavement Design Report by priyanshu kumar 9608684800
Similar to Pavement Design Report by priyanshu kumar 9608684800 (20)
More from PRIYANSHU KUMAR
More from PRIYANSHU KUMAR (15)
Recently uploaded
Recently uploaded (20)
Pavement Design Report by priyanshu kumar 9608684800
- 1. PAVEMENT DESIGN REPORT Construction of Road Approaches to Rail-Cum-Road Bridge Across River Ganga At Munger Ghat Near Munger, in the State Of Bihar On EPC Mode ii CONTENTS 1. Pavement Design report 1 1.1 General 1 1.2 Design Approach and Methodology 1 1.2.1 Type of Pavement 1 1.2.2 Design Standards 1 1.3 Input Parameters for Pavement Design 1 1.3.1 Design Period and Strategy 1 1.3.2 Design Traffic 1 1.4 Soil Characteristics for OGL Samples 2 1.5 Borrow Area Soil Characteristics for Embankment and Subgrade 3 1.6 Design of New Flexible Pavement 3 1.6.1 Design of Conventional Flexible Pavement for Main Carriageway 4 1.6.2 Design of Conventional Flexible Pavement for Service Road 10 LIST OF TABLES Table 1-1: Design Traffic in Terms of ESAL 2 Table 1-2: Summary of OGL Sample 2 Table 1-3: Input Parameters for IITPAVE of Conventional Pavement 4 Table 1-4: Calculated Conventional Flexible Pavement Thickness for New Construction: 7 Table 1-5: Recommended Pavement Composition for Service Roads 10 LIST OF FIGURES Figure 1-1: IITPAVE INPUT File 5 Figure 1-2: IITPAVE OUTPUT File 6 LIST OF ANNEXURES Annexure 1.1: Detailed Result of test conducted on OGL of soil sample 8 Annexure 1.2: Detailed laboratory test result of borrow area soil sample with 90th percentile CBR calculation 9
- 2. PAVEMENT DESIGN REPORT Construction of Road Approaches to Rail-Cum-Road Bridge Across River Ganga at Munger Ghat Near Munger, in the State of Bihar On EPC Mode 1/10 1. PAVEMENT DESIGN REPORT 1.1 General Pavement design basically aims at determining the total thickness of the pavement structure as well as the thickness of the individual structural components. The approach of the consultant is to work out the required crust thickness by IRC methods. 1.2 Design Approach and Methodology 1.2.1 Type of Pavement For Main Carriageway Flexible Pavement shall be executed as per IRC-37: 2012. 1.2.2 Design Standards The following standards are applicable for new pavement of the project: New Flexible Pavement Design IRC: 37-2012 – “Guidelines for the Design of Flexible Pavements” 1.3 Input Parameters for Pavement Design The performance of pavements is affected by several factors which includes the following factors which are described as below. 1.3.1 Design Period and Strategy As per clause 5.1.1 of Schedule-B “Flexible pavement for new pavements road. Shall be designed for a minimum design period of 15 (Fifteen) years. Stage construction shall not be permitted.” 1.3.2 Design Traffic Design Traffic (Cumulative Number of Standard Axles): The traffic loading in terms of the cumulative number of standard axles for the given period has been computed using the following relationship as given in IRC: 37-2012: 3 6 5 1 1 n r N A D F r Where, N = Cumulative number of standard axles to be catered for the design life in terms of msa. r = Annual growth rate of commercial vehicles n = Design life in years A = Initial traffic in the year of completion of construction in terms of number of commercial vehicles per day exceeding 3 tonnes D = Lane distribution factor F = Vehicle Damage Factor
- 3. PAVEMENT DESIGN REPORT Construction of Road Approaches to Rail-Cum-Road Bridge Across River Ganga at Munger Ghat Near Munger, in the State of Bihar On EPC Mode 2/10 As per schedule Clause 5.1.2 pavement shall be designed for a minimum design traffic of 30 Million Standard Axles. Table 1-1: Design Traffic in Terms of ESAL Sections Design Traffic (MSA) Minimum Design Traffic as per Schedule-B Recommended Design Traffic Munger Km 00+000 to Km 9+394 30 30 Khagaria Km 0+075 to Km 5+198 30 30 1.4 Soil Characteristics for OGL Samples Investigation has been carried out on the test pit samples taken at the following different locations OGL at the toe of embankment. Representative soil sample were collected on 1st August 2019 and samples were tested from 2nd August 2019 to 11th August 2019. The following test have been carried out on each of the samples collected from test pits. a) Atterberg’s Limits – IS:2720 (Part V); b) Modified Proctor Density – IS: 2720 (Part VIII); c) Field Moisture Content – IS:2720 (Part II); d) Four Days Soaked CBR – IS: 2720 (Part XVI); e) Free Swell Index Test – IS: 2720 (Part XI); f) Grain Size Analysis – IS: 2720 (Part IV); g) Soil Classification – IS: 1498. Test Pits at Toe of Embankment (OGL soil) To assess the existing OGL properties, test pits were dug at frequent intervals. Representative samples of OGL were collected from each test pit for laboratory analysis. The results of the test conducted on existing subgrade soil samples have been summarized in Table 1-2. Table 1-2: Summary of OGL Sample Soil Property Average Min Max Liquid Limit (%) - - 40.80 Plastic Limit (%) - - 25.30 Plasticity Index (%) - N.P. 15.50 MDD (gm/cc) 1.93 1.84 2.05 OMC (%) 12.77 11.00 15.30 Soaked CBR (%) 6.18 4.40 9.40 Free Swell Index (%) - NIL 18.20
- 4. PAVEMENT DESIGN REPORT Construction of Road Approaches to Rail-Cum-Road Bridge Across River Ganga at Munger Ghat Near Munger, in the State of Bihar On EPC Mode 3/10 Detailed results of tests conducted on existing subgrade soil sample are presented in Annexure 1. 1.5 Borrow Area Soil Characteristics for Embankment and Subgrade Potential borrow area locations have been identified along the project road for construction of subgrade and embankment and representative samples of identified sources have been collected for laboratory testing. The detailed laboratory investigation has been carried out on borrow area soil samples as per relevant codes & specifications. Following test have been carried out on each of the borrow area soil sample collected; a) Atterberg’s Limits (Liquid Limit and Plastic Limit) – IS:2720 (Part V); b) Modified Proctor Density – IS: 2720 (Part VIII); c) Four Days Soaked CBR – IS: 2720 (Part XVI); d) Free Swell Index Test – IS: 2720 (Part XI); e) Grain Size Analysis – IS: 2720 (Part IV); From the borrow area test results, it has been observed that the borrow area soil is non- plasticity Silty Sand. Laboratory testing indicates that CBR is in the range of 10.29 per cent to 12.94 per cent. Based on the borrow area investigation, it is proposed to use soil only from sources having CBR value of minimum 8 per cent for subgrade construction. Detailed laboratory test result of borrow area samples are given in Annexure 2. Subgrade – Borrow area Soil shall be used to prepare subgrade and embankment soil. Out of the prospective borrow area samples, 90th percentile CBR has been considered as the representative CBR value for borrow area soil, here 90 percentile refers to the CBR value, which is lower than 90% values obtained from results. The detailed calculation for 90th percentile CBR value for borrow area soil has been provided below in Annexure 2. Design CBR Determination for New Construction Stretch: 90th percentile CBR values of Borrow material was found to be 10.35 % which is higher than minimum CBR value required i.e. 8 % as per Clause 5.1 of IRC 37-2012, hence borrow areas are suitable for subgrade and embankment preparation. For the purpose of flexible pavement design, Effective Subgrade CBR of 8 per cent is considered for safe and conservation approach. 1.6 Design of New Flexible Pavement Design of new flexible pavement is applicable for main carriageway sections.
- 5. PAVEMENT DESIGN REPORT Construction of Road Approaches to Rail-Cum-Road Bridge Across River Ganga at Munger Ghat Near Munger, in the State of Bihar On EPC Mode 4/10 1.6.1 Design of Conventional Flexible Pavement for Main Carriageway Specifications and Input parameters as per IRC: 37-2012 In order to provide scientific design thickness ‘Mechanistic–Empirical pavement design’ procedure is followed as directed in IRC: 37-2012. The input parameters used in the design are given in Table 1-3. Table 1-3: Input Parameters for IITPAVE of Conventional Pavement Sl. No. Description Value considered 1 Wheel Configuration Dual Wheel 2 Spacing Between the wheels (mm) 310 3 Load of Single Wheel (N) 20000 4 Tire Pressure (MPa) 0.56 5 Bituminous Layer E-Value (MPa) (DBM and BC layer together) 1700MPa – VG-30 6 Unbound Layers E-Value (MPa) (GSB and WMM together) MR_granular = 0.2*h0.45 MR subgrade = 0.2*4500.45 (66.60) MR_granular = 208.19 (Eq. 7.3 of IRC:37-2012) 7 Subgrade Layer E-value (MPa) MR = 17.6*(CBR)0.64 = 17.6*(8)0.64 MR = 66.60 (Eq. 5.2 IRC:37-2012) 8 Poisson’s Ratio Bituminous Layers: 0.35 WMM/GSB: 0.35 Sub-grade: 0.35 The flexible pavements are designed for two failure models as described in IRC: 37-2012. i) Fatigue Model: Fatigue Model has been calibrated in the R-56 (54) studies using the pavement performance data collected during the R-6 (57) and R-19 (58) studies sponsored by MoRTH; Nf = 2.21 × 10-04 × [ £ ]3.89 × [ ]0.854 …………… Eq 6.1 of IRC:37-2012 Nf = 0.5161 × C × 10-04 × [ £ ]3.89 × [ ]0.854 …………… Eq 6.3 of IRC:37-2012 Where, Nf = Fatigue life in number of standard axles, £t = Maximum Horizontal Tensile strain at the bottom of the bituminous layer Mr = Resilient modulus of the bituminous layer. For design traffic of 30 million standard axel; Eq. 6.1 of IRC: 37-2012 (80 per cent reliability) and resilient modulus of VG-30 grade bitumen at 35°C is 1700 MPa is used for fatigue analysis: 30×106 = 2.21 × 10-04 × [ £ ]3.89 × [ ]0.854 £t = 268.4 × 10⁻⁶ (Allowable/Maximum Horizontal Tensile Strain)
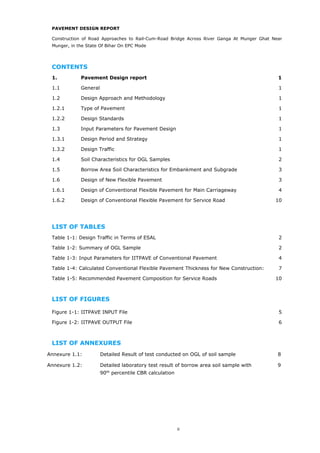
- 6. PAVEMENT DESIGN REPORT Construction of Road Approaches to Rail-Cum-Road Bridge Across River Ganga at Munger Ghat Near Munger, in the State of Bihar On EPC Mode 5/10 ii) Rutting Model: The rutting life of the pavement composition is calculated by using the following equation with the obtained vertical compressive strains at on top of subgrade through IITPAVE. Nr = 4.1656 x 10-08 × [ £ ]4.5337 ……… (Eq. 6.4 of IRC:37-2012) Nr = 1.41 x 10-08 × [ £ ]4.5337 ……… (Eq. 6.5 of IRC:37-2012) Where, Nr = Number of cumulative standard axles, and £v = Maximum Compressive Vertical strain in the subgrade For design traffic of 30 million standard axel; Eq. 6.4 of IRC: 37-2012 (80 per cent reliability) is used for rutting analysis: 30×106 = 4.1656 x 10-08 × [ £ ]4.5337 £v = 528.3 10-6 (Allowable Vertical Compressive Strain) After Allowable strains are obtained, proposed Pavement thickness is evaluated on IIT PAVE software using input parameters specified in Table 1-3 and critical strains are obtained. Details are presented Figure 1-1 & Figure 1-2: Figure 1-1: IITPAVE INPUT File
- 7. PAVEMENT DESIGN REPORT Construction of Road Approaches to Rail-Cum-Road Bridge Across River Ganga at Munger Ghat Near Munger, in the State of Bihar On EPC Mode 6/10 Figure 1-2: IITPAVE OUTPUT File
- 8. PAVEMENT DESIGN REPORT Construction of Road Approaches to Rail-Cum-Road Bridge Across River Ganga at Munger Ghat Near Munger, in the State of Bihar On EPC Mode Table 1-4: Calculated Conventional Flexible Pavement Thickness for New Construction: Carriageway Design Traffic (msa) Allowable Strain Effective Subgrade CBR (%) Calculated Pavement Composition(mm) Elastic Modulus (MPa) of DBM Layers Obtained Strains Remarks Horizontal Tensile Strain (Fatigue) Vertical Compressive Strain (Rutting) BC DBM WMM GSB Horizontal Tensile Strain (Fatigue) Vertical Compressive Strain (Rutting) New construction of Main carriageway from Km 00.000 to Km 9.394 & Km 0.075 to Km 5.198 30 268.48 x10⁻⁶ 528.30 x10⁻⁶ 8.0 40 100 250 200 1700 255 x10-6 359 x10-6 Safe However, Minimum Pavement thickness that contractor shall provide is specified in schedule B clause 5.2. Therefore, Recommended Pavement thickness for the project corridor is: BC 40 mm DBM 105 mm WMM 250 mm GSB 260 mm
- 9. PAVEMENT DESIGN REPORT Construction of Road Approaches to Rail-Cum-Road Bridge Across River Ganga at Munger Ghat Near Munger, in the State of Bihar On EPC Mode Annexure 1 Detailed results of tests conducted on OGL soil sample SieveAnalysis(%) AtterbergLimit Specific Free ModifiedProctorTest SoakedCBR S.NO. Chainage Gravel(%) Sand(%) Silt(%) Clay(%) LiquidLimit(LL) PlasticLimit(PL) PlasticityIndex(PI) Gravity SwellIndexOptimumMoistureContent(OMC)%Max.drydensity(MDD),T/M3at97%MDD MUNGERSIDE 1 0+300 0 5 77 18 35.4 23.1 12.3 2.68 9.1 14.3 1.88 5.4 2 1+450 4 9 77 10 30.2 21.1 9.1 2.66 0 12.6 1.94 6.1 3 2+350 0 4 73 23 39.3 24.9 14.4 2.68 16.7 14.8 1.85 4.9 4 3+200 0 5 72 23 40.1 25.2 14.9 2.68 18.2 15.1 1.85 4.6 5 4+200 0 4 82 14 33.6 22.3 11.3 2.66 0 13.3 1.9 5.7 6 5+300 0 6 85 9 28.4 20.6 7.8 2.66 0 11.9 1.97 6.6 7 6+300 0 7 87 6 24.4 18.8 5.6 2.66 0 11.4 1.99 7.1 8 7+300 0 44 54 2 NonPlastic 2.64 0 9.8 2.05 9.4 9 8+100 0 67 33 0 NonPlastic 2.63 0 11 2.01 8.2 KHAGARIASIDE 10 0+700 0 34 62 4 NonPlastic 2.65 0 11.5 1.98 6.4 11 1+800 0 23 72 5 NonPlastic 2.65 0 12.7 1.93 6.1 12 2+600 0 29 66 5 NonPlastic 2.65 0 12.2 1.95 5.9 13 3+700 0 4 72 24 40.8 25.3 15.5 2.68 18.2 15.3 1.84 4.4 14 4+700 0 19 68 13 34.4 22.6 11.8 2.66 0 13 1.92 5.8
- 10. PAVEMENT DESIGN REPORT Construction of Road Approaches to Rail-Cum-Road Bridge Across River Ganga at Munger Ghat Near Munger, in the State of Bihar On EPC Mode Annexure 2 Detailed laboratory test result of borrow area soil samples with 90th percentile CBR calculation DOS B/A No. Qty Location Lead Testing Date FSI Gravel Sand Silt & Clay LL PL PI MDD gm/cc OMC% CBR% 0 5.3 64.1 30.6 23 NIL NIL 1.925 10.5 11.43 0 8.5 62 29.5 24.2 NIL NIL 1.929 10.4 15/06/2019 0 9 54 37 24.8 NIL NIL 1.941 10 12.26 0 8 55.4 36.6 24.9 NIL NIL 1.928 10.5 0 7 56 37 23.9 NIL NIL 1.933 10.5 10.44 0 9.3 52.5 38.2 25.2 NIL NIL 1.92 9.6 0 6.5 60.8 32.7 23.25 NIL NIL 1.917 10.4 10.97 16/06/2019 0 10 58.4 31.6 23.25 NIL NIL 1.924 10.05 New 0 5 57.4 37.6 24.25 NIL NIL 1.925 10.5 10.29 14/6/2019 1 30000 Ram 5.0 KM 0 8 54.1 37.9 25 NIL NIL 1.965 10.4 CUM Nagar 0 0 63.6 36.4 24.1 NIL NIL 1.911 11.4 10.36 0 4 57.9 38.1 22.75 NIL NIL 1.933 10.6 17/06/2019 0 7.6 55.6 36.8 24 NIL NIL 1.935 10 11.73 0 10 64.9 25.1 24 NIL NIL 1.94 10.2 0 8.8 78.3 12.9 24.9 NIL NIL 1.938 10.2 12.94 0 2 63.8 34.2 27.1 NIL NIL 1.941 10.4 0 5.6 57.4 37 24.9 NIL NIL 1.931 10.8 11.14 18/06/2019 0 7.4 58.8 33.8 24 NIL NIL 1.958 11.2 0 8.2 59.5 32.3 24.1 NIL NIL 1.908 10.05 12.26 0 9.4 60.7 29.26 25.1 NIL NIL 1.918 10.2
- 11. PAVEMENT DESIGN REPORT Construction of Road Approaches to Rail-Cum-Road Bridge Across River Ganga at Munger Ghat Near Munger, in the State of Bihar On EPC Mode 10/10 CBR values for a borrow area samples obtained are as follows: 11.43, 12.6, 10.44, 10.97, 10.29, 10.36, 11.73, 12.94, 11.14, 12.26. Arranging the above values in ascending order 10.29, 10.36, 10.44, 10.97, 11.14, 11.43, 11.73, 12.26, 12.6, 12.94 Calculating percentage greater than equal to each of the values are as follows: For CBR of 10.29, percentage of values greater than equal to 10.29 = (14/14) *100 = 100 For CBR of 10.36, percentage of values greater than equal to 10.36 = (13/14) *100 = 92.8 and so on. Plot between percentage of values greater than equal and the CBR values versus the CBR as follows. The 90th percentile CBR value = 10.353, and 80th percentile CBR value = 10.425 1.6.2 Design of Conventional Flexible Pavement for Service Road Service Roads are designed for design traffic of 10 msa as per clause 5.5.8 of IRC: SP:73-2015 and the pavement thickness are determined from catalogues of IRC: 37-2012 and the same is given in Table 1-5 below: - Table 1-5: Recommended Pavement Composition for Service Roads Design Traffic (msa) Subgrade CBR (%) Recommended Pavement Composition(mm) BC DBM WMM GSB 10 8.0 40 60 250 200 0 20 40 60 80 100 120 0 2 4 6 8 10 12 14 % Equal to greater than Subgrade CBR Evaluation of Subgrade CBR for Pavement Design