Effects of Anthropogenic Activities on the Physicochemical and Microbiological Characteristics of Aba River and Sediment

This study highlighted the pernicious elements present in the sediment and water of Aba River.Upstream and downstream sediment and water samples were collected at four different sampling points along Aba River. The samples were analyzed for the presence of heavy metals. Microbiological analyses were carried out using the spread plate method and bacterial and fungal isolates identified using standard methods. Analyses were carried out to determine the physicochemical properties using standard methods. Results obtained showed the presence of heavy metals in sediment physicochemical parameters in the ranges of turbidity (11.00-15.00NTU), conductivity (1.80-3.09µS/cm), BOD5 (2.10-5.05mg/g), COD (19.50-25.60mg/g), TDS (610-840mg/g), pH (7.20-7.55), temperature (29.00-30.10°C), K (7.16-9.15mg/g), Na (3.53-4.85mg/g), Mg (4.30-5.40 mg/g), Cr (0.04-0.20mg/g), Zn (0.21-0.35mg/g), Fe (3.75-4.42mg/g), Al (1.05-1.25 mg/g), SO42- (11.75-13.11mg/g), PO42- (0.30-1.1 1mg/g), NO3 (6.35-8.16mg/g). Water physicochemical parameters were in the ranges of turbidity (3.30-9.00mg/l), conductivity (0.63-1.80mg/l), BOD5 (1.72-2. 50mg/l), COD (14.39-22.40mg/l), DO (2.95-5.6mg/l), TDS (245-556mg/l), pH (6.90-7.50), temperature (28.50-30.50°C), K (0.001-6.55mg/l), Na (1.25-3.55mg/l), Mg (1.50-4.60mg/l), Cr (0.00-0.15mg/l), Zn (0.01-0.13mg/l), Fe (1.15-3.95mg/l), Al (0.001-1.12mg/l), SO42- (11.75-13.30mg/l), PO42- (0.30-1.11mg/l), NO3 (6.35-8.16mg/l). The mean bacterial counts recorded for the different sampling points were higher in the wet season for sediment samples (0.97-6.00 x 10⁶ cfu/g) than in the dry season (2.15-5.85 x 10⁶ cfu/g), also the mean bacterial counts recorded for water samples were higher in the wet season (1.41-2.95 x 10⁶ cfu/ml) than in the dry season (1.31-2.39 x 10⁶ cfu/ml). The diversity of microorganisms isolated and identified were; Escherichia coli, Klebsiella pneumoniae, Staphylococcus aureus, Salmonella typhi, Shigella dysentariea,, Bacillus cereus, Enterobacter aerogenes, Enterococcus faecalis, Serratia mercences, Micrococcus luteus, Micrococcus roseus, Aspergillus niger, Penicillium notatum, Saccharomyces cerevisae, Fusarium poae, Rhizopus stolonifer, Rhizopus nigricans, Mucor sp. The distribution of these organisms varied between samples, distance and season. The high level of both microorganisms and heavy metals suggest that the anthropogenic activities in the River could cause health menace to users and therefore should be put to check regularly.

Recommended
Recommended
More Related Content
What's hot
What's hot (20)
Similar to Effects of Anthropogenic Activities on the Physicochemical and Microbiological Characteristics of Aba River and Sediment
Similar to Effects of Anthropogenic Activities on the Physicochemical and Microbiological Characteristics of Aba River and Sediment (20)
More from Associate Professor in VSB Coimbatore
More from Associate Professor in VSB Coimbatore (20)
Recently uploaded
Recently uploaded (20)
Effects of Anthropogenic Activities on the Physicochemical and Microbiological Characteristics of Aba River and Sediment
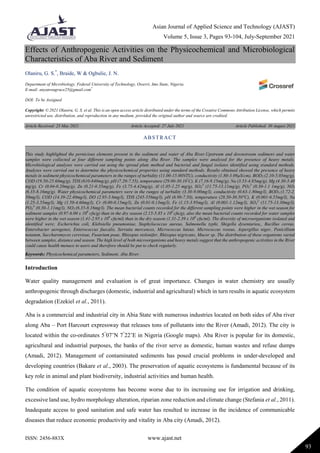
- 1. Asian Journal of Applied Science and Technology (AJAST) Volume 5, Issue 3, Pages 93-104, July-September 2021 ISSN: 2456-883X www.ajast.net 93 Effects of Anthropogenic Activities on the Physicochemical and Microbiological Characteristics of Aba River and Sediment Olaniru, G. S.* , Braide, W & Ogbulie, J. N. Department of Microbiology, Federal University of Technology, Owerri, Imo State, Nigeria. E-mail: anyanwugrace25@gmail.com* DOI: To be Assigned Copyright: © 2021 Olaniru, G. S. et al. This is an open access article distributed under the terms of the Creative Commons Attribution License, which permits unrestricted use, distribution, and reproduction in any medium, provided the original author and source are credited. Article Received: 25 May 2021 Article Accepted: 27 July 2021 Article Published: 30 August 2021 Introduction Water quality management and evaluation is of great importance. Changes in water chemistry are usually anthropogenic through discharges (domestic, industrial and agricultural) which in turn results in aquatic ecosystem degradation (Ezekiel et al., 2011). Aba is a commercial and industrial city in Abia State with numerous industries located on both sides of Aba river along Aba – Port Harcourt expressway that releases tons of pollutants into the River (Amadi, 2012). The city is located within the co-ordinates 5° 07’N 7° 22’E in Nigeria (Google maps). Aba River is popular for its domestic, agricultural and industrial purposes, the banks of the river serve as domestic, human wastes and refuse dumps (Amadi, 2012). Management of contaminated sediments has posed crucial problems in under-developed and developing countries (Bakare et al., 2003). The preservation of aquatic ecosystems is fundamental because of its key role in animal and plant biodiversity, industrial activities and human health. The condition of aquatic ecosystems has become worse due to its increasing use for irrigation and drinking, excessive land use, hydro morphology alteration, riparian zone reduction and climate change (Stefania et al., 2011). Inadequate access to good sanitation and safe water has resulted to increase in the incidence of communicable diseases that reduce economic productivity and vitality in Aba city (Amadi, 2012). ABSTRACT This study highlighted the pernicious elements present in the sediment and water of Aba River.Upstream and downstream sediment and water samples were collected at four different sampling points along Aba River. The samples were analyzed for the presence of heavy metals. Microbiological analyses were carried out using the spread plate method and bacterial and fungal isolates identified using standard methods. Analyses were carried out to determine the physicochemical properties using standard methods. Results obtained showed the presence of heavy metals in sediment physicochemical parameters in the ranges of turbidity (11.00-15.00NTU), conductivity (1.80-3.09µS/cm), BOD5 (2.10-5.05mg/g), COD (19.50-25.60mg/g), TDS (610-840mg/g), pH (7.20-7.55), temperature (29.00-30.10° C), K (7.16-9.15mg/g), Na (3.53-4.85mg/g), Mg (4.30-5.40 mg/g), Cr (0.04-0.20mg/g), Zn (0.21-0.35mg/g), Fe (3.75-4.42mg/g), Al (1.05-1.25 mg/g), SO4 2- (11.75-13.11mg/g), PO4 2- (0.30-1.1 1mg/g), NO3 (6.35-8.16mg/g). Water physicochemical parameters were in the ranges of turbidity (3.30-9.00mg/l), conductivity (0.63-1.80mg/l), BOD5 (1.72-2. 50mg/l), COD (14.39-22.40mg/l), DO (2.95-5.6mg/l), TDS (245-556mg/l), pH (6.90-7.50), temperature (28.50-30.50°C), K (0.001-6.55mg/l), Na (1.25-3.55mg/l), Mg (1.50-4.60mg/l), Cr (0.00-0.15mg/l), Zn (0.01-0.13mg/l), Fe (1.15-3.95mg/l), Al (0.001-1.12mg/l), SO4 2- (11.75-13.30mg/l), PO4 2- (0.30-1.11mg/l), NO3 (6.35-8.16mg/l). The mean bacterial counts recorded for the different sampling points were higher in the wet season for sediment samples (0.97-6.00 x 10⁶ cfu/g) than in the dry season (2.15-5.85 x 10⁶ cfu/g), also the mean bacterial counts recorded for water samples were higher in the wet season (1.41-2.95 x 10⁶ cfu/ml) than in the dry season (1.31-2.39 x 10⁶ cfu/ml). The diversity of microorganisms isolated and identified were; Escherichia coli, Klebsiella pneumoniae, Staphylococcus aureus, Salmonella typhi, Shigella dysentariea,, Bacillus cereus, Enterobacter aerogenes, Enterococcus faecalis, Serratia mercences, Micrococcus luteus, Micrococcus roseus, Aspergillus niger, Penicillium notatum, Saccharomyces cerevisae, Fusarium poae, Rhizopus stolonifer, Rhizopus nigricans, Mucor sp. The distribution of these organisms varied between samples, distance and season. The high level of both microorganisms and heavy metals suggest that the anthropogenic activities in the River could cause health menace to users and therefore should be put to check regularly. Keywords: Physicochemical parameters, Sediment, Aba River.
- 2. Asian Journal of Applied Science and Technology (AJAST) Volume 5, Issue 3, Pages 93-104, July-September 2021 ISSN: 2456-883X www.ajast.net 94 Municipal waste contains substantial amounts of toxic chemicals that affect water quality, aquatic resources and food quality. The persistence dumping of waste and refuse into the river could cause health menace (Adeyemo et al., 2008; Olaitan et al., 2013). Urban rural runoff remains pollution problems for rivers today in Nigeria (Olorede et al., 2015). Ahem et al. (2005) had reported on the water quality variables that negatively impact on human health. This study reports the effects of anthropometric activities on the physicochemical and microbiological characteristics of Aba River and sediment. Materials and Methods Questionnaire Administration The instrument for data collection was a structured questionnaire designed to obtain relevant information from the inhabitant of Aba, especially those living close to the river banks. The first section sought information on the socio-demographic characteristics of the respondents. The second section dealt with the knowledge and attitude of respondents towards the river and for the purpose of obtaining information on the consumption/ usage of the river water for domestic, industrial and irrigation purposes. The questionnaire was validated before administering to respondents. The questionnaires were self-administered, completed on the spot by the respondents and collected back on the spot. Sample Location and Collection The river is located within the co-ordinates 5°07’N 7°22’E Aba North, Abia State in South Eastern Nigeria. Water samples were collected at four different sampling points at 100 meters apart in both wet and dry seasons. Fig.1. Map showing Aba River (Google maps) Water samples were collected aseptically into presterilized bijou bottles for microbiological analysis and a clean one liter (1 L) polyethylene bottles for physicochemical analysis. The samples were collected between the hours of 8.00 am and10.00 am.
- 3. Asian Journal of Applied Science and Technology (AJAST) Volume 5, Issue 3, Pages 93-104, July-September 2021 ISSN: 2456-883X www.ajast.net 95 The sediment samples were collected at four different sampling points aseptically by pinning a sterile long pipe of 3 cm diameter into the sediment to catch the sediment. Sediment samples were placed into sterile wide mouth bottles, labeled accordingly and was then transported immediately to the laboratory for analysis. Water and sediment samples collected from Agbama River in Umuahia, Abia state was used as control. All samples were transported in an ice chest and analysed immediately prior to treatment Microbiological Analysis of Water and Sediment Samples The water and sediment samples were serially diluted in a tenfold serial dilution and plated out in duplicates using the spread plate technique on Nutrient Agar, Eosine Methylene Blue Agar, Potato Dextrose Agar, Mannitol Salt Agar, MacConkey Agar and Salmonella Shigella Agar. Inoculated culture plates were incubated at room temperature for 24-48 hours. The viable plate count was determined as colony forming unit per ml (cfu/ml) and colony forming unit per gram (cfu/g) for water and sediment samples respectively (Harrigan and McCance, 1987). Bacterial and fungal isolates were characterized and identified by the methods of Cheesbrough (2000), Buchanan and Gibbon (2000), Barnett and Hinter (1987) and Sharma (2000). Statistical analysis Statistical analysis was carried out using Statistical Package for Social Sciences (SPSS) version 20. Descriptive statistics (frequency and percentage) was used to compute data on sociodemographic characteristics and usage/knowledge pattern of the River by Respondents. Mean (SD) was computed for the microbial load (colony counts) of water and sediment samples for both wet and dry seasons in cfu/ml and cfu/g respectively. T-test was used to determine the difference between the physiochemical parameters of water and sediment. T-test was also used to determine the difference between the microbial load of water and sediment. microbial counts (cfu/ml and cfu/g) were represented as log 10 cfu/ml and cfu/g then subjected to comparative analysis using Analysis of Variance (ANOVA) to determine the Microbial load at the four different sampling points in both rainy and dry seasons for sediment and water samples while Duncan Multiple Range Test (DMRT) was used to test for the means that are significantly different from the other, which are presented by alphabets in superscripts in the tables presented for physicochemical analysis. A P value of less than 0.05 (P<0.05) at 95% confidence interval was regarded as statistically significant. Results Table 1. Attitude and usage of the river by inhabitants Parameter/Usage Frequency (n) Percentage (%) Bathing purposes 2 1.6 Car washing 19 15 Cloth washing 6 4.8 Concrete Mixing 34 27 Not use for any purpose 65 51.6 Total 126 100
- 4. Asian Journal of Applied Science and Technology (AJAST) Volume 5, Issue 3, Pages 93-104, July-September 2021 ISSN: 2456-883X www.ajast.net 96 Table 2. Frequency of waste and refuse dump into the river in a week by respondents Parameters Frequency Percentage (%) Once 9 7.1 Twice 17 13.5 Thrice 25 19.8 >Thrice 54 42.9 No response 21 16.7 Total 126 100 Table 1 show that 51.6% of respondents do not use the river water for any purpose, probably due to physical characteristics of the river in terms of colour and odour. 42.9% of the respondents’ dumps waste into the river more than three times on weekly whereas 19.8% dumps waste three times a week. The frequency of municipal refuse and waste dump contributes a lot to the contamination level of the river (Table 2). Table 3. Comparison of the total mean viable count of organisms for sediment samples in both wet and dry seasons (x 106 cfu/g) Microbiological Properties Wet season Mean ±SD Dry season Mean ±SD t- value (p-value) THBC 1.52±0.22 5.85±4.00 -2.18 (0.12) TCC 6.00±1.06 3.13±1.83 2.72 (0.04) THFC 1.73±0.53 2.52±1.30 -1.14 (0.30) TEC 2.48±0.35 2.15±0.22 1.57 (0.17) TBMSA 0.97±0.60 5.76±3.70 -2.55 (0.04) TBSSA 4.28±4.69 2.78±1.41 0.61 (0.58) Values are means±standard deviation of duplicate samples Keys: THBC = Total Heterotrophic Bacterial Count, THFC = Total Heterotrophic Fungal Count, TEC = Total Enterobacteriaceae Count, TCC = Total Coliform Count, TBMSA = Total Bacteria on Mannitol Salt Agar, TBSSA = Total Bacteria on Salmonella Shigella Agar. The mean Total Heterotrophic Bacterial Count, Total Heterotrophic Fungal Count, Total Enterobacteriacea Count and Total Bacterial on Salmonella Shigella Agar were not significantly different in both wet and dry seasons (p>0.05). The mean Total Coliform Count of sediment sample (6.00x10⁶ ) during wet season is significantly higher (p<0.05) than in the dry season (3.13x10⁶ ).
- 5. Asian Journal of Applied Science and Technology (AJAST) Volume 5, Issue 3, Pages 93-104, July-September 2021 ISSN: 2456-883X www.ajast.net 97 The mean Total Bacterial Count on Mannitol Salt Agar during the dry season (5.76x10⁶ ) is significantly higher (p-value 0.04) than in the wet season (Table 3). Table 4. Comparative analysis of the mean total viable count of organisms for water samples in wet and dry seasons (cfu/ml) X 106 Microbiological Property Wet season Mean ±SD Dry season Mean ±SD t- value (p-value) THBC 2.95±0.18 2.39±0.36 3.15 (0.05) TCC 2.06±0.06 1.81±0.17 2.77 (0.03) THFC 2.03±0.76 1.95±0.21 0.20 (0.86) TEC 2.48±0.35 2.15±0.21 1.57 (0.17) TBMSA 1.41±0.48 1.31±0.85 0.19 (0.85) TBSSA 1.72±0.37 1.83±0.26 -0.48(0.65) Values are means ± standard deviation of duplicate samples Keys: THBC = Total Heterotrophic Bacterial Count, THFC = Total Heterotrophic Fungal Count, TEC = Total Enterobacteriaceae Count, TCC = Total Coliform Count, TBMSA = Total Bacteria on Mannitol Salt Agar, TBSSA = Total Bacteria on Salmonella Shigella Agar. The mean Total Heterotrophic Bacterial Count and the mean Total Coliform Count of water samples were both significantly higher during the wet season (p<0.05). The mean Total Heterotrophic Fungal Count, Total Enterobacteriacea Count, Total Bacterial Count on Mannitol Salt Agar and Total Bacterial Count on Salmonella Shigella Agar of water samples were not significantly different in both wet and dry seasons (p>0.05) (Table 4). Table 5. Comparison of the total mean bacterial and fungal count of sediment and water samples during the wet season (x 106 ) Microbiological Properties Sediment sample Mean ±SD Water sample Mean ±SD t- value (p-value) THBC 1.52±0.22 3.00±0.02 -13.27 (0.00) TCC 6.00±1.06 2.06±0.06 7.43 (0.01) THFC 1.73±0.53 2.03±0.76 -0.65 (0.54) TEC 2.48±0.35 2.47±0.35 1.00 (1.00) TBMSA 0.97±0.60 1.40±0.48 -1.13 (0.30) TBSSA 4.28±4.69 1.72±0.37 1.01 (0.36) Values are means±standard deviation of duplicate samples
- 6. Asian Journal of Applied Science and Technology (AJAST) Volume 5, Issue 3, Pages 93-104, July-September 2021 ISSN: 2456-883X www.ajast.net 98 Keys: THBC = Total Heterotrophic Bacterial Count, THFC = Total Heterotrophic Fungal Count, TEC = Total Enterobacteriaceae Count, TCC = Total Coliform Count, TBMSA = Total Bacteria on Mannitol Salt Agar, TBSSA = Total Bacteria on Salmonella Shigella Agar. In the wet season, the mean Total Heterotrophic Bacterial Count and the mean Total Coliform Count of were both significantly higher for sediment and water samples (p<0.05). The mean Total Heterotrophic Fungal Count, Total Enterobacteriacea Count, Total Bacteria Count on Mannitol Salt Agar and Total Bacteria Count on Salmonella Shigella Agar were not significantly different for water and sediment samples (p>0.05) (Table 5). Table 6. Comparison of Sediment Microbial Load from Point A-Point D (x106 Cfu/g) Sample THBC Mean ± SD TCC Mean ± SD THFC Mean ± SD TEC Mean ± SD TBMSA Mean ±SD TBSSA Mean ± SD SITE A 0.80 ± 0.98 4.90 ± 1.83 2.15 ± 0.21 2.18 ± 0.08 0.58 ± 0.60 5.7 ± 5.16 SITE B 5.21 ± 5.64 6.40 ± 1.41 1.25 ± 0.35 2.49 ± 0.35 5.26 ± 5.58 6.00 ± 1.56 SITE C 4.30 ± 3.68 3.90 ± 2.12 2.10 ± 1.41 2.61 ± 0.32 2.81 ± 2.67 1.25 ± 1.20 SITE D 4.43 ± 3.91 3.05 ± 2.76 3.00 ± 1.41 2.00 ± 0.18 4.81 ± 4.66 1.10 ± 1.27 Control Site 3.67 ± 0.06 2.40 ± 0.02 0.62 ± 0.04 1.35± 0.02 2.17 ± 0.01 0.50 ± 0.02 p-value 0.70 0.50 0.49 0.21 0.65 0.21 Values are means ± standard deviation of duplicate samples Keys: THBC = Total Heterotrophic Bacterial Count, THFC = Total Heterotrophic Fungal Count, TEC = Total Enterobacteriaceae Count, TCC = Total Coliform Count, TBMSA = Total Bacteria on Mannitol Salt Agar, TBSSA = Total Bacteria on Salmonella Shigella Agar. No significant different was obtained among the four different sampling points for sediment sample (p> 0.05) in both dry and wet seasons (Table 6). Table 7. Comparison of water microbial load from Point A – Point D (x 107 Cfu/ml) Sample THBC Mean ± SD TCC Mean ± SD THFC Mean ± SD TEC Mean ± SD TBMSA Mean ± SD TBSSA Mean ± SD SITE A 2.73 ± 0.28 1.78 ± 0.31 1.59 ± 0.12 2.18 ± 0.78 1.15 ± 0.71 1.66 ± 0.56 SITE B 2.71 ± 0.31 2.00 ± 0.15 2.20 ± 0.10 2.49 ± 0.35 0.76 ± 0.80 1.87 ± 0.10 SITE C 2.82 ± 0.21 2.02 ± 0.15 2.54 ± 0.66 2.61 ± 0.32 2.10 ± 0.00 2.01 ± 0.20 SITE D 2.42 ± 0.78 2.00 ± 0.10 1.63 ± 0.40 1.91 ± 0.17 1.43 ± 0.59 1.56 ± 0.15 Control Site 2.00 ± 0.03 1.15 ± 0.02 0.60 ± 0.02 0.78 ± 0.41 1.05 ± 0.36 1.10± 0.15 p-value 0.83 0.64 0.18 0.21 0.20 0.52 Values are means ± standard deviation of duplicate samples
- 7. Asian Journal of Applied Science and Technology (AJAST) Volume 5, Issue 3, Pages 93-104, July-September 2021 ISSN: 2456-883X www.ajast.net 99 Keys: THBC = Total Heterotrophic Bacterial Count, THFC = Total Heterotrophic Fungal Count, TEC = Total Enterobacteriaceae Count, TCC = Total Coliform Count, TBMSA = Total Bacteria on Mannitol Salt Agar, TBSSA = Total Bacteria on Salmonella Shigella Agar. There was no significant difference among the four sites in water sample (Table 7). Table 8a. Physicochemical properties of sediment sample from site A-site D Parameter Site A Mean±SD Site B Mean±SD Site C Mean±SD Site D Mean±SD Control site Mean±SD F- value (p-value) Turbidity (NTV) 14.10a ±1.56 14.00a ±1.41 14.30a ±1.41 15.00a ±1.41 11.00±0.98 0.19 (0.90) Conductivity (µS/cm) 3.00a ±0.00 3.05a ±0.07 3.09a ±0.07 3.00a ±0.07 1.8±0.02 1.52 (0.34) pH 7.35a ±0.07 7.35a ±0.07 7.55a ±0.07 7.40a ±0.14 7.20±0.05 2.05 (0.25) Temperature (o C) 30.10a ±0.07 29.60a ±0.71 30.10a ±0.01 29.10a ±0.14 29.00±0.01 3.00 (0.16) BOD5 (mg/g) 2.11b ±0.01 2.13b ±0.04 2.32a ±0.02 2.10b ±0.00 5.05±0.08 36.56 (0.02) COD (mg/g) 25.00a ±1.41 25.60a ±2.12 25.60a ±2.12 25.4a ±1.41 19.50±0.04 0.05 (3.00) TDS (mg/g) 820a ±14.14 815a ±21.12 830a ±0.00 840a ±0.00 610±0.00 1.51 (0.34) Values are means ± standard deviation of duplicate samples a-c means with similar superscripts in the same row are not significantly different P>0.05 Keys: BOD=Biochemical Oxygen Demand, COD=Chemical Oxygen Demand, DO= Dissolved Oxygen, TDS= Total Dissolved Solids. Table 8a show that BOD5 was significant difference along the different sampling points as P< 0.05, Turbidity, Conductivity, pH, Temperature, COD and TDS were not significantly different as P-Value >0.05 for sediment samples. Table 8b. Physicochemical properties of sediment sample from site A-site D (contd) Parameter Site A Mean±SD Site B Mean±SD Site C Mean±SD Site D Mean±SD Control site Mean±SD F- value (P-value) Sulphate (mg/g) 13.11a ±1.41 13.3a ±0. 12.39a ±0.35 12.40a ±0.28 11.75 ± 0.08 0.75 (0.58) Nitrite (mg/g) 8.16a ±0.00 7.00a ±0.00 7.69a ±0.00 8.00a ±0.00 6.35 ± 0.45 0.00 (0.00) Phosphate (mg/g) 1.00b ±0.00 1.11a ±0.00 0.94b ±0.06 1.00b ±0.00 0.30 ± 0.01 11.82 (0.02) Sodium (mg/g) 3.55a ±0.07 3.53a ±0.04 3.61a ±0.07 3.60a ±0.07 4. 85 ± 0.37 0.71 (0.60) Zinc (mg/g) 0.21a ±0.07 0.24a ±0.07 0.23a ±0.07 0.23a ±0.07 0. 35 ± 0.02 0.06 (1.00) Chromium (mg/g) 0.20a ±0.00 0.20a ±0.00 0.20a ±0.00 0.20a ±0.00 0.04 ± 0.35 0.00 (0.00) Potassium (mg/g) 9.13a ±0.66 9.15a ±0.64 8.78a ±0.16 8.81a ±0.13 7.16 ± 0.48 0.36 (0.79)
- 8. Asian Journal of Applied Science and Technology (AJAST) Volume 5, Issue 3, Pages 93-104, July-September 2021 ISSN: 2456-883X www.ajast.net 100 Iron (mg/g) 4.36a ±0.35 4.39a ±0.33 4.42a ±0.34 4.36a ±0.35 3.75 ± 0.65 0.02 (1.00) Aluminium (mg/g) 1.05a ±0.07 1.17a ±0.28 1.19a ±0.02 1.10a ±0.15 1.25 ± 0.34 1.21 (0.41) Magnesium (mg/g) 5.33a ±0.47 5.40a ±0.71 5.37a ±0.52 5.33a ±0.47 4.30 ± 0.20 0.01 (1.00) Values are means ± standard deviation of duplicate samples a-c means with similar superscripts in the same row are not significantly different P>0.05 Nitrite, Phosphate and Chromium were significantly different along the sampling points as P-value<0.05. Sulphate, Sodium, Zinc, Potassium, Iron, Aluminium and Magnesium were not significantly different for sediment sample, Table 8b. Table 9a. Physicochemical properties of water sample from site A-site D Parameter Site A Mean±SD Site B Mean±SD Site C Mean±SD Site D Mean±SD Control site Mean±SD F- value (P-value) Turbidity (NTV) 7.22ab ±0.71 9.00a ±0.78 7.80a ±0.14 5.90b ±0.71 3.50±0.03 8.17 (0.04) Conductivity (µS/cm) 1.23a ±0.81 0.63a ±0.74 1.58a ±0.18 1.70a ±0.07 1.80 ± 0.48 1.48 (0.35) pH 6.35a ±0.21 6.55a ±0.35 6.75a ±0.50 6.90a ±0.00 7.50 ± 0.05 1.10 (0.45) Temperature (o C) 28.50b ±0.71 30.50a ±0.71 30.50a ±0.71 29.50ab ±0.35 29.00 ± 0.45 4.80 (0.08) BOD5(mg/l) 1.72ab ±0.07 1.88a ±0.14 1.75a ±0.06 1.49b ±0.01 2.50 ± 0.25 7.17 (0.04) COD(mg/l) 18.35b ±0.78 22.4a ±0.76 21.60a ±1.41 16.17b ±1.41 14. 39 ± 0.36 12.5 (0.02) DO(mg/l) 5.00a ±0.71 2.95b ±0.07 3.15b ±0.14 3.85ab ±0.85 5.6±0.02 10.51(0.07) TDS(mg/l) 454b ±28.28 556a ±30.40 527a ±26.87 505ab ±21.12 245 ± 50.45 6.14 (0.06) Values are means ± standard deviation of duplicate samples a-c means with similar superscripts in the same row are not significantly different P>0.05 Keys: BOD=Biochemical Oxygen Demand, COD=Chemical Oxygen Demand, DO= Dissolved Oxygen, TDS= Total Dissolved Solids. Table 9a show that Turbidity, BOD5 and COD were significantly different for water sample along the sampling site A-D as P-Value<0.05. Conductivity, pH, DO and TDS were not significantly different, P-value>0.05.
- 9. Asian Journal of Applied Science and Technology (AJAST) Volume 5, Issue 3, Pages 93-104, July-September 2021 ISSN: 2456-883X www.ajast.net 101 Table 9b. Physiochemical properties of water sample from site A-site D (contd) Parameter Site A Mean±SD Site B Mean±SD Site C Mean±SD Site D Mean±SD Control site Mean±SD F- value (P-value) Standard Value Sulphate (mg/l) 8.76a ±3.11 7.89a ±1.41 9.65a ±1.63 7.50a ±0.57 1.50±0.02 0.50 (0.70) 250 Nitrite (mg/l) 3.50a ±0.71 5.65a ±1.56 3.60a ±0.42 3.45a ±0.14 1.20±0.07 2.93 (0.16) <0.001 Phosphate (mg/l) 0.09a ±0.08 0.10a ±0.07 0.06a ±0.64 0.02a ±0.00 0.09±0.01 0.65 (0.62) >1.0 Sodium (mg/l) 3.50a ±0.06 2.50c ±0.00 2.75b ±0.00 3.55a ±0.00 1.25±0.107 51.95 (0.00) 30-60 Zinc (mg/l) 0.02c ±0.01 0.13a ±0.04 0.08ab ±0.00 0.05bc ±0.00 0.01±0.00 13.39 (0.02) <3.0 Chromium (mg/l) 0.15a ±0.00 0.15a ±0.06 0.10a ±0.01 0.10a ±0.00 0.00±0.00 1.42 (0.36) <0.05 Potassium (mg/l) 2.43b ±0.04 3.50ab ±0.07 6.55a ±2.76 3.80ab ±0.00 0.001±0.00 3.24 (0.14) <10 Iron (mg/l) 1.35d ±0.07 3.40c ±0.07 3.95a ±0.00 3.75b ±0.00 1.15±0.01 11.83 (0.00) <0.3 Aluminium (mg/l) 0.02b ±0.01 1.04a ±0.06 1.12a ±0.35 0.10b ±0.01 0.001±0.01 599.7 (0.00) <0.4 Magnesium (mg/l) 4.10b ±0.00 4.60a ±0.28 4.23ab ±0.04 4.20ab ±0.07 1.50±.004 4.46 (0.09) 50 Values are means ± standard deviation of duplicate samples a-d means with similar superscripts in the same row are not significantly different P>0.05 Sodium, Zinc, Iron and Aluminium were significantly different for water samples as P-value<0.05, while Sulphate, Nitritte, Phpsphate, Chromium, Potassium and Magnesium were not largely different as P-value>0.05, Table 9b. Discussions Effluent and municipal wastes discharged from industries located along Aba River altered the biophysical, chemical and ecological characteristics of the river renders it unfit for any purpose, be it industrial, domestic nor irrigation purposes. About 42.9% of the respondents’ dumps waste or refuse into the river more than three times on weekly basis which was followed by 19.8% which dumps refuse or waste three times a week. The frequency of
- 10. Asian Journal of Applied Science and Technology (AJAST) Volume 5, Issue 3, Pages 93-104, July-September 2021 ISSN: 2456-883X www.ajast.net 102 dumping of refuse and waste is probably due to lack of waste disposal system. The frequency of municipal refuse and waste dump contributes a lot to the contamination level of the river (Amadi, 2012). The result of the microbiological analysis of sediment samples of Aba River from four sites A to D shows that the mean Total Coliform Count of the sediment samples during the wet season is significantly higher than that obtained during the dry season, the reason being that coliforms proliferate more in an aerobic environment according to Priya (2009). In addition to the mean Total Coliform Count as indicated in sediment sample, the mean Total Heterotrophic Bacterial Count of water sample was significantly higher during the wet season. During the wet season there is an influx of organic nutrient from urban runoffs that increased the proliferation of pathogenic organisms (Olorede, et al, 2015). The mean Total Coliform Count of sediment samples was significantly higher than water sample. This is as a result of the fact that most coliforms are aerobic and falcultative anaerobeic (Cheesbrough, 2010). The fungal isolates from Potato Dextrose Agar was higher during the wet season than in the dry season as reported by Amadi (2012). Statistically, Analysis of variance (ANOVA) (p≤0.05) there is significant spatial variations in the concentrations of the physicochemical parameters. The pH values for sediment sample was little above neutral, indicating that the sediment is slightly alkaline as was reported by Chukwujindu et al. (2007). The pH value for water sample is a little below neutral but still fell within the acceptable level. Total suspended solids (TDS) refer to the filterable particles in water which may be of organic or inorganic sources. They are largely affected by depth, turbulence, run-offs and sediment load generated by the flow dynamics of aquatic systems. Suspended solids in water apart from having an unsatisfactory aesthetic value also affects light transmittance and the heat capacity of the system. The amount of solid in suspension also affects the rate of oxygen dissolution and the feeding habit intensities of organisms Olorede et al (2015). Man’s activities such as bathing, washing, excreting, urinating etc may be contributing factors to the highest values obtained on total dissolved solid both in wet and dry seasons. The amount of sulphate present in an ecosystem determined by the amount of oxygen in the water body. The mean bacterial counts recorded for the different sites were higher in the wet season for sediment samples (0.97- 6.00 x 10⁶ cfu/g) than in the dry season (2.15-5.85 x 10⁶ cfu/g). Also the mean bacterial counts recorded for water samples were higher in the wet season (1.41-2.95 x 10⁶ cfu/ml) than those recorded in the dry season (1.31-2.39 x 10⁶ cfu/ml) Conclusion Bacteriological analysis of the water and sediments samples revealed varying levels of THBC and other bacterial genera of public health concern such as Echerichia coli, Staphylococcus aureus, Salmonella typhi, Klebsiella pneumonia and Shigella dysentariea. The isolates exhibit seasonality with the organisms occurring less in the dry season and more in the wet season. It is evident that municipal waste and refuse contaminated the water of Aba River causing unfavorable changes in the physicochemical parameters. Most of the values recorded were far higher when compared to World Health Organization (WHO) standard values. The higher bacterial and fungal counts could be attributed to the effects of not only industrial effluents but also municipal waste and refuse. More so, the wet season samples recorded higher mean bacterial counts than the dry season for all the sampling sites. The identification and detection of microbial contaminants in water should be a priority concern for assessing the risks
- 11. Asian Journal of Applied Science and Technology (AJAST) Volume 5, Issue 3, Pages 93-104, July-September 2021 ISSN: 2456-883X www.ajast.net 103 from/ and managing the microbial quality of water bodies. In drinking water supplies the essential information needs for quantitative microbial risk assessment can be applied to detecting, identifying, and characterizing microbial contaminants. The recognition of new waterborne pathogens as well as re-emerging ones posing increased risks due to newly acquired virulence properties and other traits requires further improvement of waterborne pathogen detection methods and better use of the advanced analytical methods now available. The result concluded that in addition to effluent discharge from industries located along Aba River which altered the biophysical, chemical and ecological characteristics of the river, municipal waste dumped into the river on daily basis also contribute, thereby rendering the water impotent for domestic, agricultural and industrial use. Declarations Source of Funding This research did not receive any grant from funding agencies in the public, commercial, or not-for-profit sectors. Competing Interests Statement The authors declare no competing financial, professional and personal interests. Ethical Approval Ethical approval for this research was based on institutional guidelines. Consent for publication Authors declare that they consented for the publication of this research work. Availability of data and material Authors are willing to share the data and material according to relevant needs. References Adeyemo, O.K., Adedokun, Yusuf, R. K and Adeleye, E. A. (2008). Seasonal Changes in Physico- Chemical Parameters and Nutrient Load of River Sediments in Ibadan City, Nigeria.pp.44-49. Amadi, Akobundu .N. (2012). Quality Assessment of Aba River using heavy metal Pollution index, American Journal of Environmental Engineering, 2(1): 45-49. Bakare, A.A, Lateef A, Amuda, O.S and Afolabi, R.O. (2003). The aquatic toxicity and characterization of chemical and microbiological constituents of water samples from Oba River, Odo-oba, Nigeria. Asian Journal of Microbiology, Biotechnology and Environmental Science, 5:11-17. Buchanan, R. E and Gibbon, N. E (2000). Berger’s Manual Determinative Bacteriology, 12th Edition. Williams and Wilkins Company, Baltimore, USA. Cheesbrough, M. (2010). District Laboratory Practice in Tropical Countries. 2nd Edition, Part 2. Cambrigde University Press, Cape Town, South Africa. pp. 62-185.
- 12. Asian Journal of Applied Science and Technology (AJAST) Volume 5, Issue 3, Pages 93-104, July-September 2021 ISSN: 2456-883X www.ajast.net 104 Chukwujindu, M. A. I., Godwin, E. N and Francis. O. A. (2007). Assessment of contaminated by heavy metals in sediments of Ase River, Niger Delta, Nigeria. Research Journal of Environmental Science, 1: 220-228. Ezekiel, E. N., Hart, A. I and Abowei, J. F. N. (2011).The Sediment Physical and Chemical Characteristics in Sombreiro River, Niger Delta, Nigeria. Research Journal of Environmental and Earth Sciences. 3(4): 341-349. Olaitan, O. J., Kenneth, N., Elijah, M., Mestura, A., Kasim, L. S and Daodu, J. O. (2013). Concentration of Heavy Metals in Five Pharmaceutical Effluents in Ogun State, Nigeria. Bulletin of Environment, Pharmacology and Life Sciences, 2(8): 84-90. Olorode, O.A., Bamigbola, E. A and Ogba, O.M. (2015). Comparative Studies of some river Waters in Port Harcourt based on their Physico - Chemical and Microbiological analysis, Niger Delta Region of Nigeria. International Journal of Basic and Applied Science, 3(3): 29-37. Priya, M. B. (2009). Microbial analysis of soil and water sample from Koel River in Rourkela, Odisha., pp.17-23. Sharma, K. (2000). Manual of Microbiology Tools and Techniques, 2nd Edition. Ane Books Pvt., Limited, New Delhi, India.