SlideShare a Scribd company logo
1 of 2
Navratan sharma PG Com.SMPS
Practice with APC, APS, MPC and MPS
Average Propensities PartA
The average propensityto consume (APC) is the ratio of consumptionexpenditures(C) to Y income
(Y),or APC = C / Y
The average propensityto save (APS) isthe ratio of savings (S) to disposable income,orAPS = S / Y
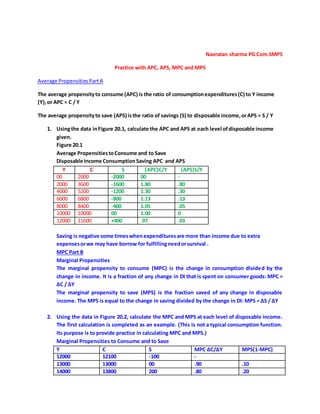
1. Usingthe data inFigure 20.1, calculate the APC and APS at each level ofdisposable income
given.
Figure 20.1
Average PropensitiestoConsume and to Save
Disposable Income ConsumptionSaving APC and APS
Y C S (APC)C/Y (APS)S/Y
00 2000 -2000 00 -
2000 3600 -1600 1.80 .80
4000 5200 -1200 1.30 .30
6000 6800 -800 1.13 .13
8000 8400 -400 1.05 .05
10000 10000 00 1.00 0
12000 11600 +400 .97 .03
Saving is negative some timeswhenexpendituresare more than income due to extra
expensesorwe may have borrow for fulfillingneedorsurvival .
MPC Part B
Marginal Propensities
The marginal propensity to consume (MPC) is the change in consumption divided by the
change in income. It is a fraction of any change in DI that is spent on consumer goods: MPC =
∆C / ∆Y
The marginal propensity to save (MPS) is the fraction saved of any change in disposable
income. The MPS is equal to the change in saving divided by the change in DI: MPS = ∆S / ∆Y
2. Using the data in Figure 20.2, calculate the MPC and MPS at each level of disposable income.
The first calculation is completed as an example. (This is not a typical consumption function.
Its purpose is to provide practice in calculating MPC and MPS.)
Marginal Propensities to Consume and to Save
Y C S MPC ∆C/∆Y MPS(1-MPC)
12000 12100 -100 -
13000 13000 00 .90 .10
14000 13800 200 .80 .20
15000 14500 500 .70 .30
16000 15100 900 .60 .40
17000 15600 1400 .50 .50
MPC∆C/∆Y 13000-12100
13000-12000
900/1000=.90 and so on
MPS is the saving out of total income.
Why must the sum of the MPC and MPS always equal 1?
Ans: We know that consumption plus saving is equal to income .
Part C
Changes in APC and MPC as Y increases
Y C S APC C/Y APS(1-.20) MPC∆C/∆Y MPS
10000 12000 -12000 1.20 -.20 - -
20000 21000 -1000 1.05 -.05 .90 .10
30000 30000 00 1.0 00 .90 .10
40000 39000 1000 .975 .25 .90 .10
50000 48000 2000 .96 .04 .90 .10
60000 57000 3000 .95 .05 .90 .10
70000 66000 4000 .94 .06 .90 .10

More Related Content

Similar to Average Propensities

5 consumption function
5 consumption function5 consumption function
5 consumption functiondomsr
 
Macro economic equilibrium
Macro economic equilibriumMacro economic equilibrium
Macro economic equilibriumRashain Perera
 
Chapter 18 - Sensitivity Analysis.pdf
Chapter 18 - Sensitivity Analysis.pdfChapter 18 - Sensitivity Analysis.pdf
Chapter 18 - Sensitivity Analysis.pdf18010YeashRahman
 
Consumption Saving and Investment function
Consumption Saving and Investment functionConsumption Saving and Investment function
Consumption Saving and Investment functionDr. Subir Maitra
 
Project Week 71. Both graphs shows a.docx
Project Week 71. Both graphs shows a.docxProject Week 71. Both graphs shows a.docx
Project Week 71. Both graphs shows a.docxwkyra78
 
Chapter 04 keynes income determination
Chapter 04 keynes income determinationChapter 04 keynes income determination
Chapter 04 keynes income determinationImran Khan
 
Business Economics 08 Breakeven Analysis
Business Economics 08 Breakeven AnalysisBusiness Economics 08 Breakeven Analysis
Business Economics 08 Breakeven AnalysisUttam Satapathy
 
Replacement Analysis Economic Life.pptx.
Replacement Analysis Economic Life.pptx.Replacement Analysis Economic Life.pptx.
Replacement Analysis Economic Life.pptx.Athar739197
 
7. annual cash flow analysis
7. annual cash flow analysis7. annual cash flow analysis
7. annual cash flow analysisMohsin Siddique
 
7 150316005526-conversion-gate01
7 150316005526-conversion-gate017 150316005526-conversion-gate01
7 150316005526-conversion-gate01abidiqbal55
 
Break even analysis
Break even analysisBreak even analysis
Break even analysisRAJESHWARRAI
 
Ch 75.For all values of r1,2 E(Rport) = (.6 x .10) + (.4 .docx
Ch 75.For all values of r1,2 E(Rport) = (.6 x .10) + (.4 .docxCh 75.For all values of r1,2 E(Rport) = (.6 x .10) + (.4 .docx
Ch 75.For all values of r1,2 E(Rport) = (.6 x .10) + (.4 .docxtidwellveronique
 
Cash Flow - Unit III Engineering Economics - MG6863
Cash Flow - Unit III Engineering Economics - MG6863Cash Flow - Unit III Engineering Economics - MG6863
Cash Flow - Unit III Engineering Economics - MG6863Balamurugan Subburaj
 
Ch 02 show. risk n return part 1
Ch 02 show. risk n return part 1Ch 02 show. risk n return part 1
Ch 02 show. risk n return part 1nviasidt
 
Bab 2 risk and return part i
Bab 2   risk and return part iBab 2   risk and return part i
Bab 2 risk and return part iEndi Nugroho
 

Similar to Average Propensities (20)

5 consumption function
5 consumption function5 consumption function
5 consumption function
 
Chapter 13
Chapter 13Chapter 13
Chapter 13
 
Macro economic equilibrium
Macro economic equilibriumMacro economic equilibrium
Macro economic equilibrium
 
Chapter 18 - Sensitivity Analysis.pdf
Chapter 18 - Sensitivity Analysis.pdfChapter 18 - Sensitivity Analysis.pdf
Chapter 18 - Sensitivity Analysis.pdf
 
National Income Analysis.pptx
National Income Analysis.pptxNational Income Analysis.pptx
National Income Analysis.pptx
 
Consumption Saving and Investment function
Consumption Saving and Investment functionConsumption Saving and Investment function
Consumption Saving and Investment function
 
Project Week 71. Both graphs shows a.docx
Project Week 71. Both graphs shows a.docxProject Week 71. Both graphs shows a.docx
Project Week 71. Both graphs shows a.docx
 
Consumption
ConsumptionConsumption
Consumption
 
Pk
PkPk
Pk
 
Chapter 04 keynes income determination
Chapter 04 keynes income determinationChapter 04 keynes income determination
Chapter 04 keynes income determination
 
Business Economics 08 Breakeven Analysis
Business Economics 08 Breakeven AnalysisBusiness Economics 08 Breakeven Analysis
Business Economics 08 Breakeven Analysis
 
Replacement Analysis Economic Life.pptx.
Replacement Analysis Economic Life.pptx.Replacement Analysis Economic Life.pptx.
Replacement Analysis Economic Life.pptx.
 
7. annual cash flow analysis
7. annual cash flow analysis7. annual cash flow analysis
7. annual cash flow analysis
 
7 150316005526-conversion-gate01
7 150316005526-conversion-gate017 150316005526-conversion-gate01
7 150316005526-conversion-gate01
 
Break even analysis
Break even analysisBreak even analysis
Break even analysis
 
Ch 75.For all values of r1,2 E(Rport) = (.6 x .10) + (.4 .docx
Ch 75.For all values of r1,2 E(Rport) = (.6 x .10) + (.4 .docxCh 75.For all values of r1,2 E(Rport) = (.6 x .10) + (.4 .docx
Ch 75.For all values of r1,2 E(Rport) = (.6 x .10) + (.4 .docx
 
Cash Flow - Unit III Engineering Economics - MG6863
Cash Flow - Unit III Engineering Economics - MG6863Cash Flow - Unit III Engineering Economics - MG6863
Cash Flow - Unit III Engineering Economics - MG6863
 
Ch 02 show. risk n return part 1
Ch 02 show. risk n return part 1Ch 02 show. risk n return part 1
Ch 02 show. risk n return part 1
 
Bab 2 risk and return part i
Bab 2   risk and return part iBab 2   risk and return part i
Bab 2 risk and return part i
 
Unit 3 review_session
Unit 3 review_sessionUnit 3 review_session
Unit 3 review_session
 

More from Navratan Sharma

Central problem of economics
Central problem of economicsCentral problem of economics
Central problem of economicsNavratan Sharma
 
Career opportunities in commerce stream
Career opportunities in commerce streamCareer opportunities in commerce stream
Career opportunities in commerce streamNavratan Sharma
 
National income (expenditure method)
National income (expenditure method)National income (expenditure method)
National income (expenditure method)Navratan Sharma
 
Fucntions of central bank
Fucntions of central bankFucntions of central bank
Fucntions of central bankNavratan Sharma
 
Nature and significance of management
Nature and significance of managementNature and significance of management
Nature and significance of managementNavratan Sharma
 
Calculate national income by income and expenditure method
Calculate national income by income and expenditure methodCalculate national income by income and expenditure method
Calculate national income by income and expenditure methodNavratan Sharma
 
Calculation of different aggregate
Calculation of different aggregateCalculation of different aggregate
Calculation of different aggregateNavratan Sharma
 
Fudamentals of partnership
Fudamentals of partnershipFudamentals of partnership
Fudamentals of partnershipNavratan Sharma
 

More from Navratan Sharma (20)

Central problem of economics
Central problem of economicsCentral problem of economics
Central problem of economics
 
Career opportunities in commerce stream
Career opportunities in commerce streamCareer opportunities in commerce stream
Career opportunities in commerce stream
 
National income (expenditure method)
National income (expenditure method)National income (expenditure method)
National income (expenditure method)
 
Fucntions of central bank
Fucntions of central bankFucntions of central bank
Fucntions of central bank
 
Nature and significance of management
Nature and significance of managementNature and significance of management
Nature and significance of management
 
Calculate national income by income and expenditure method
Calculate national income by income and expenditure methodCalculate national income by income and expenditure method
Calculate national income by income and expenditure method
 
Calculation of different aggregate
Calculation of different aggregateCalculation of different aggregate
Calculation of different aggregate
 
Dk geol Q NO83
Dk geol Q NO83Dk geol Q NO83
Dk geol Q NO83
 
D k goel q no117
D k goel q no117D k goel q no117
D k goel q no117
 
Economics chapter 2
Economics chapter 2Economics chapter 2
Economics chapter 2
 
Kinds of shares
Kinds of sharesKinds of shares
Kinds of shares
 
Basic of accounts
Basic of accountsBasic of accounts
Basic of accounts
 
Company accounts 12
Company accounts 12Company accounts 12
Company accounts 12
 
EKO cracks 12
EKO cracks 12EKO cracks 12
EKO cracks 12
 
B st principles of mgmt
B st principles of mgmtB st principles of mgmt
B st principles of mgmt
 
Fudamentals of partnership
Fudamentals of partnershipFudamentals of partnership
Fudamentals of partnership
 
Xii economics set a qpf
Xii economics  set a qpfXii economics  set a qpf
Xii economics set a qpf
 
Forms of market 11
Forms of market 11Forms of market 11
Forms of market 11
 
Economic Reforms LPG
Economic Reforms LPGEconomic Reforms LPG
Economic Reforms LPG
 
Notes poverty
Notes povertyNotes poverty
Notes poverty
 

Recently uploaded

The basics of sentences session 2pptx copy.pptx
The basics of sentences session 2pptx copy.pptxThe basics of sentences session 2pptx copy.pptx
The basics of sentences session 2pptx copy.pptxheathfieldcps1
 
This PowerPoint helps students to consider the concept of infinity.
This PowerPoint helps students to consider the concept of infinity.This PowerPoint helps students to consider the concept of infinity.
This PowerPoint helps students to consider the concept of infinity.christianmathematics
 
Accessible design: Minimum effort, maximum impact
Accessible design: Minimum effort, maximum impactAccessible design: Minimum effort, maximum impact
Accessible design: Minimum effort, maximum impactdawncurless
 
microwave assisted reaction. General introduction
microwave assisted reaction. General introductionmicrowave assisted reaction. General introduction
microwave assisted reaction. General introductionMaksud Ahmed
 
Activity 01 - Artificial Culture (1).pdf
Activity 01 - Artificial Culture (1).pdfActivity 01 - Artificial Culture (1).pdf
Activity 01 - Artificial Culture (1).pdfciinovamais
 
Nutritional Needs Presentation - HLTH 104
Nutritional Needs Presentation - HLTH 104Nutritional Needs Presentation - HLTH 104
Nutritional Needs Presentation - HLTH 104misteraugie
 
Unit-IV; Professional Sales Representative (PSR).pptx
Unit-IV; Professional Sales Representative (PSR).pptxUnit-IV; Professional Sales Representative (PSR).pptx
Unit-IV; Professional Sales Representative (PSR).pptxVishalSingh1417
 
How to Give a Domain for a Field in Odoo 17
How to Give a Domain for a Field in Odoo 17How to Give a Domain for a Field in Odoo 17
How to Give a Domain for a Field in Odoo 17Celine George
 
Explore beautiful and ugly buildings. Mathematics helps us create beautiful d...
Explore beautiful and ugly buildings. Mathematics helps us create beautiful d...Explore beautiful and ugly buildings. Mathematics helps us create beautiful d...
Explore beautiful and ugly buildings. Mathematics helps us create beautiful d...christianmathematics
 
Gardella_PRCampaignConclusion Pitch Letter
Gardella_PRCampaignConclusion Pitch LetterGardella_PRCampaignConclusion Pitch Letter
Gardella_PRCampaignConclusion Pitch LetterMateoGardella
 
Mixin Classes in Odoo 17 How to Extend Models Using Mixin Classes
Mixin Classes in Odoo 17  How to Extend Models Using Mixin ClassesMixin Classes in Odoo 17  How to Extend Models Using Mixin Classes
Mixin Classes in Odoo 17 How to Extend Models Using Mixin ClassesCeline George
 
Holdier Curriculum Vitae (April 2024).pdf
Holdier Curriculum Vitae (April 2024).pdfHoldier Curriculum Vitae (April 2024).pdf
Holdier Curriculum Vitae (April 2024).pdfagholdier
 
Measures of Central Tendency: Mean, Median and Mode
Measures of Central Tendency: Mean, Median and ModeMeasures of Central Tendency: Mean, Median and Mode
Measures of Central Tendency: Mean, Median and ModeThiyagu K
 
Ecological Succession. ( ECOSYSTEM, B. Pharmacy, 1st Year, Sem-II, Environmen...
Ecological Succession. ( ECOSYSTEM, B. Pharmacy, 1st Year, Sem-II, Environmen...Ecological Succession. ( ECOSYSTEM, B. Pharmacy, 1st Year, Sem-II, Environmen...
Ecological Succession. ( ECOSYSTEM, B. Pharmacy, 1st Year, Sem-II, Environmen...Shubhangi Sonawane
 
Z Score,T Score, Percential Rank and Box Plot Graph
Z Score,T Score, Percential Rank and Box Plot GraphZ Score,T Score, Percential Rank and Box Plot Graph
Z Score,T Score, Percential Rank and Box Plot GraphThiyagu K
 
Key note speaker Neum_Admir Softic_ENG.pdf
Key note speaker Neum_Admir Softic_ENG.pdfKey note speaker Neum_Admir Softic_ENG.pdf
Key note speaker Neum_Admir Softic_ENG.pdfAdmir Softic
 

Recently uploaded (20)

The basics of sentences session 2pptx copy.pptx
The basics of sentences session 2pptx copy.pptxThe basics of sentences session 2pptx copy.pptx
The basics of sentences session 2pptx copy.pptx
 
This PowerPoint helps students to consider the concept of infinity.
This PowerPoint helps students to consider the concept of infinity.This PowerPoint helps students to consider the concept of infinity.
This PowerPoint helps students to consider the concept of infinity.
 
Accessible design: Minimum effort, maximum impact
Accessible design: Minimum effort, maximum impactAccessible design: Minimum effort, maximum impact
Accessible design: Minimum effort, maximum impact
 
microwave assisted reaction. General introduction
microwave assisted reaction. General introductionmicrowave assisted reaction. General introduction
microwave assisted reaction. General introduction
 
Activity 01 - Artificial Culture (1).pdf
Activity 01 - Artificial Culture (1).pdfActivity 01 - Artificial Culture (1).pdf
Activity 01 - Artificial Culture (1).pdf
 
INDIA QUIZ 2024 RLAC DELHI UNIVERSITY.pptx
INDIA QUIZ 2024 RLAC DELHI UNIVERSITY.pptxINDIA QUIZ 2024 RLAC DELHI UNIVERSITY.pptx
INDIA QUIZ 2024 RLAC DELHI UNIVERSITY.pptx
 
Nutritional Needs Presentation - HLTH 104
Nutritional Needs Presentation - HLTH 104Nutritional Needs Presentation - HLTH 104
Nutritional Needs Presentation - HLTH 104
 
Unit-IV; Professional Sales Representative (PSR).pptx
Unit-IV; Professional Sales Representative (PSR).pptxUnit-IV; Professional Sales Representative (PSR).pptx
Unit-IV; Professional Sales Representative (PSR).pptx
 
Advance Mobile Application Development class 07
Advance Mobile Application Development class 07Advance Mobile Application Development class 07
Advance Mobile Application Development class 07
 
Código Creativo y Arte de Software | Unidad 1
Código Creativo y Arte de Software | Unidad 1Código Creativo y Arte de Software | Unidad 1
Código Creativo y Arte de Software | Unidad 1
 
How to Give a Domain for a Field in Odoo 17
How to Give a Domain for a Field in Odoo 17How to Give a Domain for a Field in Odoo 17
How to Give a Domain for a Field in Odoo 17
 
Explore beautiful and ugly buildings. Mathematics helps us create beautiful d...
Explore beautiful and ugly buildings. Mathematics helps us create beautiful d...Explore beautiful and ugly buildings. Mathematics helps us create beautiful d...
Explore beautiful and ugly buildings. Mathematics helps us create beautiful d...
 
Gardella_PRCampaignConclusion Pitch Letter
Gardella_PRCampaignConclusion Pitch LetterGardella_PRCampaignConclusion Pitch Letter
Gardella_PRCampaignConclusion Pitch Letter
 
Mixin Classes in Odoo 17 How to Extend Models Using Mixin Classes
Mixin Classes in Odoo 17  How to Extend Models Using Mixin ClassesMixin Classes in Odoo 17  How to Extend Models Using Mixin Classes
Mixin Classes in Odoo 17 How to Extend Models Using Mixin Classes
 
Mattingly "AI & Prompt Design: Structured Data, Assistants, & RAG"
Mattingly "AI & Prompt Design: Structured Data, Assistants, & RAG"Mattingly "AI & Prompt Design: Structured Data, Assistants, & RAG"
Mattingly "AI & Prompt Design: Structured Data, Assistants, & RAG"
 
Holdier Curriculum Vitae (April 2024).pdf
Holdier Curriculum Vitae (April 2024).pdfHoldier Curriculum Vitae (April 2024).pdf
Holdier Curriculum Vitae (April 2024).pdf
 
Measures of Central Tendency: Mean, Median and Mode
Measures of Central Tendency: Mean, Median and ModeMeasures of Central Tendency: Mean, Median and Mode
Measures of Central Tendency: Mean, Median and Mode
 
Ecological Succession. ( ECOSYSTEM, B. Pharmacy, 1st Year, Sem-II, Environmen...
Ecological Succession. ( ECOSYSTEM, B. Pharmacy, 1st Year, Sem-II, Environmen...Ecological Succession. ( ECOSYSTEM, B. Pharmacy, 1st Year, Sem-II, Environmen...
Ecological Succession. ( ECOSYSTEM, B. Pharmacy, 1st Year, Sem-II, Environmen...
 
Z Score,T Score, Percential Rank and Box Plot Graph
Z Score,T Score, Percential Rank and Box Plot GraphZ Score,T Score, Percential Rank and Box Plot Graph
Z Score,T Score, Percential Rank and Box Plot Graph
 
Key note speaker Neum_Admir Softic_ENG.pdf
Key note speaker Neum_Admir Softic_ENG.pdfKey note speaker Neum_Admir Softic_ENG.pdf
Key note speaker Neum_Admir Softic_ENG.pdf
 

Average Propensities

  • 1. Navratan sharma PG Com.SMPS Practice with APC, APS, MPC and MPS Average Propensities PartA The average propensityto consume (APC) is the ratio of consumptionexpenditures(C) to Y income (Y),or APC = C / Y The average propensityto save (APS) isthe ratio of savings (S) to disposable income,orAPS = S / Y 1. Usingthe data inFigure 20.1, calculate the APC and APS at each level ofdisposable income given. Figure 20.1 Average PropensitiestoConsume and to Save Disposable Income ConsumptionSaving APC and APS Y C S (APC)C/Y (APS)S/Y 00 2000 -2000 00 - 2000 3600 -1600 1.80 .80 4000 5200 -1200 1.30 .30 6000 6800 -800 1.13 .13 8000 8400 -400 1.05 .05 10000 10000 00 1.00 0 12000 11600 +400 .97 .03 Saving is negative some timeswhenexpendituresare more than income due to extra expensesorwe may have borrow for fulfillingneedorsurvival . MPC Part B Marginal Propensities The marginal propensity to consume (MPC) is the change in consumption divided by the change in income. It is a fraction of any change in DI that is spent on consumer goods: MPC = ∆C / ∆Y The marginal propensity to save (MPS) is the fraction saved of any change in disposable income. The MPS is equal to the change in saving divided by the change in DI: MPS = ∆S / ∆Y 2. Using the data in Figure 20.2, calculate the MPC and MPS at each level of disposable income. The first calculation is completed as an example. (This is not a typical consumption function. Its purpose is to provide practice in calculating MPC and MPS.) Marginal Propensities to Consume and to Save Y C S MPC ∆C/∆Y MPS(1-MPC) 12000 12100 -100 - 13000 13000 00 .90 .10 14000 13800 200 .80 .20
  • 2. 15000 14500 500 .70 .30 16000 15100 900 .60 .40 17000 15600 1400 .50 .50 MPC∆C/∆Y 13000-12100 13000-12000 900/1000=.90 and so on MPS is the saving out of total income. Why must the sum of the MPC and MPS always equal 1? Ans: We know that consumption plus saving is equal to income . Part C Changes in APC and MPC as Y increases Y C S APC C/Y APS(1-.20) MPC∆C/∆Y MPS 10000 12000 -12000 1.20 -.20 - - 20000 21000 -1000 1.05 -.05 .90 .10 30000 30000 00 1.0 00 .90 .10 40000 39000 1000 .975 .25 .90 .10 50000 48000 2000 .96 .04 .90 .10 60000 57000 3000 .95 .05 .90 .10 70000 66000 4000 .94 .06 .90 .10