More Related Content
Similar to 2nd kamalaker activity20_macro
Similar to 2nd kamalaker activity20_macro (20)
2nd kamalaker activity20_macro
- 1. UNIT
3 Macroeconomics
LESSON 1 I ACTIVITY 20
Practice with APC, APS, MPC and MPS
Part A
Average Propensities
The average propensity to consume (APC) is the ratio of consumption expenditures (C) to disposable
income (DI), or APC = C / DI.
The average propensity to save (APS) is the ratio of savings (S) to disposable income, or APS = S / DI.
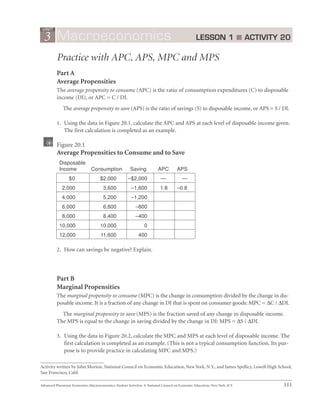
1. Using the data in Figure 20.1, calculate the APC and APS at each level of disposable income given.
The first calculation is completed as an example.
Figure 20.1
Average Propensities to Consume and to Save
Disposable
Income
Consumption
Saving
APC
APS
$0
$2,000
–$2,000
—
—
2,000
3,600
–1,600
1.8
–0.8
4,000
5,200
–1,200
6,000
6,800
–800
8,000
8,400
–400
10,000
10,000
12,000
11,600
1.3
1.133
-.3
-.1333
0
1.05
1
-.05
0
400
.967
.0333
2. How can savings be negative? Explain.
savings can be negative when consumption
(most likely autonomous) exceeds disposable income. Because APC+APS=1, if APC>1 then APS must be <1
or negative.
Part B
Marginal Propensities
The marginal propensity to consume (MPC) is the change in consumption divided by the change in disposable income. It is a fraction of any change in DI that is spent on consumer goods: MPC = ∆C / ∆DI.
The marginal propensity to save (MPS) is the fraction saved of any change in disposable income.
The MPS is equal to the change in saving divided by the change in DI: MPS = ∆S / ∆DI.
3. Using the data in Figure 20.2, calculate the MPC and MPS at each level of disposable income. The
first calculation is completed as an example. (This is not a typical consumption function. Its purpose is to provide practice in calculating MPC and MPS.)
Activity written by John Morton, National Council on Economic Education, New York, N.Y., and James Spellicy, Lowell High School,
San Francisco, Calif.
Advanced Placement Economics Macroeconomics: Student Activities © National Council on Economic Education, New York, N.Y.
111
- 2. UNIT
3 Macroeconomics LESSON 1 I ACTIVITY 20
(continued)
Figure 20.2
Marginal Propensities to Consume and to Save
Disposable
Income
Consumption
Saving
$12,000
$12,100
–$100
13,000
13,000
0
14,000
13,800
200
15,000
14,500
500
16,000
15,100
900
17,000
15,600
1,400
MPC
MPS
—
—
0.90
0.10
.80
.7
.6
.5
.20
.3
.4
.5
4. Why must the sum of MPC and MPS always equal 1?
money not spent must be money saved
therefore all income will either be spent or saved
Part C
Figure 20.3
Changes in APC and MPC as DI Increases
Disposable
Income
$10,000
Consumption
$12,000
Savings
–$2,000
20,000
21,000
–1,000
30,000
30,000
0
40,000
39,000
1,000
50,000
48,000
2,000
60,000
57,000
3,000
70,000
66,000
4000
APC
1.2
1.05
1.00
.975
.96
.95
.942
APS
MPC
-0.2
-.05
0
.025
.04
.05
.058
MPS
—
.9
.9
.9
.9
.9
.9
—
.1
.1
.1
.1
.1
.1
5. Complete Figure 20.3, and answer the questions based on the completed table.
1.2
1.05
6. What is the APC at a DI level of $10,000? _______ At $20,000? _______
7. What happens to the APC as DI rises? APC decreases
_______________________
.9
.9
8. What is the MPC as DI goes from $50,000 to $60,000? ______ From $60,000 to $70,000? ______
stays the same
9. What happens to MPC as income rises? __________________________ What happens to MPS
stays the same
as income rises? ____________________________
10. What is the conceptual difference between APC and MPC?
112
APC is the average amount of consumption in relation to disposable income whereas
MPC is the rate of disposable income spent on consumption as disposable income
changes
Advanced Placement Economics Macroeconomics: Student Activities © National Council on Economic Education, New York, N.Y.