Why do we need a nexus approach in addressing?, Bahram Taheri
•
0 likes•366 views

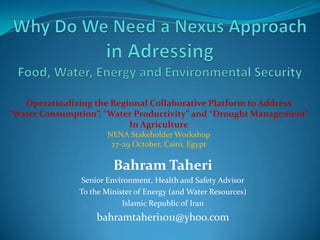
Workshop on Operationalizing the Regional Collaborative Platform to Address ‘Water Consumption, Water Productivity and Drought Management’ in Agriculture, 27 - 29 October 2015, Cairo, Egypt

Recommended
Recommended
More Related Content
Similar to Why do we need a nexus approach in addressing?, Bahram Taheri
Similar to Why do we need a nexus approach in addressing?, Bahram Taheri (20)
More from NENAwaterscarcity
More from NENAwaterscarcity (20)
Recently uploaded
Recently uploaded (20)
Why do we need a nexus approach in addressing?, Bahram Taheri
- 1. Bahram Taheri Senior Environment, Health and Safety Advisor To the Minister of Energy (and Water Resources) Islamic Republic of Iran bahramtaheri1011@yhoo.com Operatioalizing the Regional Collaborative Platform to Address “Water Consumption”, “Water Productivity” and “Drought Management” In Agriculture NENA Stakeholder Workshop 27-29 October, Cairo, Egypt
- 2. Lake Urmia, 1997 Blue Sky Meeting the Blue Water
- 3. Let’s Look at the Scale of Things!
- 4. All water on the planet (sphere over western U.S., 1384 Km in diameter) Fresh liquid water in the ground, lakes, swamps, and rivers (sphere over Kentucky, 273 Km in diameter), and Fresh-water lakes and rivers (the Tiny sphere over Georgia, 56 Km in diameter).
- 5. Earth, Water and Air
- 6. The thin Atmosphere, Moon and Earth
- 7. Layers of Water Approx. in m Km V in Km3 A in Km2 Layer Thickness R of Earth 6371 1.083E+12 510064041 Spread Over Earth R of Water Globe 692 1.388E+09 2721.33 R of Freah Water Globe 136.5 10653350 20.89 R of Fresh Surface W Globe 28 91952.245 0.18
- 8. Let Me Define A New Layer! Let’s Check its Thickness And Then Teach it His Scale!? World Population 7.5E+09 Avg. Weight in Kg 68 Total Weight in Kg 5.1E+11 Approx. Density 1 Human Volume in Liters 5.1E+11 Human Volume in Km3 0.51 Human Layer in Meters 9.999E-07 Human Layer in Microns 0.9998744 Human Layer, Defined By: Bahram Taheri, 2014
- 9. A Space of Waste
- 12. CO2 Concentration Change in the Atmosphere within the Past 500,000 Years Company Logo 12
- 13. Company Logo 13 Temperature Changes of Earth within the Past 500,000 Years
- 15. CO2 Conc. Trend in Atm. 1959-2014 Source: NOAA 300.00 310.00 320.00 330.00 340.00 350.00 360.00 370.00 380.00 390.00 400.00 410.00 1950 1960 1970 1980 1990 2000 2010 2020 CO2 ppm CO2 ppm
- 16. Monthly CO2 Concentrations in the Atmosphere in 2014 394.00 395.00 396.00 397.00 398.00 399.00 400.00 401.00 402.00 403.00 0.00 6.00 12.00 2014, Monthly CO2 ppm
- 17. CO2 Concentration Changes in the Atmosphere, Based on Measures Daily and Weekly Averages
- 18. Changes with Continental Scales!
- 19. Dark VS White Surfaces A Runaway Procedure?
- 20. Losing the Elements of Thermal Balance
- 21. An Ever Reducing Space for Everyone!
- 22. Not Only for the Animals!
- 23. Some Will Drawn
- 24. Some Will Face Drought
- 25. Then We Will Pray
- 26. Either in the US
- 27. Or in Isfahan of Iran
- 28. The Young Kids in the Drought Stricken Villages of Central Iran Pray for Rain
- 29. The Open and Closed Eyes of the People of the Past, Present and Future
- 35. How Can we Overlook the Pyramid, in the Land of Pyramids? Food Security Environmental Security Energy Security Water Securit y
- 37. Study Zones
- 38. DAMS
- 39. Deep Wells
- 40. Shallow Wells
- 41. aline Wels, WI
- 43. احیاهردو تثبیتهردو ینهایاحیای اکولوژیکازرت 2014 2015 2016 2017 2018 2019 2020 2021 2022 2023 Stabilization Period Restoration Period Final Stage 19th Reform Group Meeting, Salzburg - September 1-5, 2014 Ecological Level
- 44. Restoration of the Ecological Level Vision for 2023 ارومیه May 2014 Level=1270.53 ارویه May 2002 Level=1274.5019th Reform Group Meeting, Salzburg - September 1-5, 2014
- 45. Schematic river basin lake, 15 Rivers Aji Chai Azarshahr Chai Ghaleh Chai Sofi Chai Mardogh Chai Laylan Chai Zarineh rood Simineh rood Lake Urmia Zola Chai Nazlou Chai Rozeh Chai Shahr Chai Barandouz Chai Gadar Chai Mahabad Chai
- 46. Location of major dams in operation Tajyar sarab Kordkand y Sarogh Sharchi Ghaleh chi Alaviyan Nahand Zola Mahaba d Hasanl o Bokan Salmas Kordestan Province E. Azarbaijan W. Az. Province
- 47. 19th Reform Group Meeting, Salzburg - September 1-5, 2014 More than 16,000 pumps are pumping water from the surface and groundwater resources, mostly unauthorized. 2000 mobile pumps extract more then 100 MCM/Year alone. One critical effect of Energy Consumption on Water Resources
- 48. Changes in Water Elevation and Area of the Lake between 1976 and 2011
- 49. Remarkable similarity Between the Sister Lakes 50 km Feb 1970 July 2000 4300 km2 Area 5100 km2 4.4 m Mean Depth 6 m 1280 m Elevation 1275 m Both have causeways dividing them; both have watersheds in 3 states 41°N 37°N
- 50. LU and GSL are both like flat Frying Pans
- 51. 51 آبي كم خشك تكامل روند شورابه Changing of major Ions of brine to 3 new stages in wet, semi arid and arid conditions from 2007 to 2011 During the time, sodium concentrations have decreased compared to Mg concentration, which indicates huge amounts of Halite have been deposited on Lake’s periphery and bed. That is, sodium has passed from solution phase to solid phase
- 52. $1,946 $651 Aquaculture (brine shrimp) Mining/Industrial - magnesium - potash - titanium Recreation - hunting - bird watching - boating, swimming $6800 Economic Value of the Great Salt Lake – $9.4 Billion (US) 8% of the gross economic product of the State of Utah (Makes people interested in the lake) (Bioeconomics 2012) (72%) (21%) (7%)
- 53. Great Salt Lake Resources Recreation ($650 million) Hunting Boating Bird watching Swimming
- 54. Brine Shrimp (Artemia franciscana) $650 million of total economic benefit
- 55. Connection of Simineh Gadar Mahabad Rivers Vast dissipation of Zarrineh River Before reaching the lake Sattelaite Image Water Losses Before Rivers Reach the Water Body 19th Reform Group Meeting, Salzburg - September 1-5, 2014
- 56. Slopes of the southern shores of the Lake 19th Reform Group Meeting, Salzburg - September 1-5, 2014
- 58. Slopes of the Eastern Shores Aji Chai 19th Reform Group Meeting, Salzburg - September 1-5, 2014
- 59. Thick Layers of Salt after Water Evaporation 19th Reform Group Meeting, Salzburg - September 1-5, 2014
- 60. Silty-Clay Dusts River Deltas Around the Islands 19th Reform Group Meeting, Salzburg - September 1-5, 2014
- 61. Sand Dunes on the Southern Shores 19th Reform Group Meeting, Salzburg - September 1-5, 2014
- 62. No. Area Square Km Frequency 1391 2886 3231 4234 5444 Centersof ObservedDustStorms 19th Reform Group Meeting, Salzburg - September 1-5, 2014
- 63. ياچهرد جنويب حمدوده–ارديبهشت1393 19th Reform Group Meeting, Salzburg - September 1-5, 2014
- 64. Southern Shores 19th Reform Group Meeting, Salzburg - September 1-5, 2014
- 65. Water Withdrawals/year in MCM Deep Wells Semi- Deep ElectricDieselTotal MCM829119489711242022 # of Wells 6,43880,80427,86359,37887,242 19th Reform Group Meeting, Salzburg - September 1-5, 2014, Bahram Taheri
- 66. 2006 Economic Statistics of the Basin Sector % Basin Gross Product % Employment % Water Consumption Service5836.51 Industry2734.21.4 Agriculture1529.389 19th Reform Group Meeting, Salzburg - September 1-5, 2014, Bahram Taheri
- 67. Land Ownership in the Basin 0 10 20 30 40 50 60 زیراضیرا1تارهک اضیرا1تا5تارهک اضیرا5تا20تارهک اضیرا20تا50تارهک ازبیشاضیرا50تارهک %Ownershipoflands Urmia Iran < 1 ha 1-5 ha 5-20ha 20-50 > 50 ha 19th Reform Group Meeting, Salzburg - September 1-5, 2014 (Bahram Taheri)
- 72. Where and When Did We Lose Our Sight on the Scope and Scale of Things?
- 83. Tabriz 700 Years Ago The Largest City Within the LU Basin Farmers pay a tax for using the water from artificial reservoirs and Qanats, usually 1/3 of their yield. I think, this city is the best trade center in the world. Merchants would pay a transit fee as well as a tax on the merchandize they trade. 24 trade offices by people of Genoa alone are operating in Tabriz. The tax collected by the governor of Tabriz from the European merchants who were crossing the safe transport roads constructed and operated by the Empire, is more than the entire tax the king of France collects from all of France. Ref. Harold Lamb: The Last Great Conqueror
- 84. GDP Comparison of Iran and others in the Top 25 (Source, Wikipedia) Rank Country Nominal GDP Agr. % Industry % Services% Agr. Net Ind. Net Services Net 0 World 71,707,302 5.90% 30.50% 63.60% 4,230,731 21,870,727 45,605,844 1 United States 15,684,750 1.12% 19.10% 79.70% 188,217 2,995,787 12,500,746 2 China 9,181,377 10.00% 43.90% 46.10% 918,138 3,611,671 3,792,665 3 Japan 5,963,969 1.20% 27.50% 71.40% 71,568 1,640,091 4,258,274 4 Germany 3,400,579 0.80% 28.10% 71.10% 27,205 955,563 2,417,812 5 France 2,608,699 1.90% 18.30% 79.80% 49,565 477,392 2,081,742 6 United Kingdom 2,440,505 0.70% 21% 78.30% 17,084 512,506 1,910,915 7 Brazil 2,395,968 5.40% 27.40% 67.20% 129,382 656,495 1,610,090 8 Russia 2,021,960 3.90% 36% 60.10% 78,856 727,906 1,215,198 25 Iran 482,445 11.20% 40.60% 48.20% 54,034 195,873 232,538
- 85. The Share of Agriculture in GDP Rank Country Nominal GDP Agr. % Industry % Services% Agr. Net Ind. Net Services Net 1 India 1,841,710 17.40% 25.80% 56.90% 320,458 475,161 1,047,933 2 Indonesia 894,854 14.30% 46.90% 38.80% 127,964 419,687 347,203 3 Iran 482,445 11.20% 40.60% 48.20% 54,034 195,873 232,538 4 China 9,181,377 10.00% 43.90% 46.10% 918,138 3,611,671 3,792,665 5 Turkey 783,064 8.90% 28.10% 63% 69,693 220,041 493,330 6 World 71,707,302 5.90% 30.50% 63.60% 4,230,731 21,870,727 45,605,844 21 Switzerland 622,855 1.30% 27.70% 71% 8,097 172,531 442,227 22 Japan 5,963,969 1.20% 27.50% 71.40% 71,568 1,640,091 4,258,274 23 United States 15,684,750 1.12% 19.10% 79.70% 188,217 2,995,787 12,500,746 24 Germany 3,400,579 0.80% 28.10% 71.10% 27,205 955,563 2,417,812 25 United Kingdom 2,440,505 0.70% 21% 78.30% 17,084 512,506 1,910,915 26 Belgium 513,396 0.70% 21.60% 77.70% 3,594 110,894 398,909
- 86. The Share of Industry in GDP Rank Country Nominal GDP Agr. % Industry % Services% Agr. Net Ind. Net Services Net 1 Saudi Arabia 657,049 2% 66.90% 31.10% 13,141 439,566 204,342 2 Indonesia 894,854 14.30% 46.90% 38.80% 127,964 419,687 347,203 3 China 9,181,377 10.00% 43.90% 46.10% 918,138 3,611,671 3,792,665 4 Iran 482,445 11.20% 40.60% 48.20% 54,034 195,873 232,538 5 South Korea 1,151,271 2.70% 39.80% 57.50% 31,084 458,206 661,981 22 Netherlands 770,224 2.80% 24.10% 73.20% 21,566 185,624 563,804 23 Belgium 513,396 0.70% 21.60% 77.70% 3,594 110,894 398,909 24 United Kingdom 2,440,505 0.70% 21% 78.30% 17,084 512,506 1,910,915 25 United States 15,684,750 1.12% 19.10% 79.70% 188,217 2,995,787 12,500,746 26 France 2,608,699 1.90% 18.30% 79.80% 49,565 477,392 2,081,742
- 87. The Share of Service Sector in the GDP Rank Country Nominal GDP Agr. % Industry % Services % Agr. Net Ind. Net Services Net 1 France 2,608,699 1.90% 18.30% 79.80% 49,565 477,392 2,081,742 2 United States 15,684,750 1.12% 19.10% 79.70% 188,217 2,995,787 12,500,746 3 United Kingdom 2,440,505 0.70% 21% 78.30% 17,084 512,506 1,910,915 4 Belgium 513,396 0.70% 21.60% 77.70% 3,594 110,894 398,909 21 South Korea 1,151,271 2.70% 39.80% 57.50% 31,084 458,206 661,981 22 India 1,841,710 17.40% 25.80% 56.90% 320,458 475,161 1,047,933 23 Iran 482,445 11.20% 40.60% 48.20% 54,034 195,873 232,538 24 China 9,181,377 10.00% 43.90% 46.10% 918,138 3,611,671 3,792,665 25 Indonesia 894,854 14.30% 46.90% 38.80% 127,964 419,687 347,203 26 Saudi Arabia 657,049 2% 66.90% 31.10% 13,141 439,566 204,342
- 88. Large Inter Basin Water Transfers name Year of construction Length Capacity (Million cubic meters/year) Costs (US$ bn) California State Water Project (USA) Early 1960s-1990s 715 km 25 (10,300 cubic feet/sec) 5.2 Colorado River Aqueduct (USA) 1933–1941 392 km 1603.5 (1.3m acre-feet/year) ? Central Arizona Project (USA) 1973-93 541 km 1850.2 (1.5m acre-feet/year) 3.6 National Water Carrier (Israel) 1953-64 130 km 1.7 ? Cutzamala System (Mexico) Late 1970s-late 1990s 154 km 2.1 (24 m3 /s) 1.3 All-American Canal (USA) 1930s 132 km 64 (740 m3 /s) ? Periyar Project (India) Commissioned in 1895 ? 3.5 (41 m3 /s) ? Indira Gandhi Canal (India) Since 1958 650 km ? ? Telugu Ganga project (India) 1977–2004 406 km 10.1 (3.7 bn m3/year) ? Irtysh- Karaganda scheme (Kazakhstan) 1962–1974 450 km 6.5 (75 m3 /s) ?
- 91. The Salt Balance For Conserved Area 3500 km2 Estimated Net Evap m/y 0.85 m Total Evap/yr Needed water 2.975 B C M Transferred water/year Salt/Liter Salt Content/Year SG Volume Average Thickness In iters in Grams In Tons tons/m3 m3/year mm/year 2.975E+12 13 38,675,000 2.17 17,822,581 5.09 total initial Vol. Salt Salt Content Age in yrs Salt Entry Salt Entry Ratio m3 gr/lit tons Estimated per year in Tons Casp/Naural 30000000000 100 3000000000 20000 150000 258
- 96. ذاِإ َو ۗ مِهِسُفنَأِب ما ِّروايَغُي ٰىّتَح ٍومَقِب ما ُرِّيَغُي ال َ ََّّللا َّنِإ نِم ِهِندو نِم ُمهَل ما َو ۚ ُهَل َّدَرَم الَف اًءسو ٍومَقِب ُ ََّّللا َدراَأ ٍوال