Download as PDF, PPTX

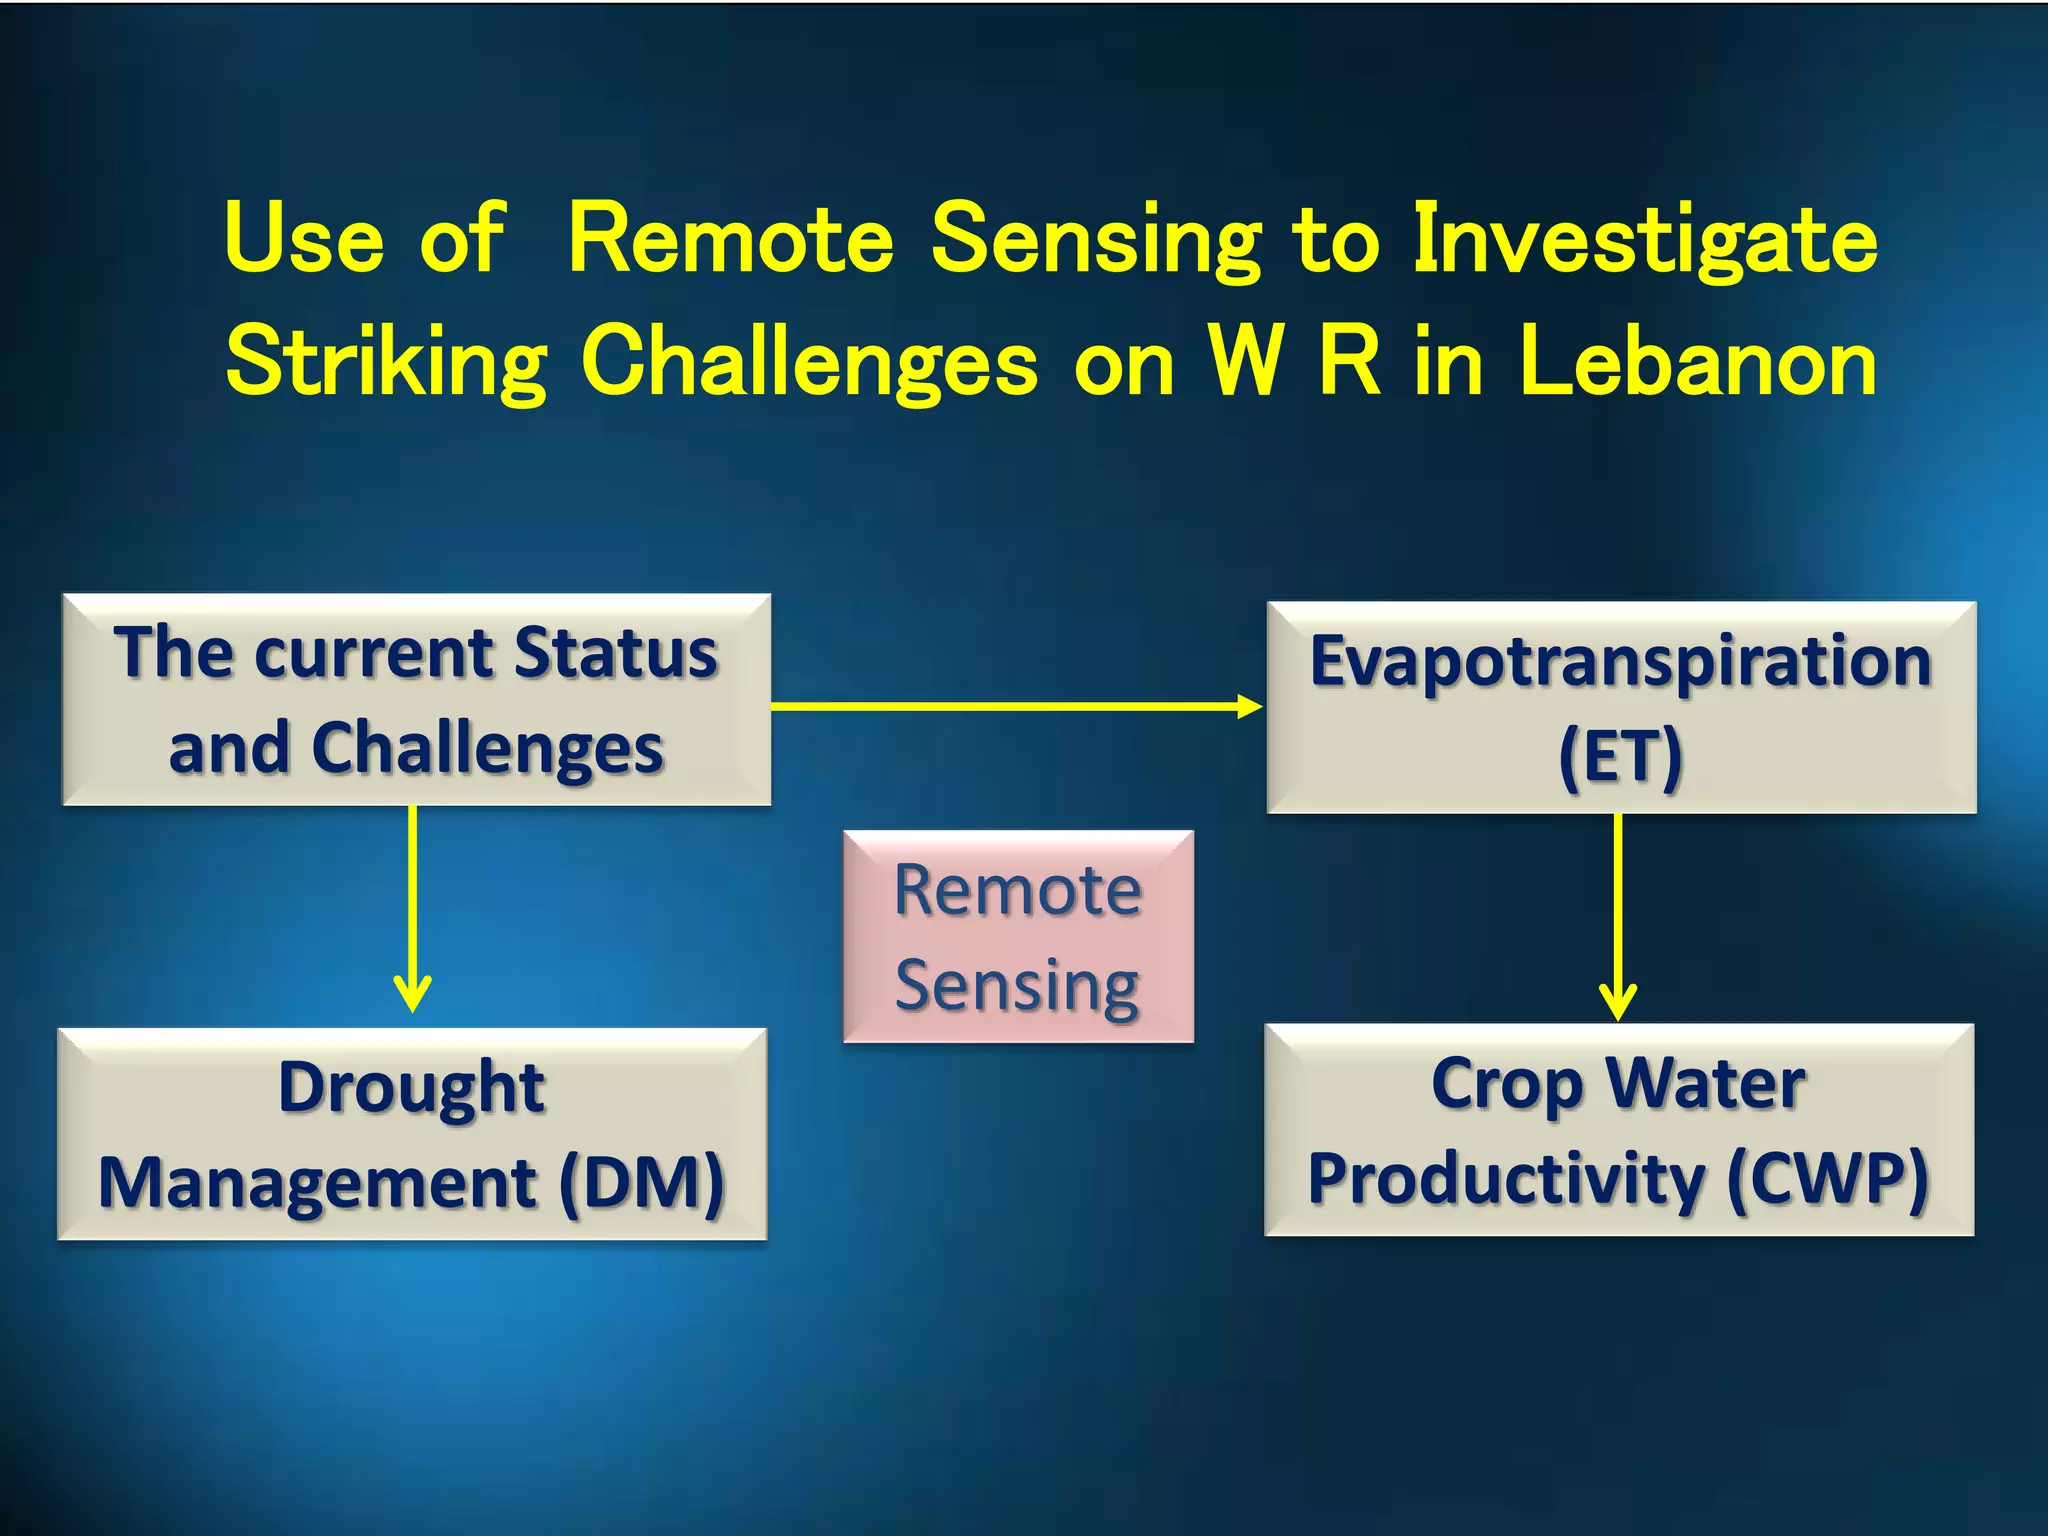


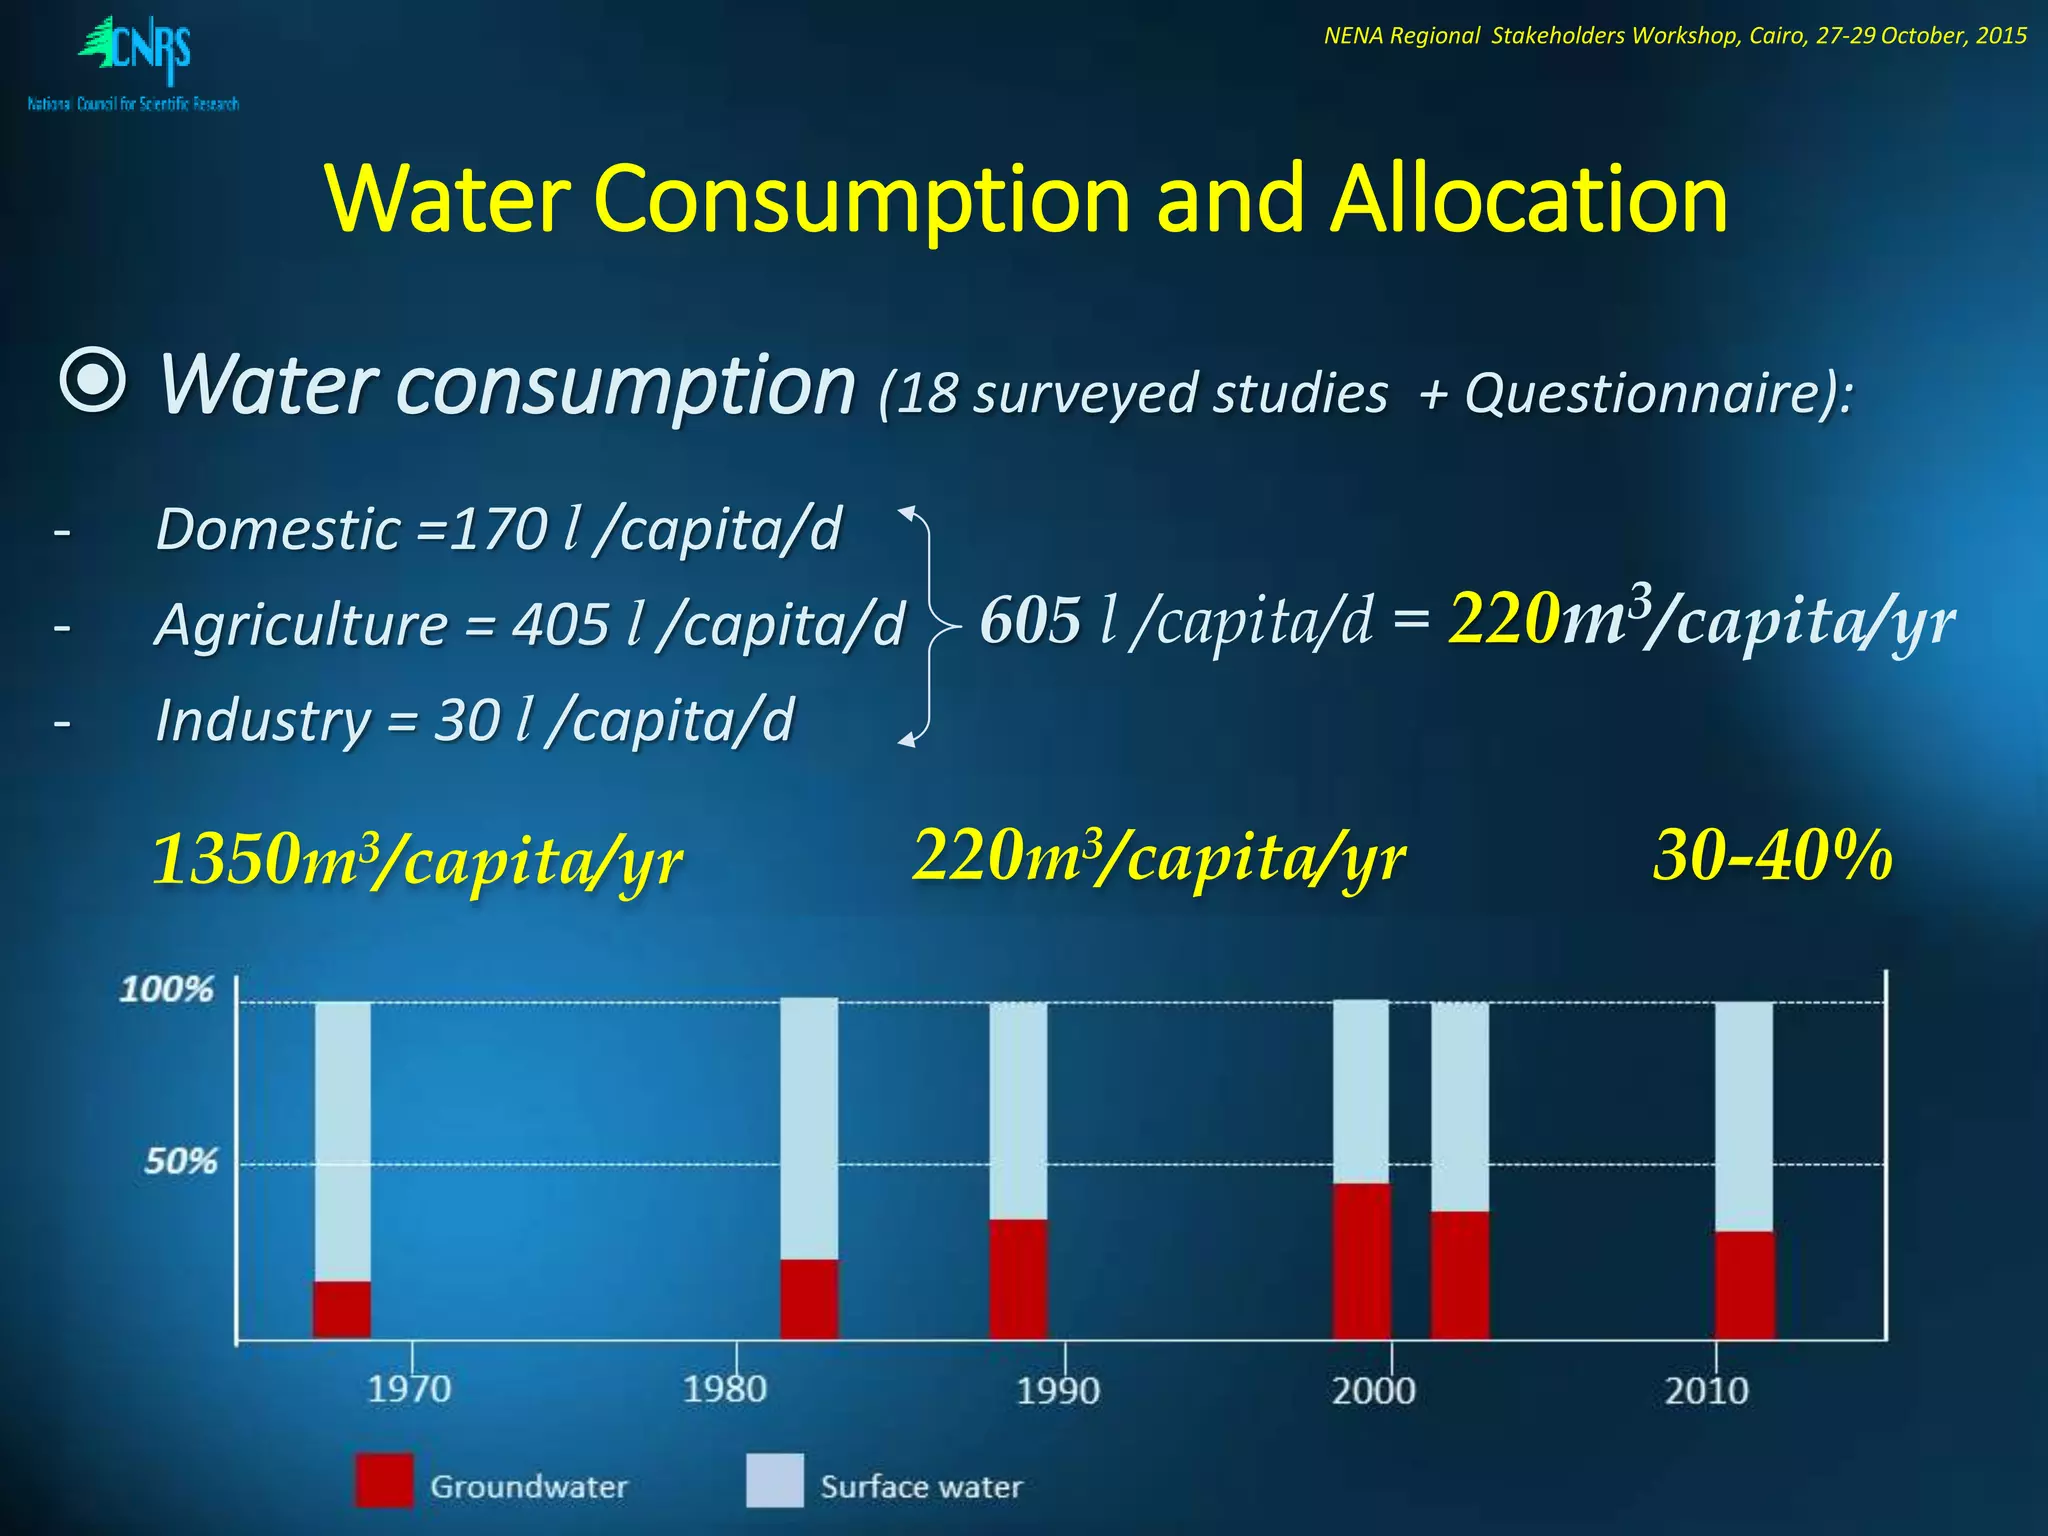
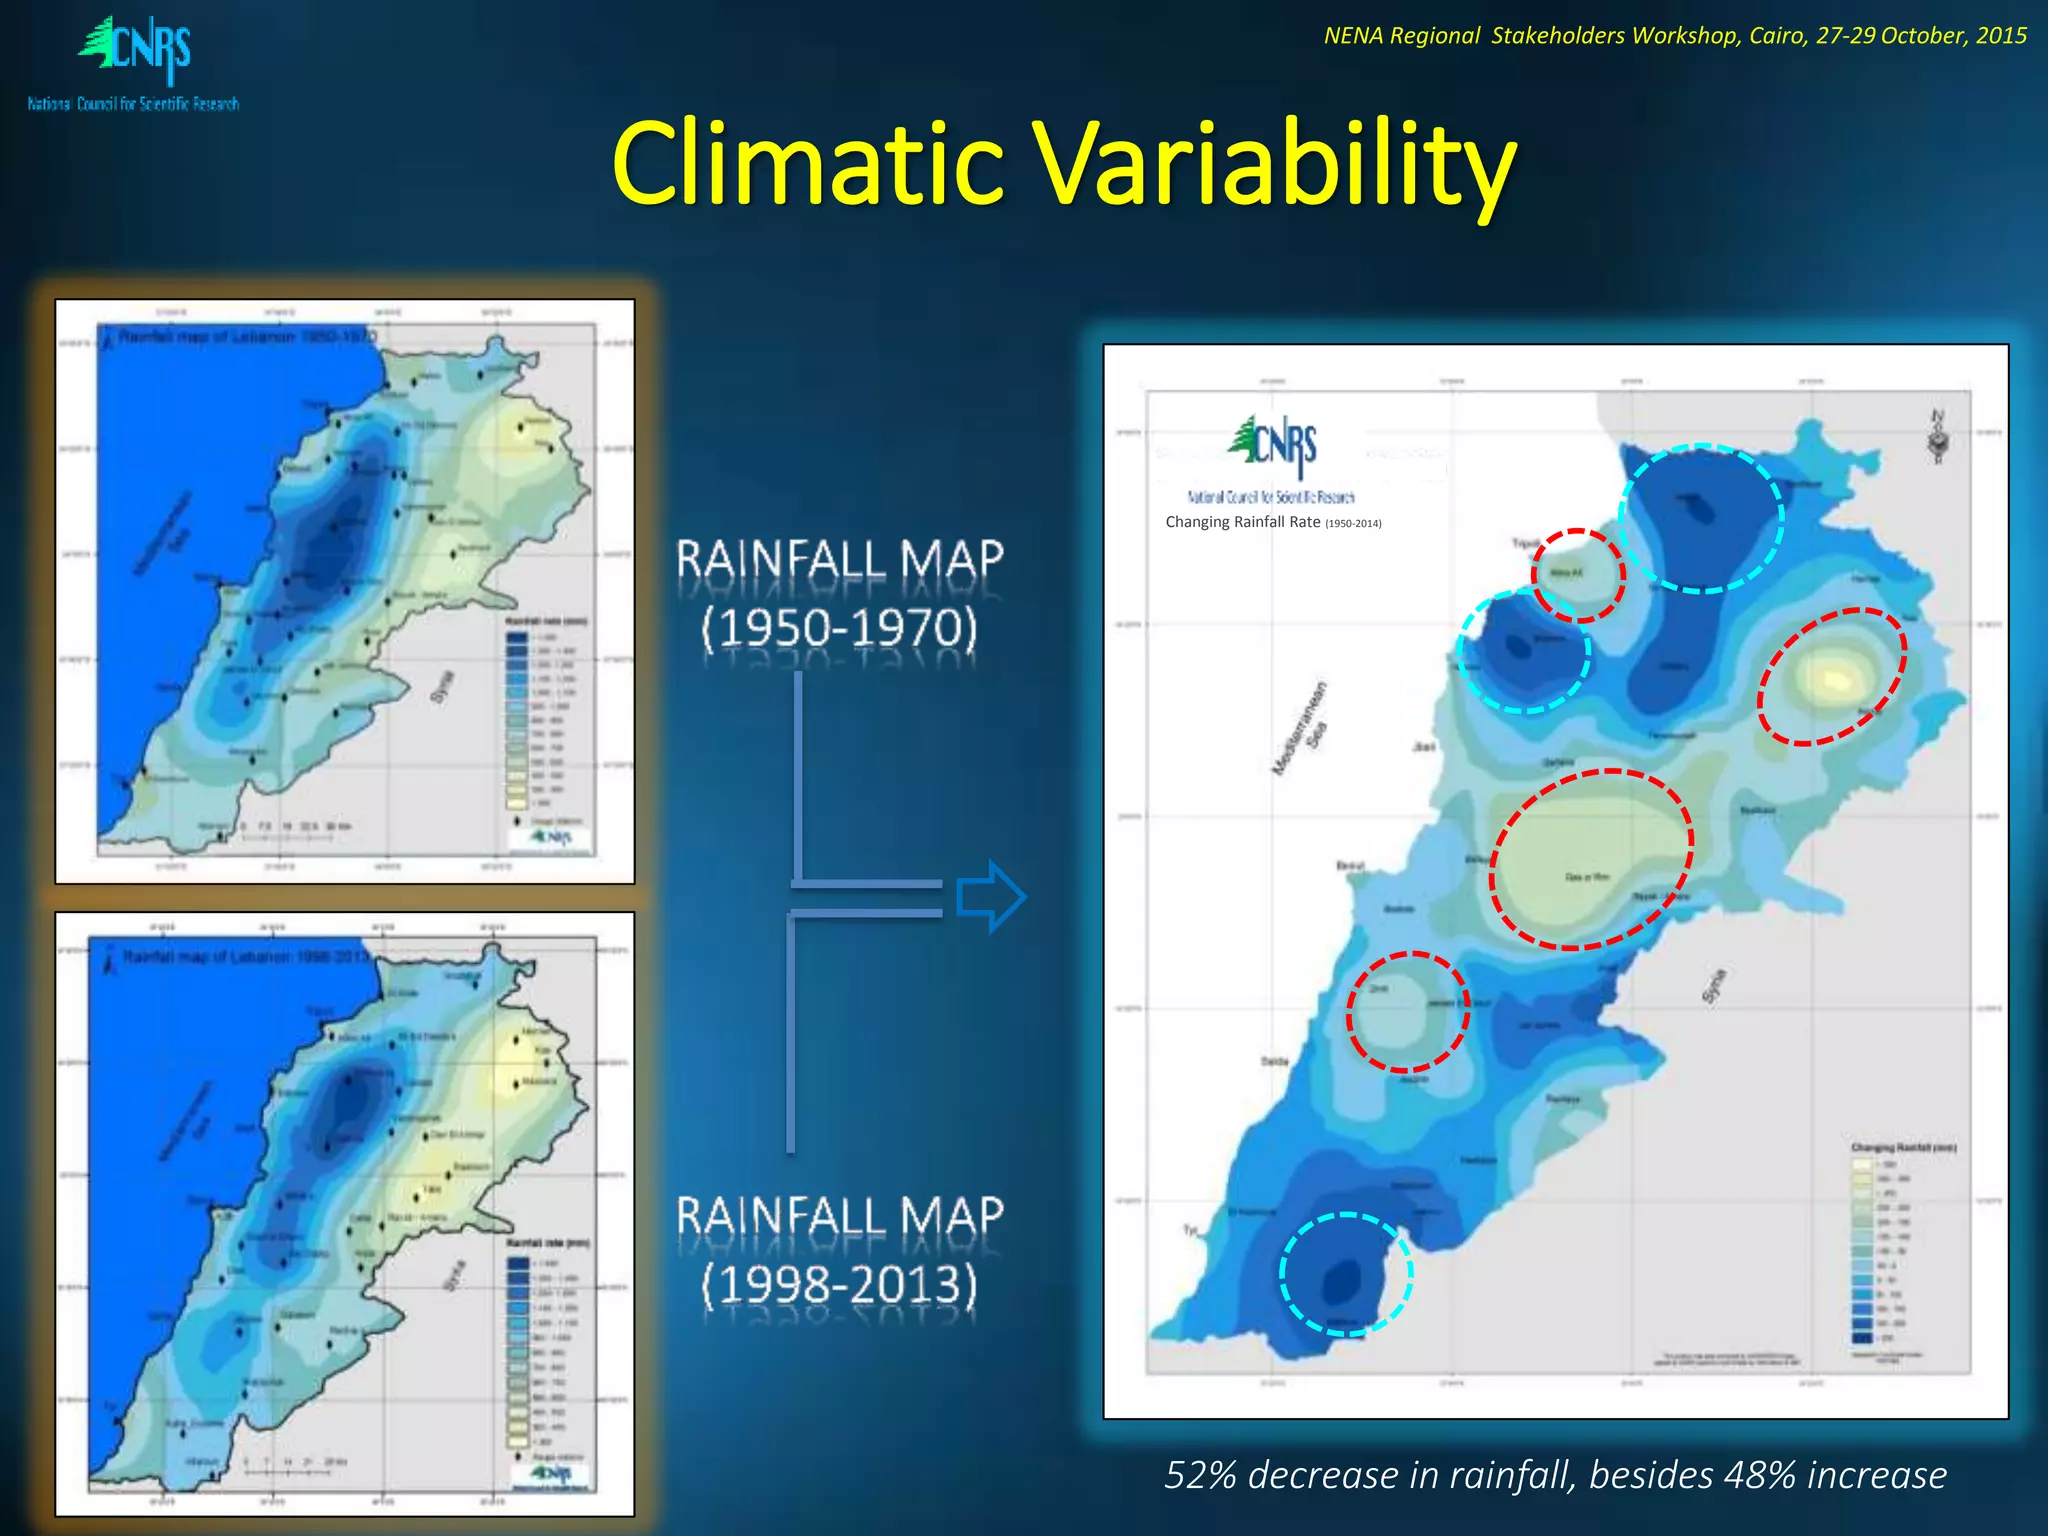


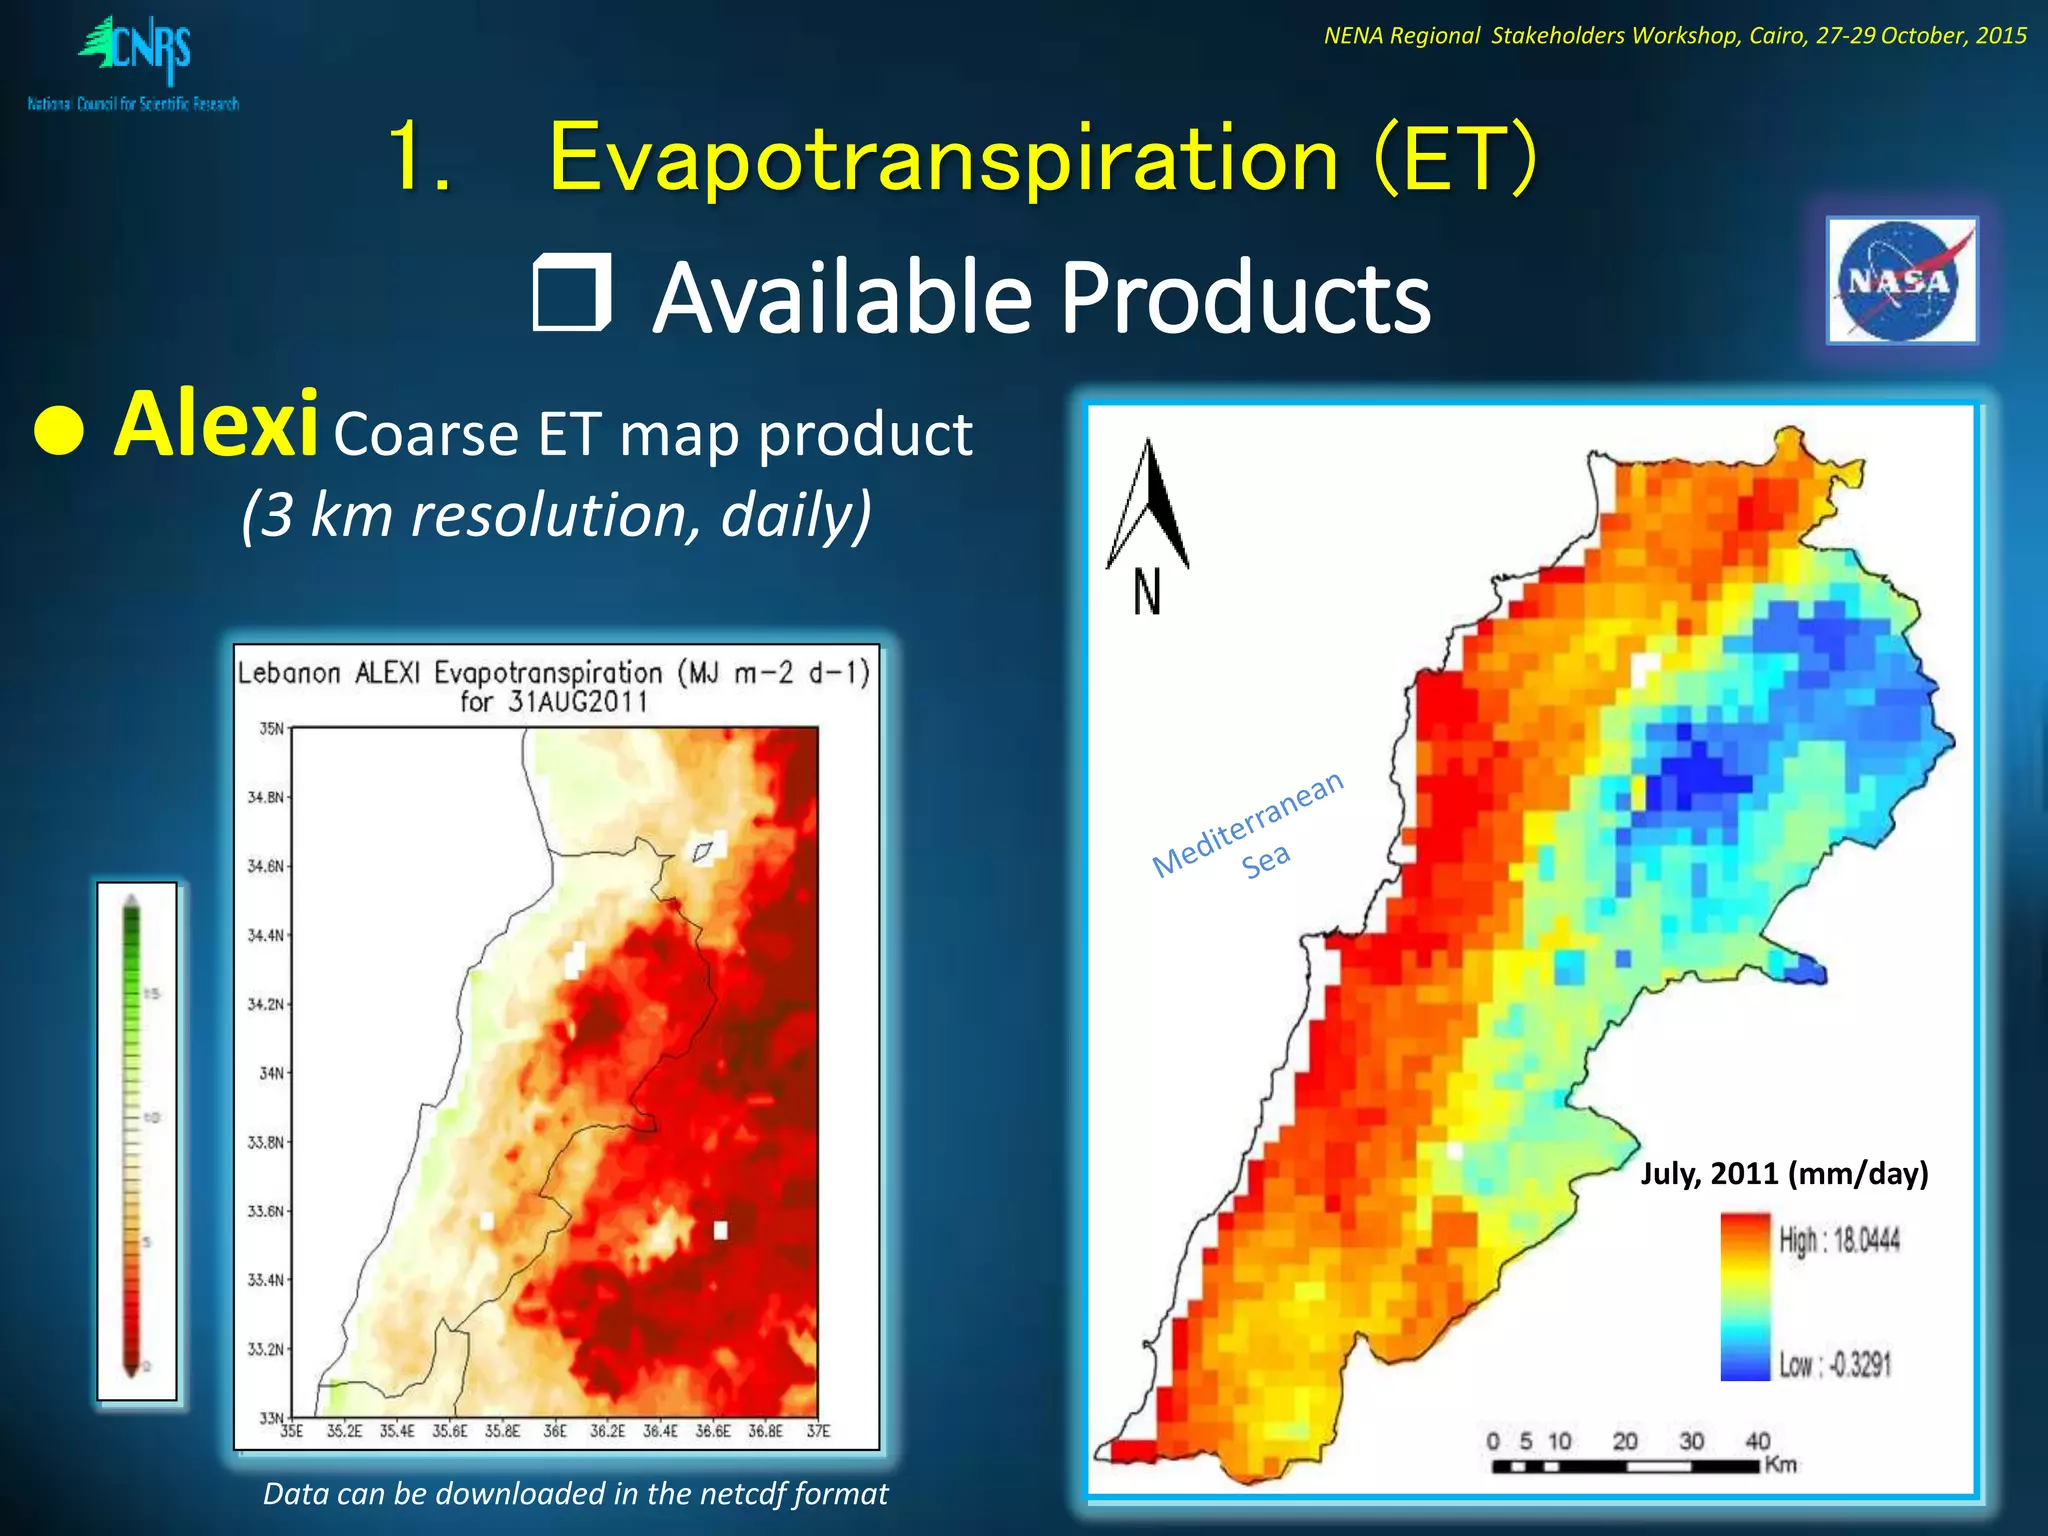
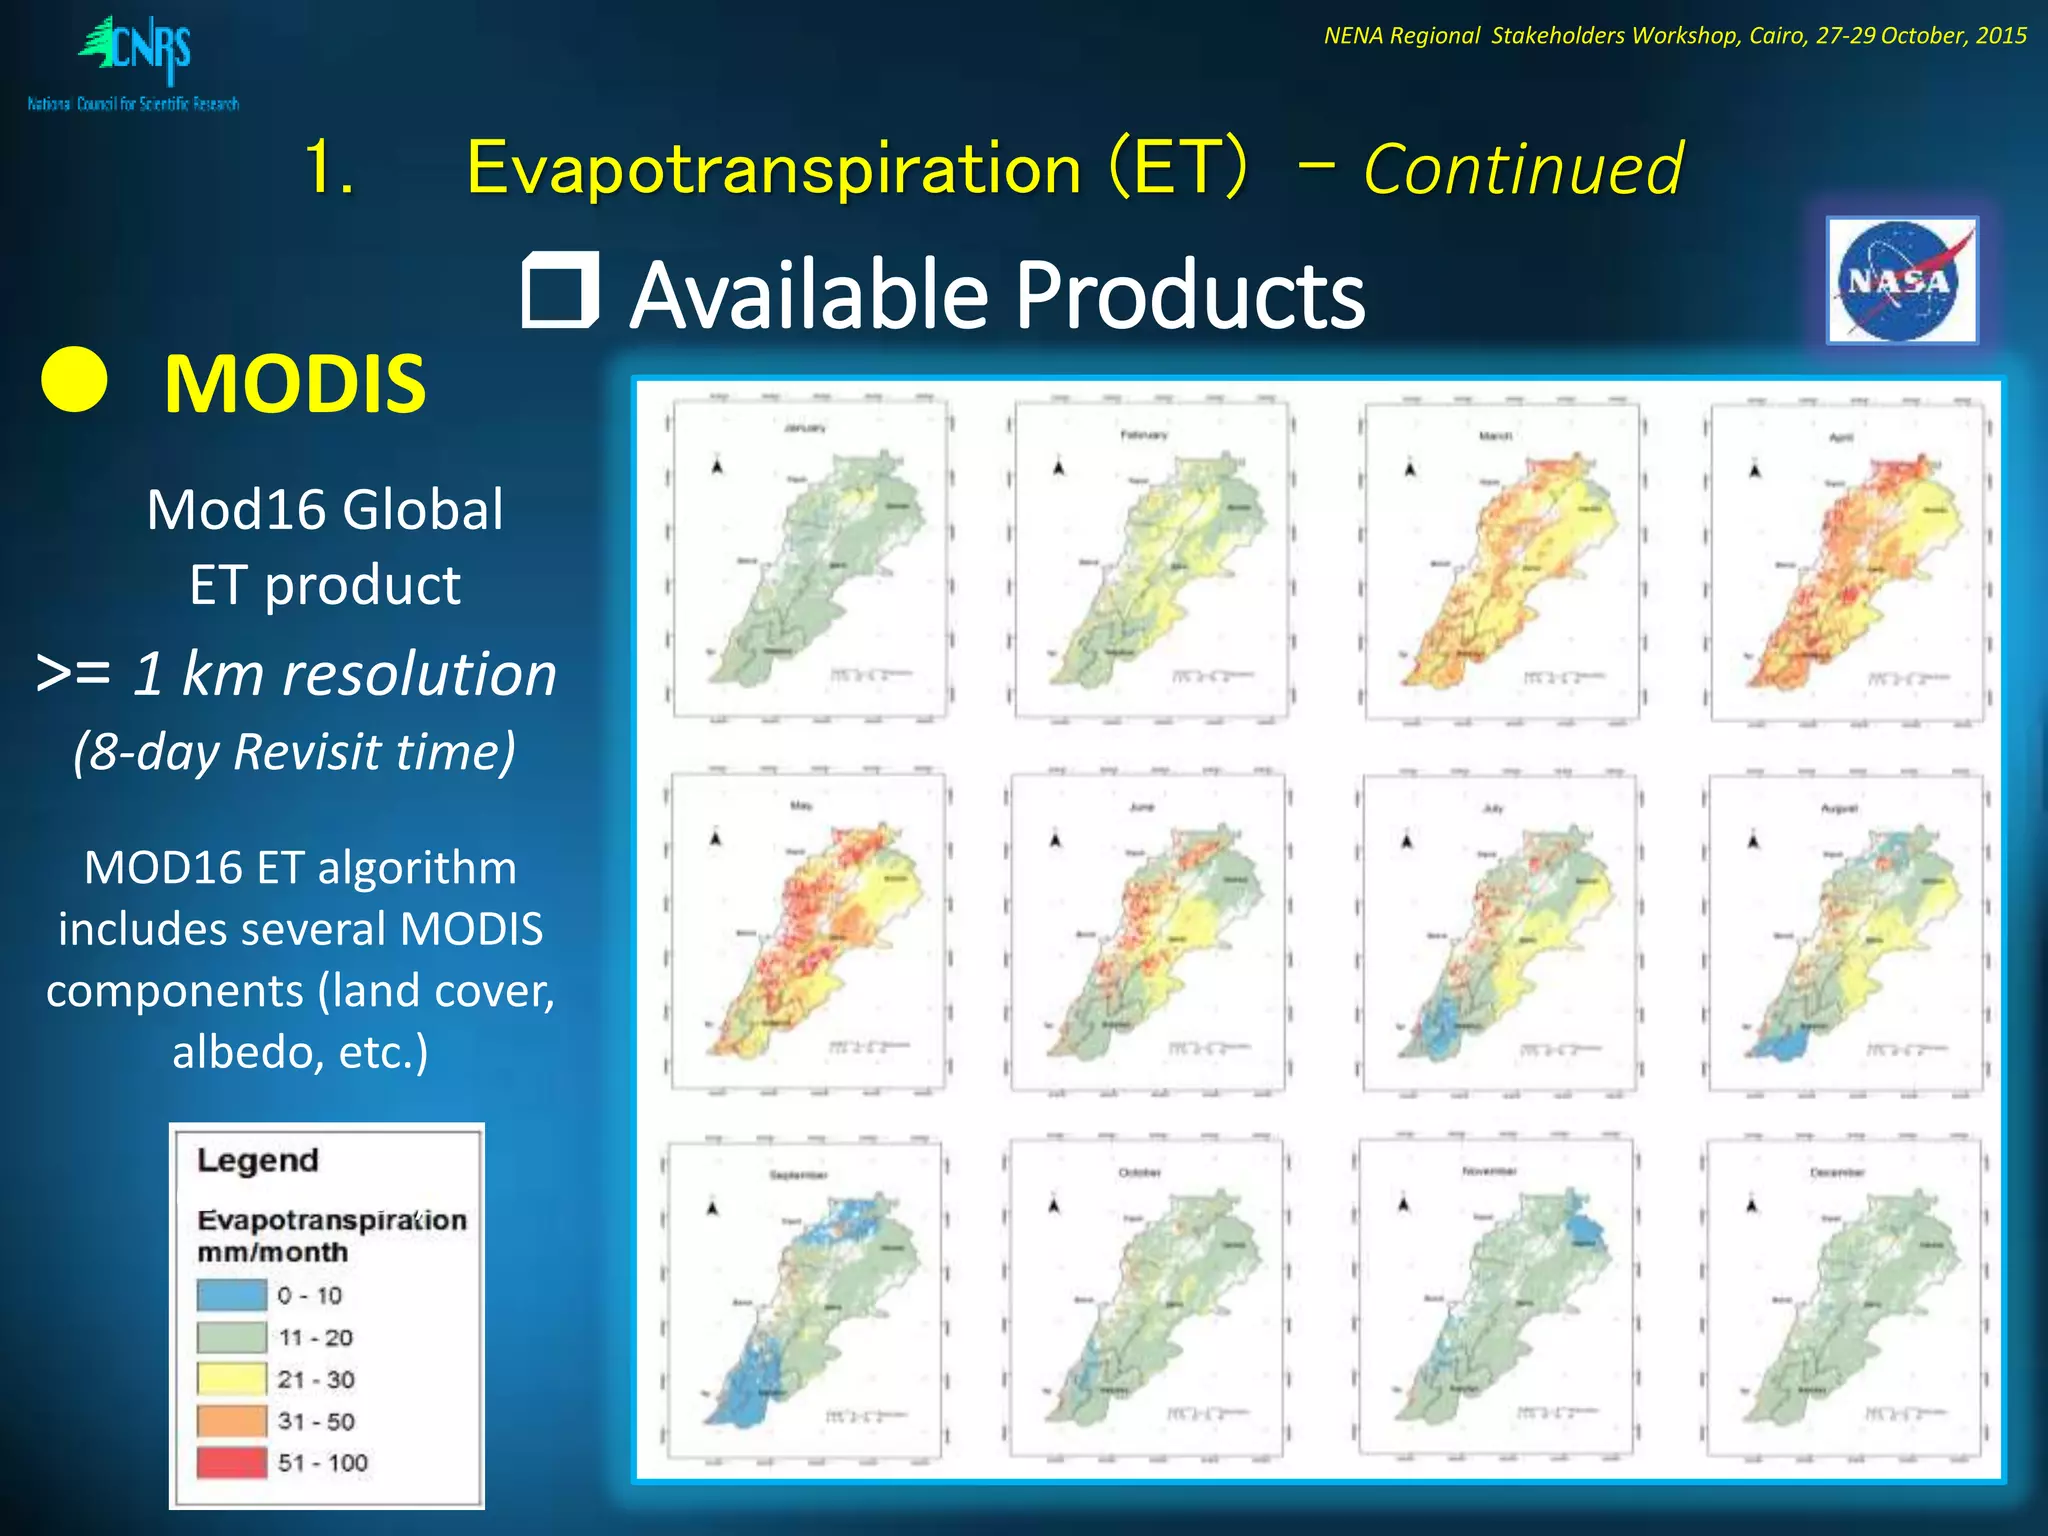
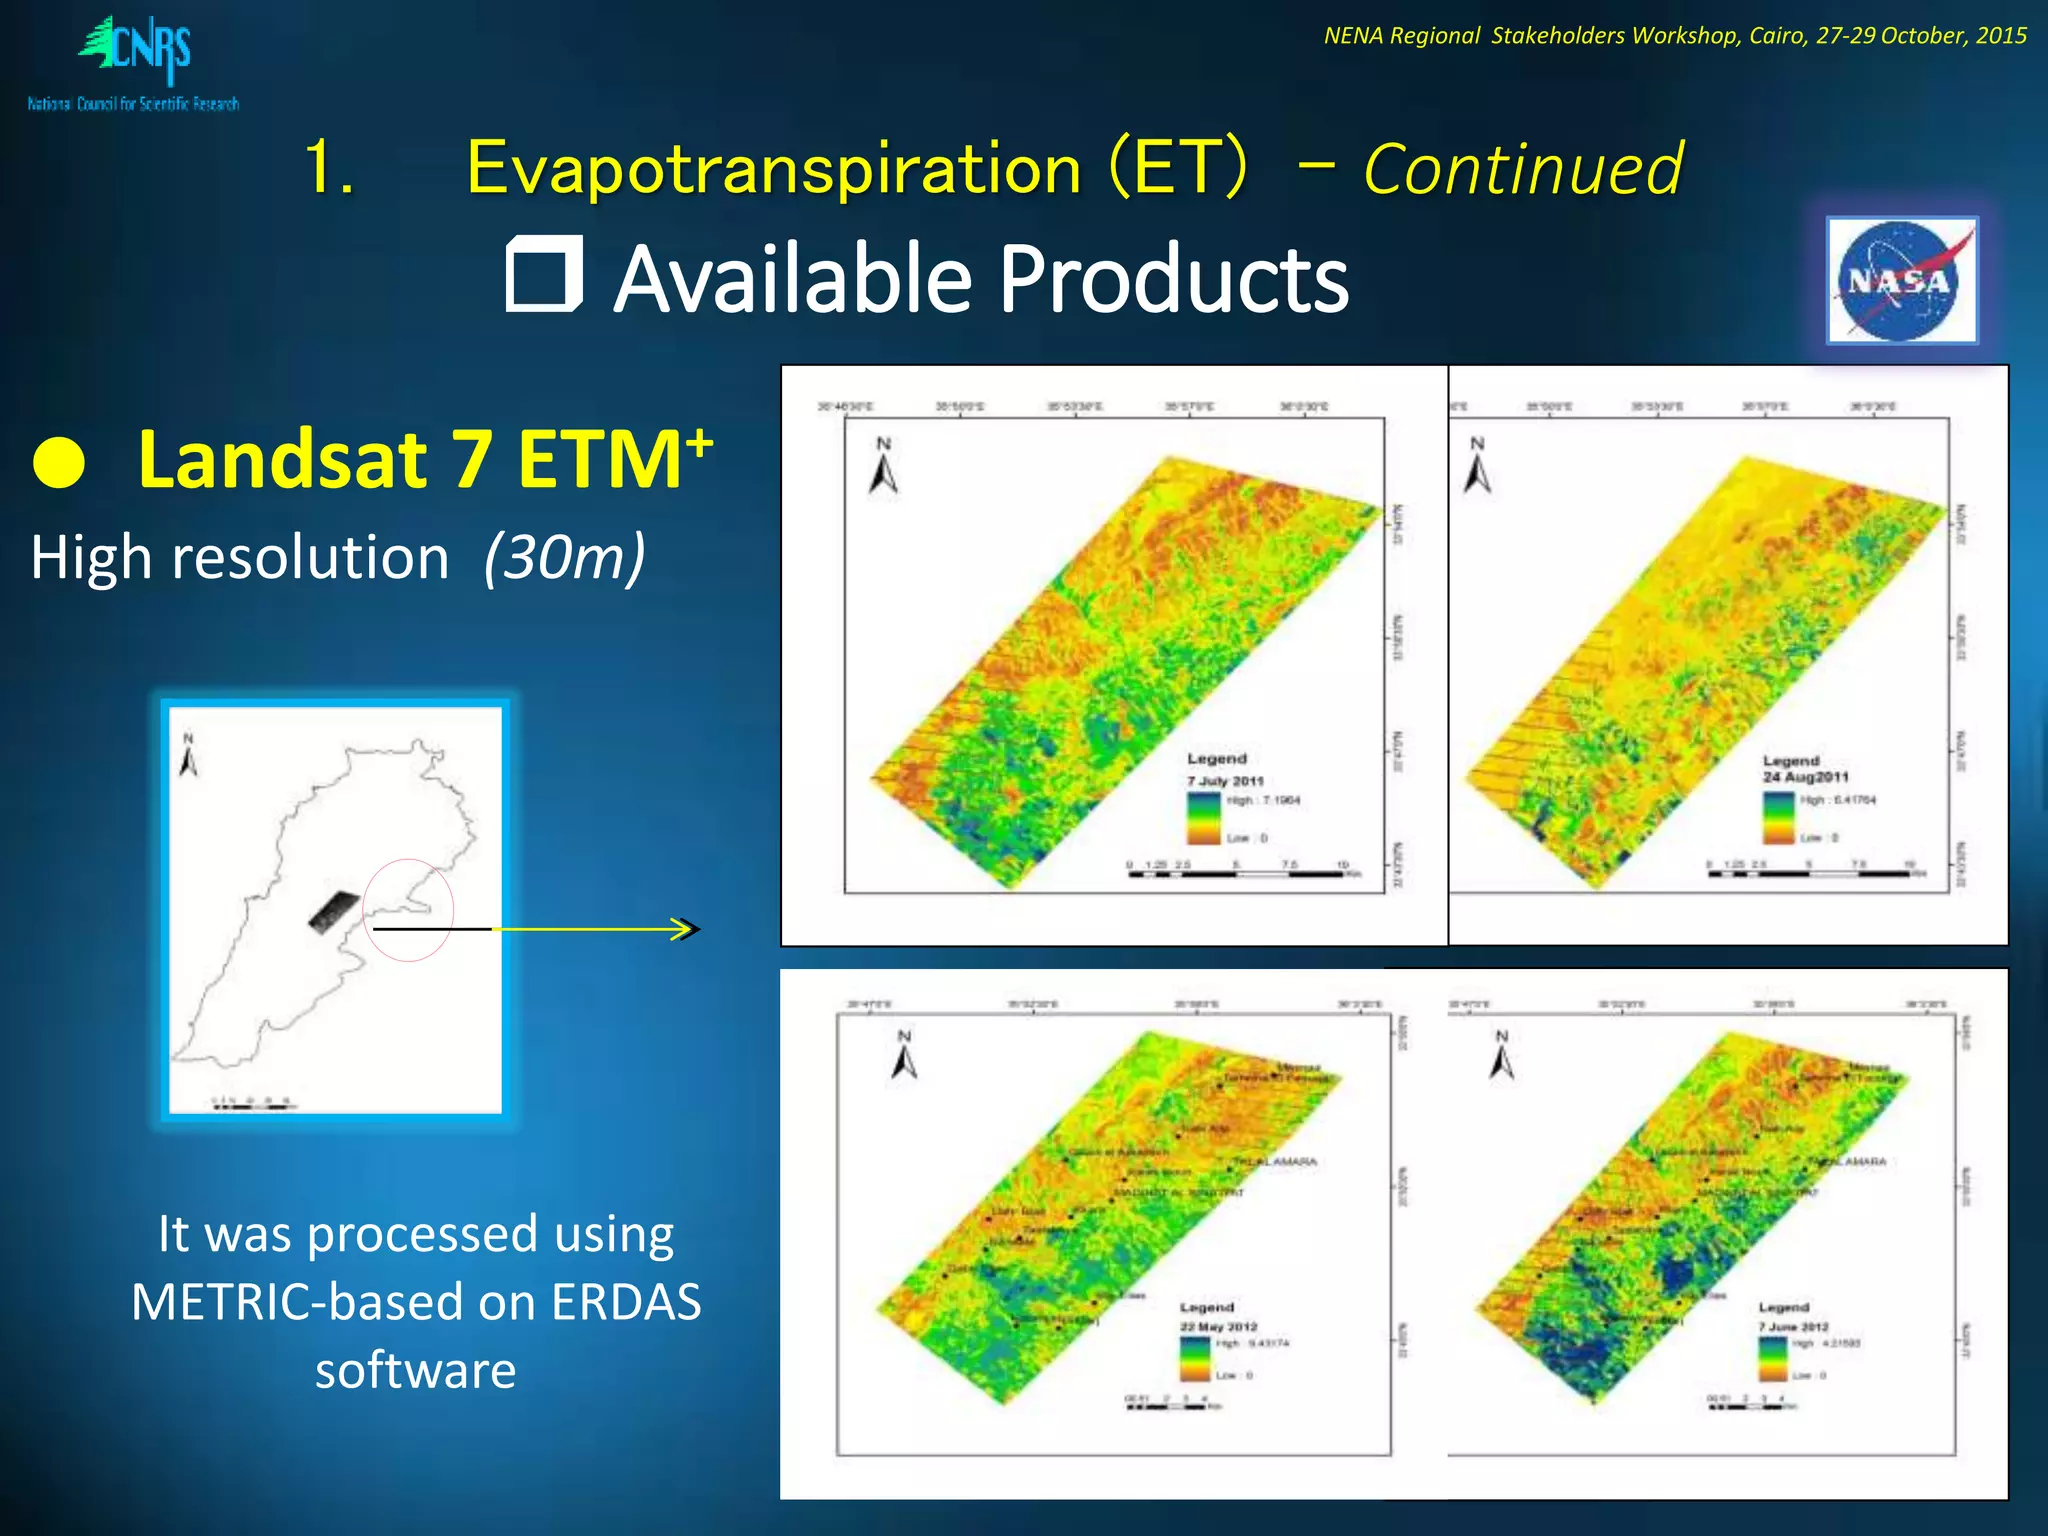
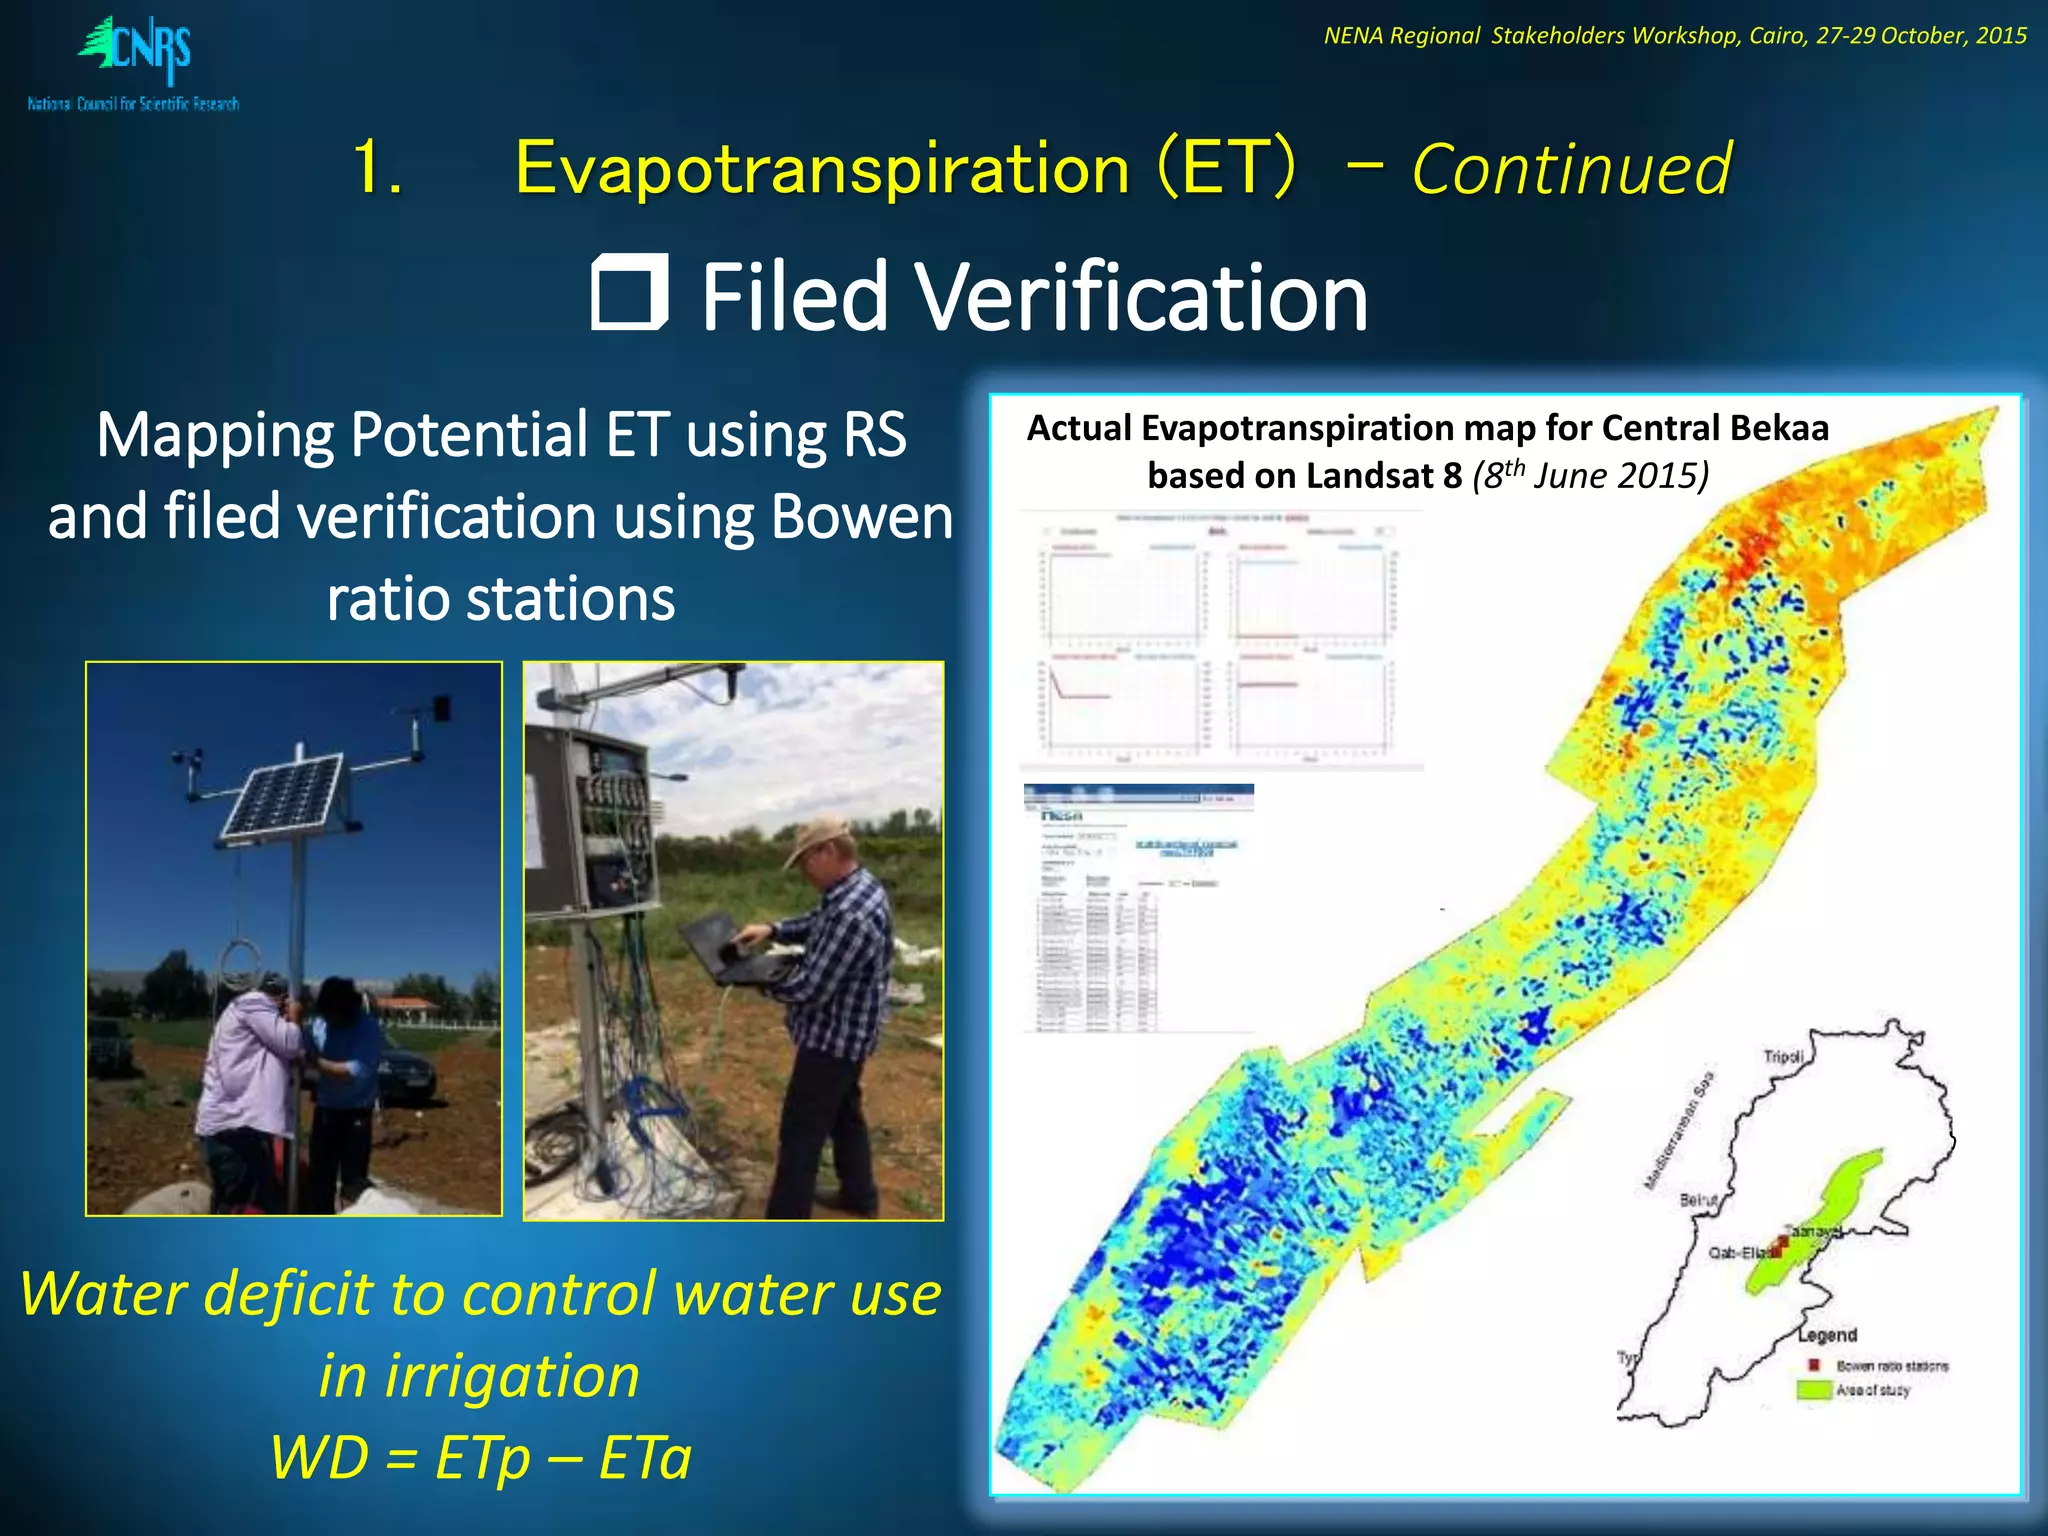


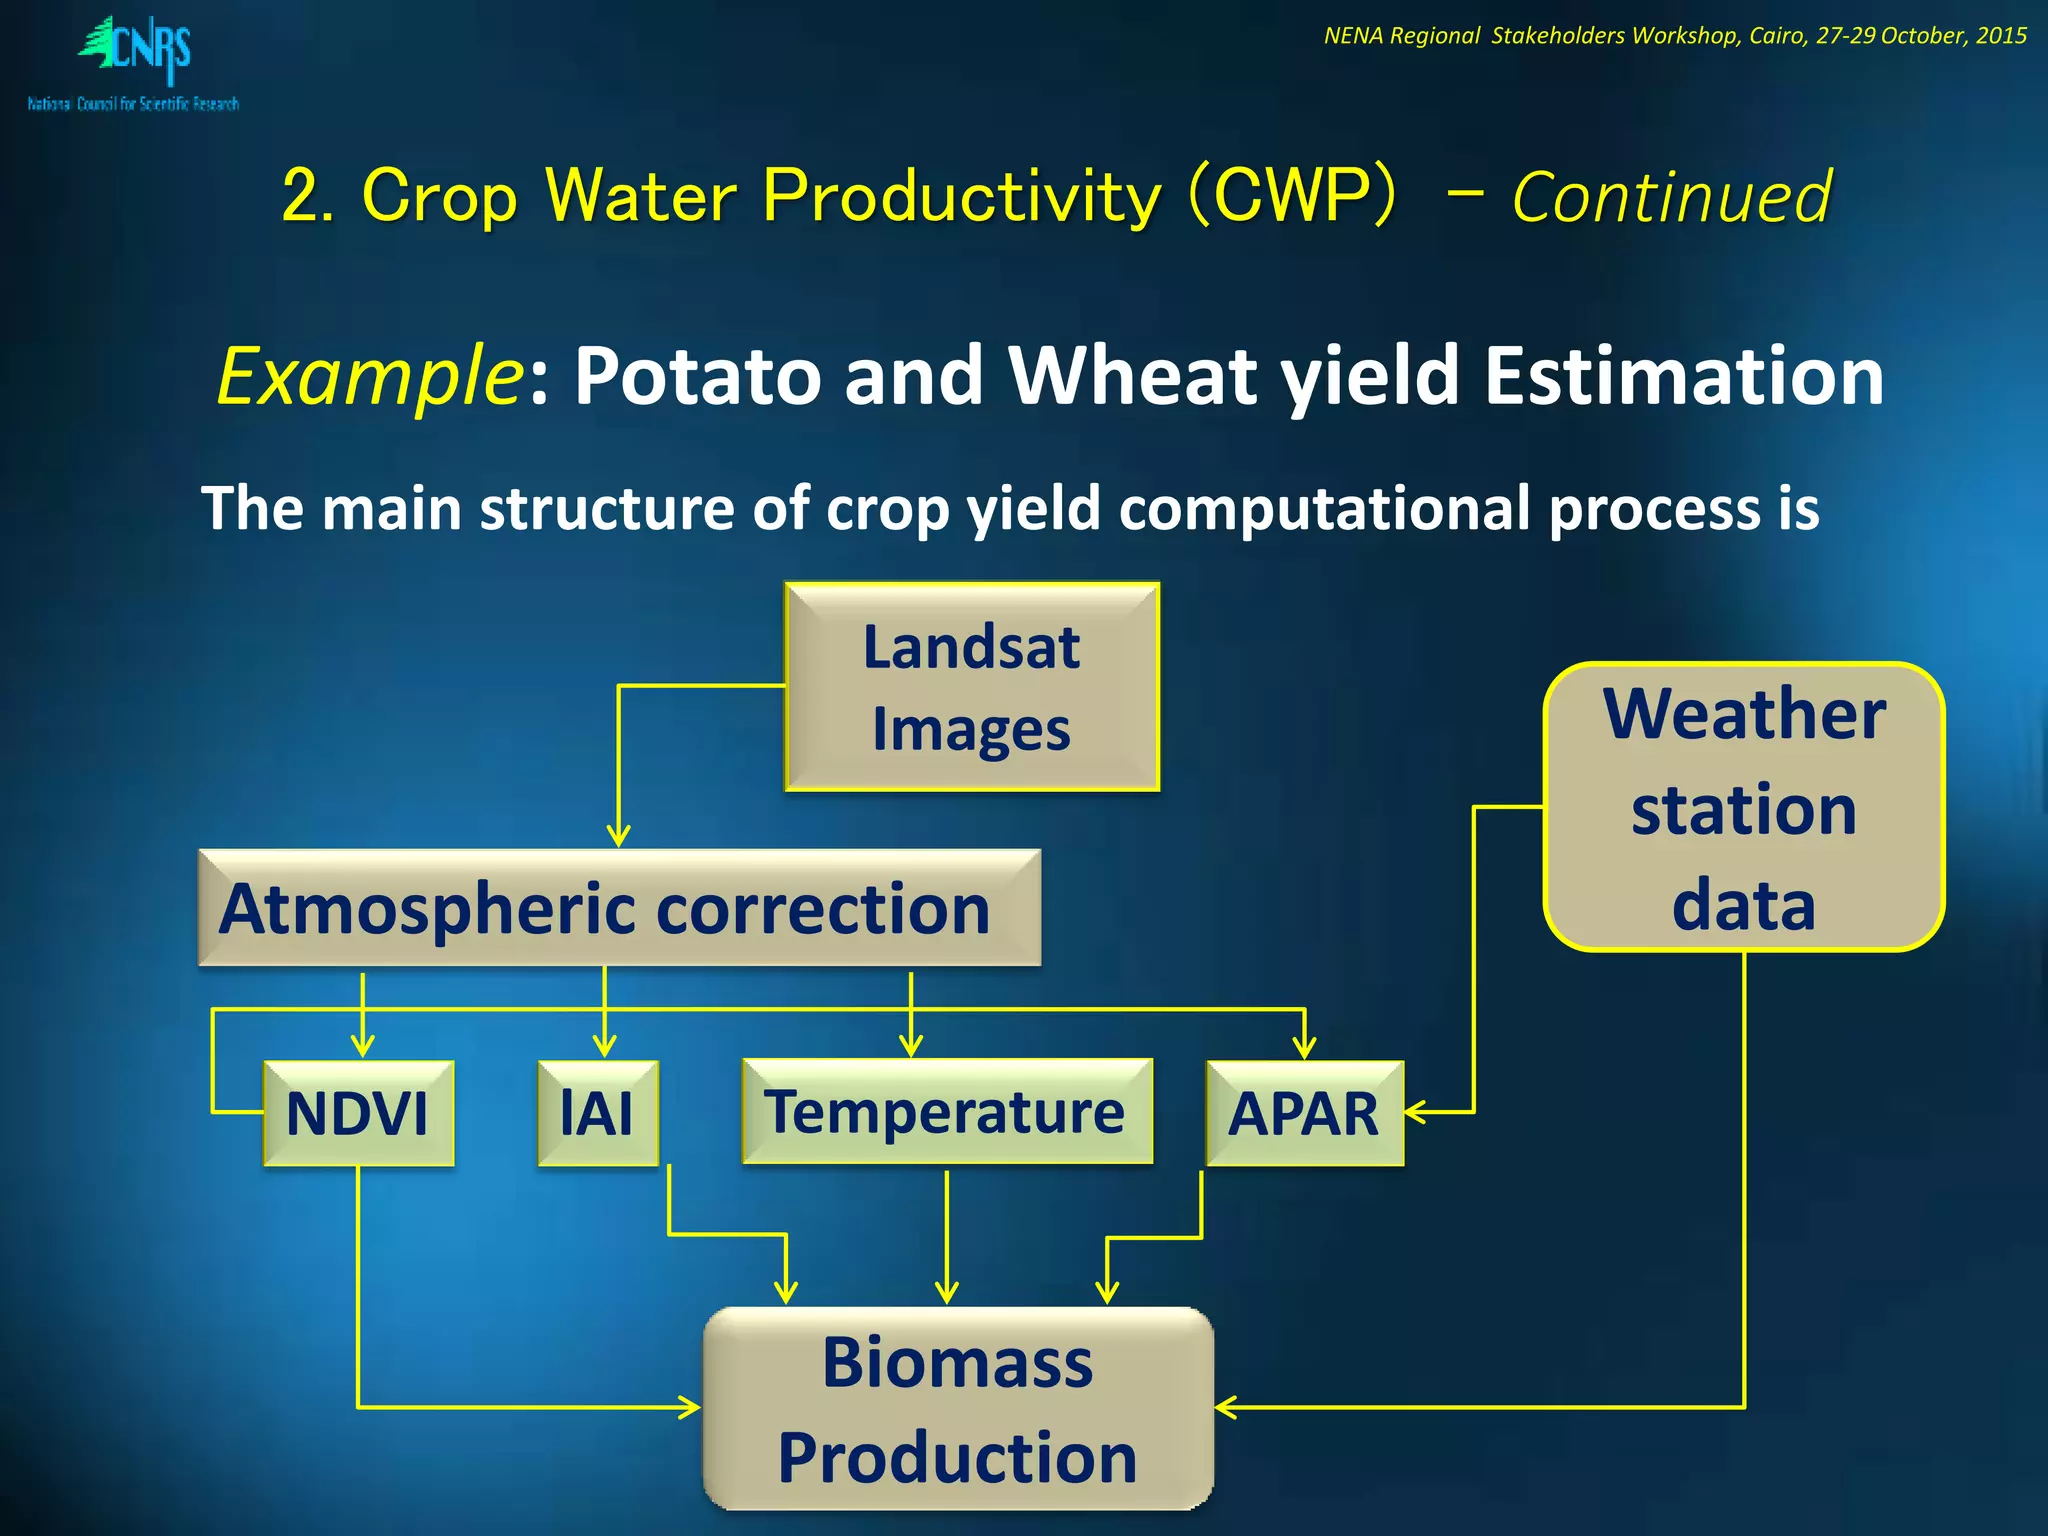


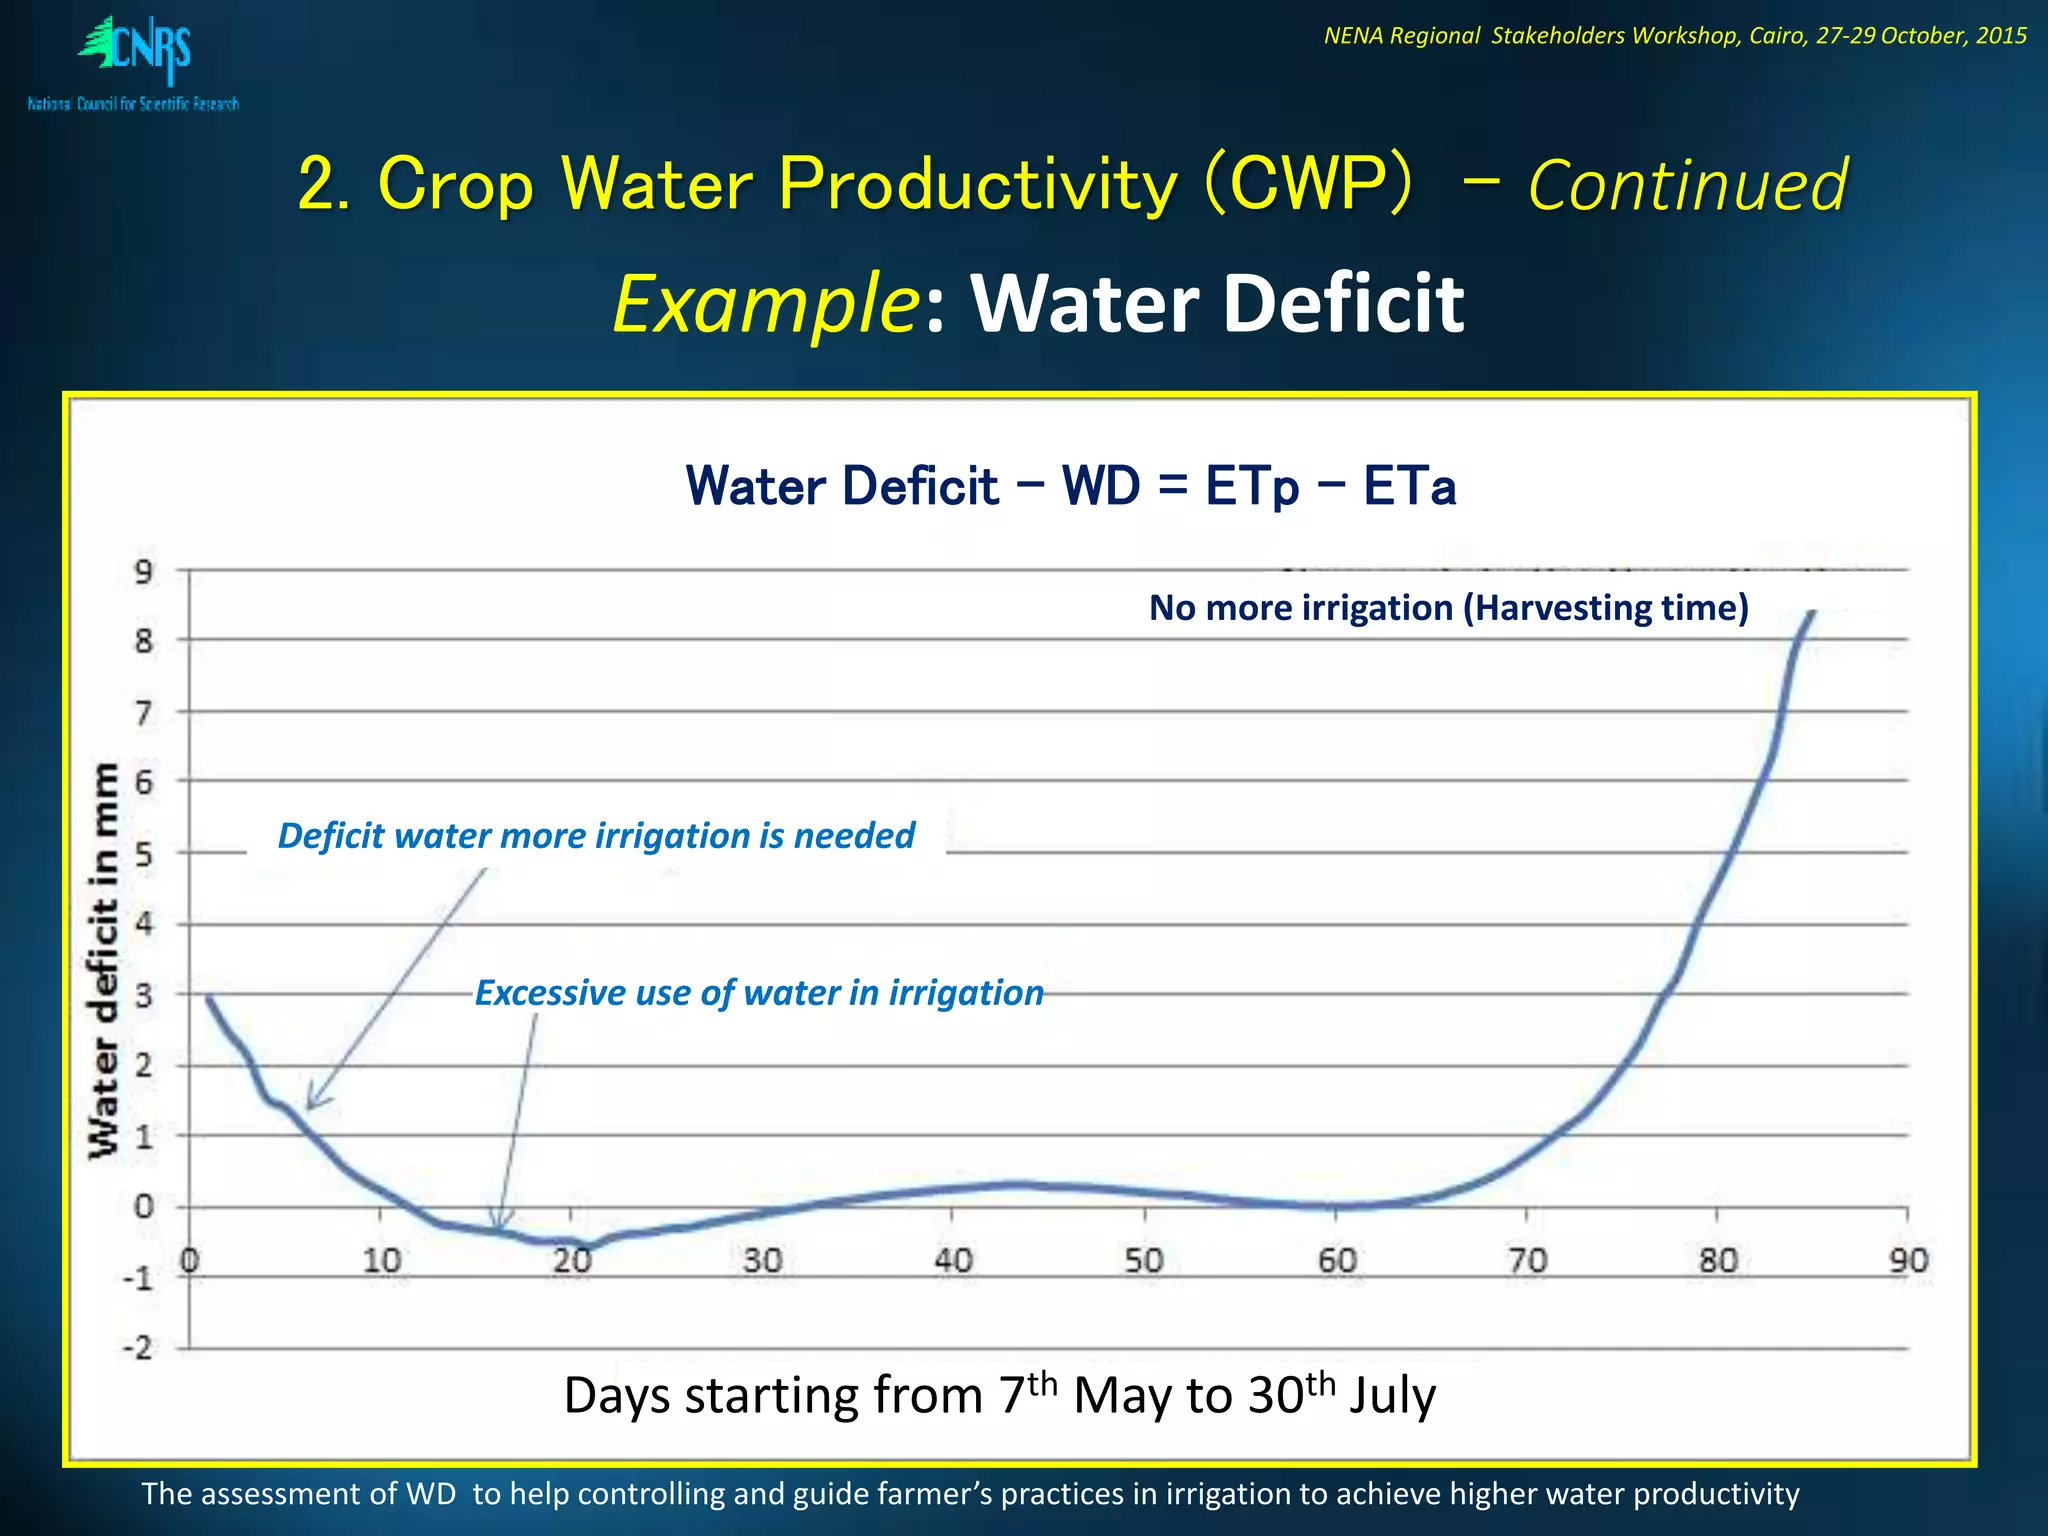
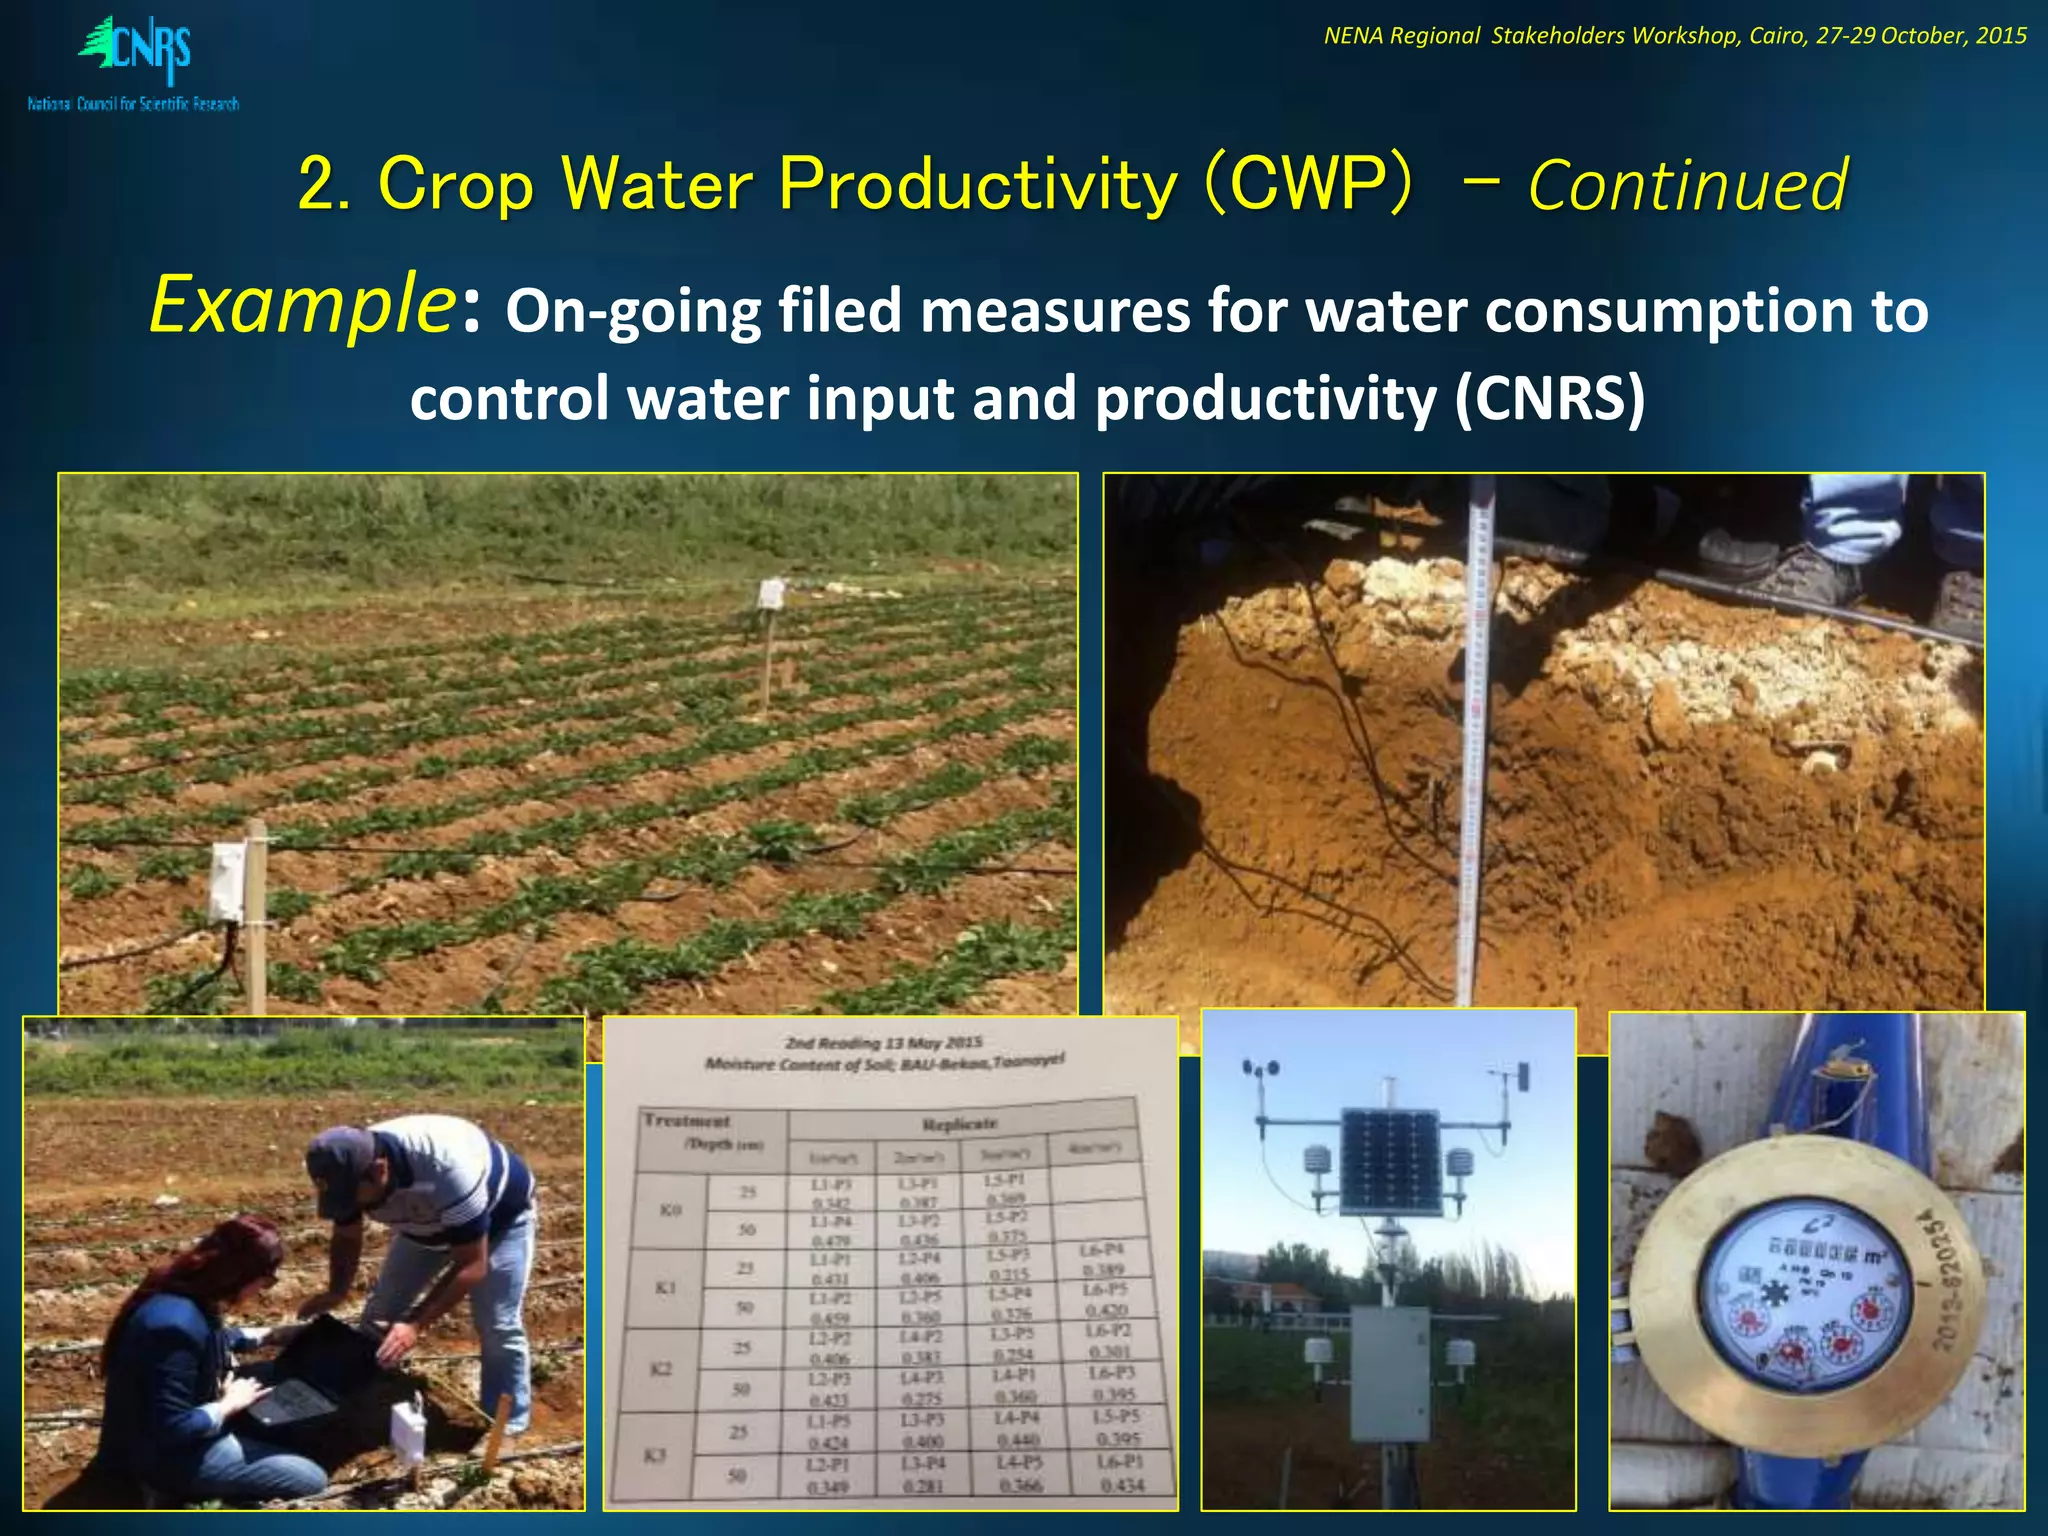


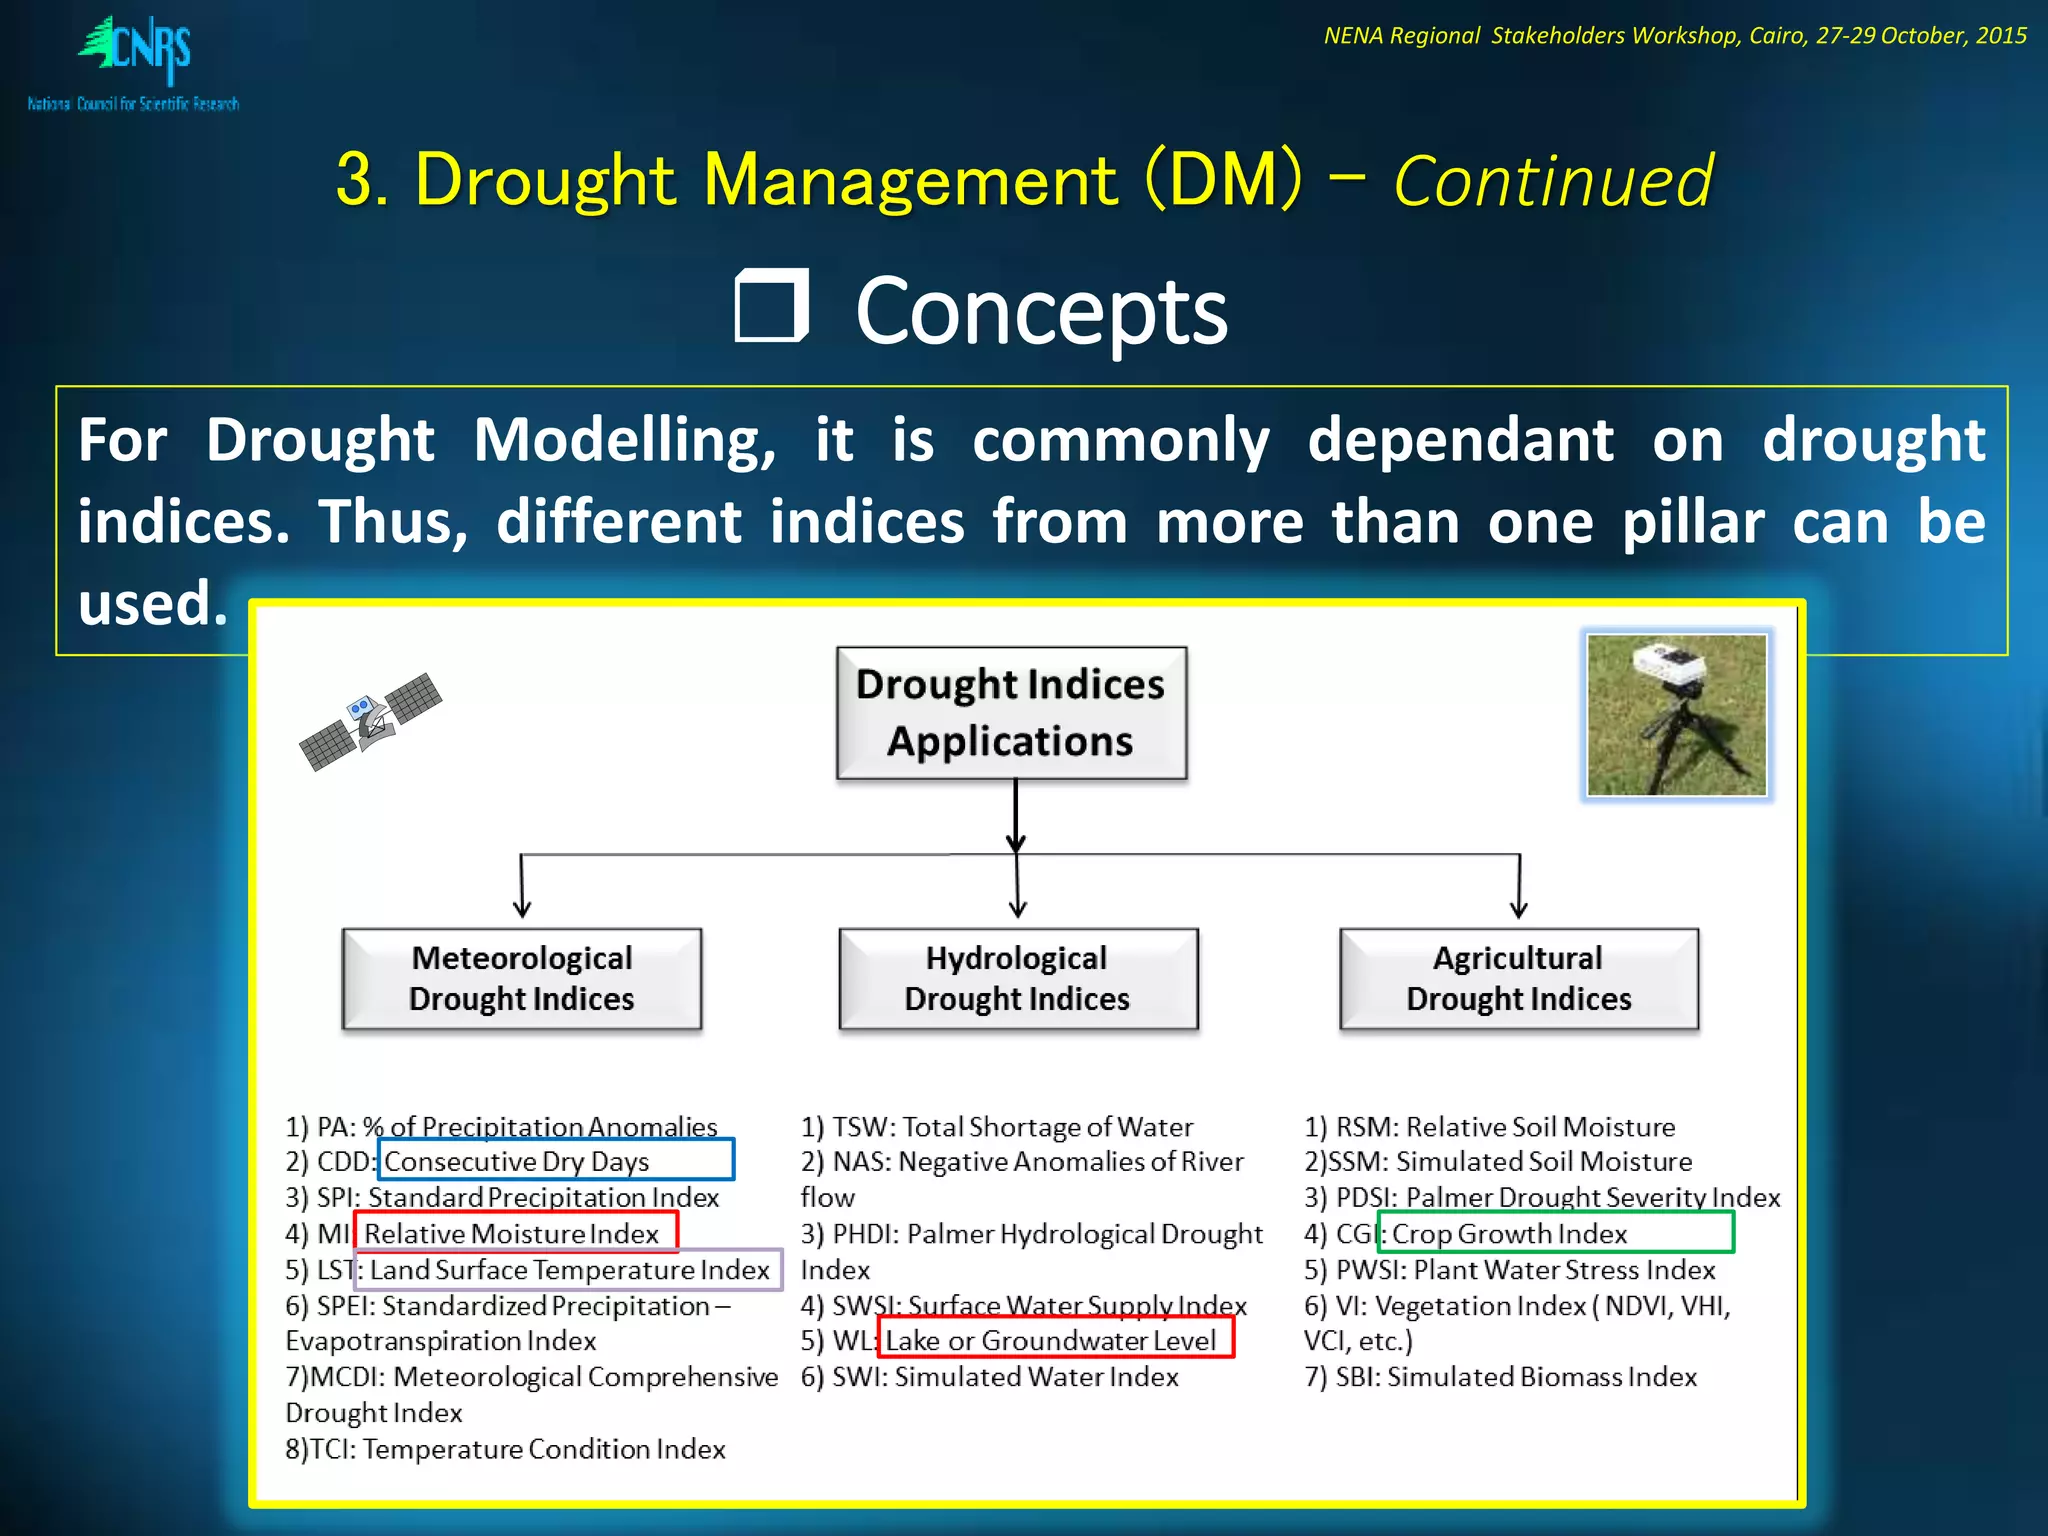


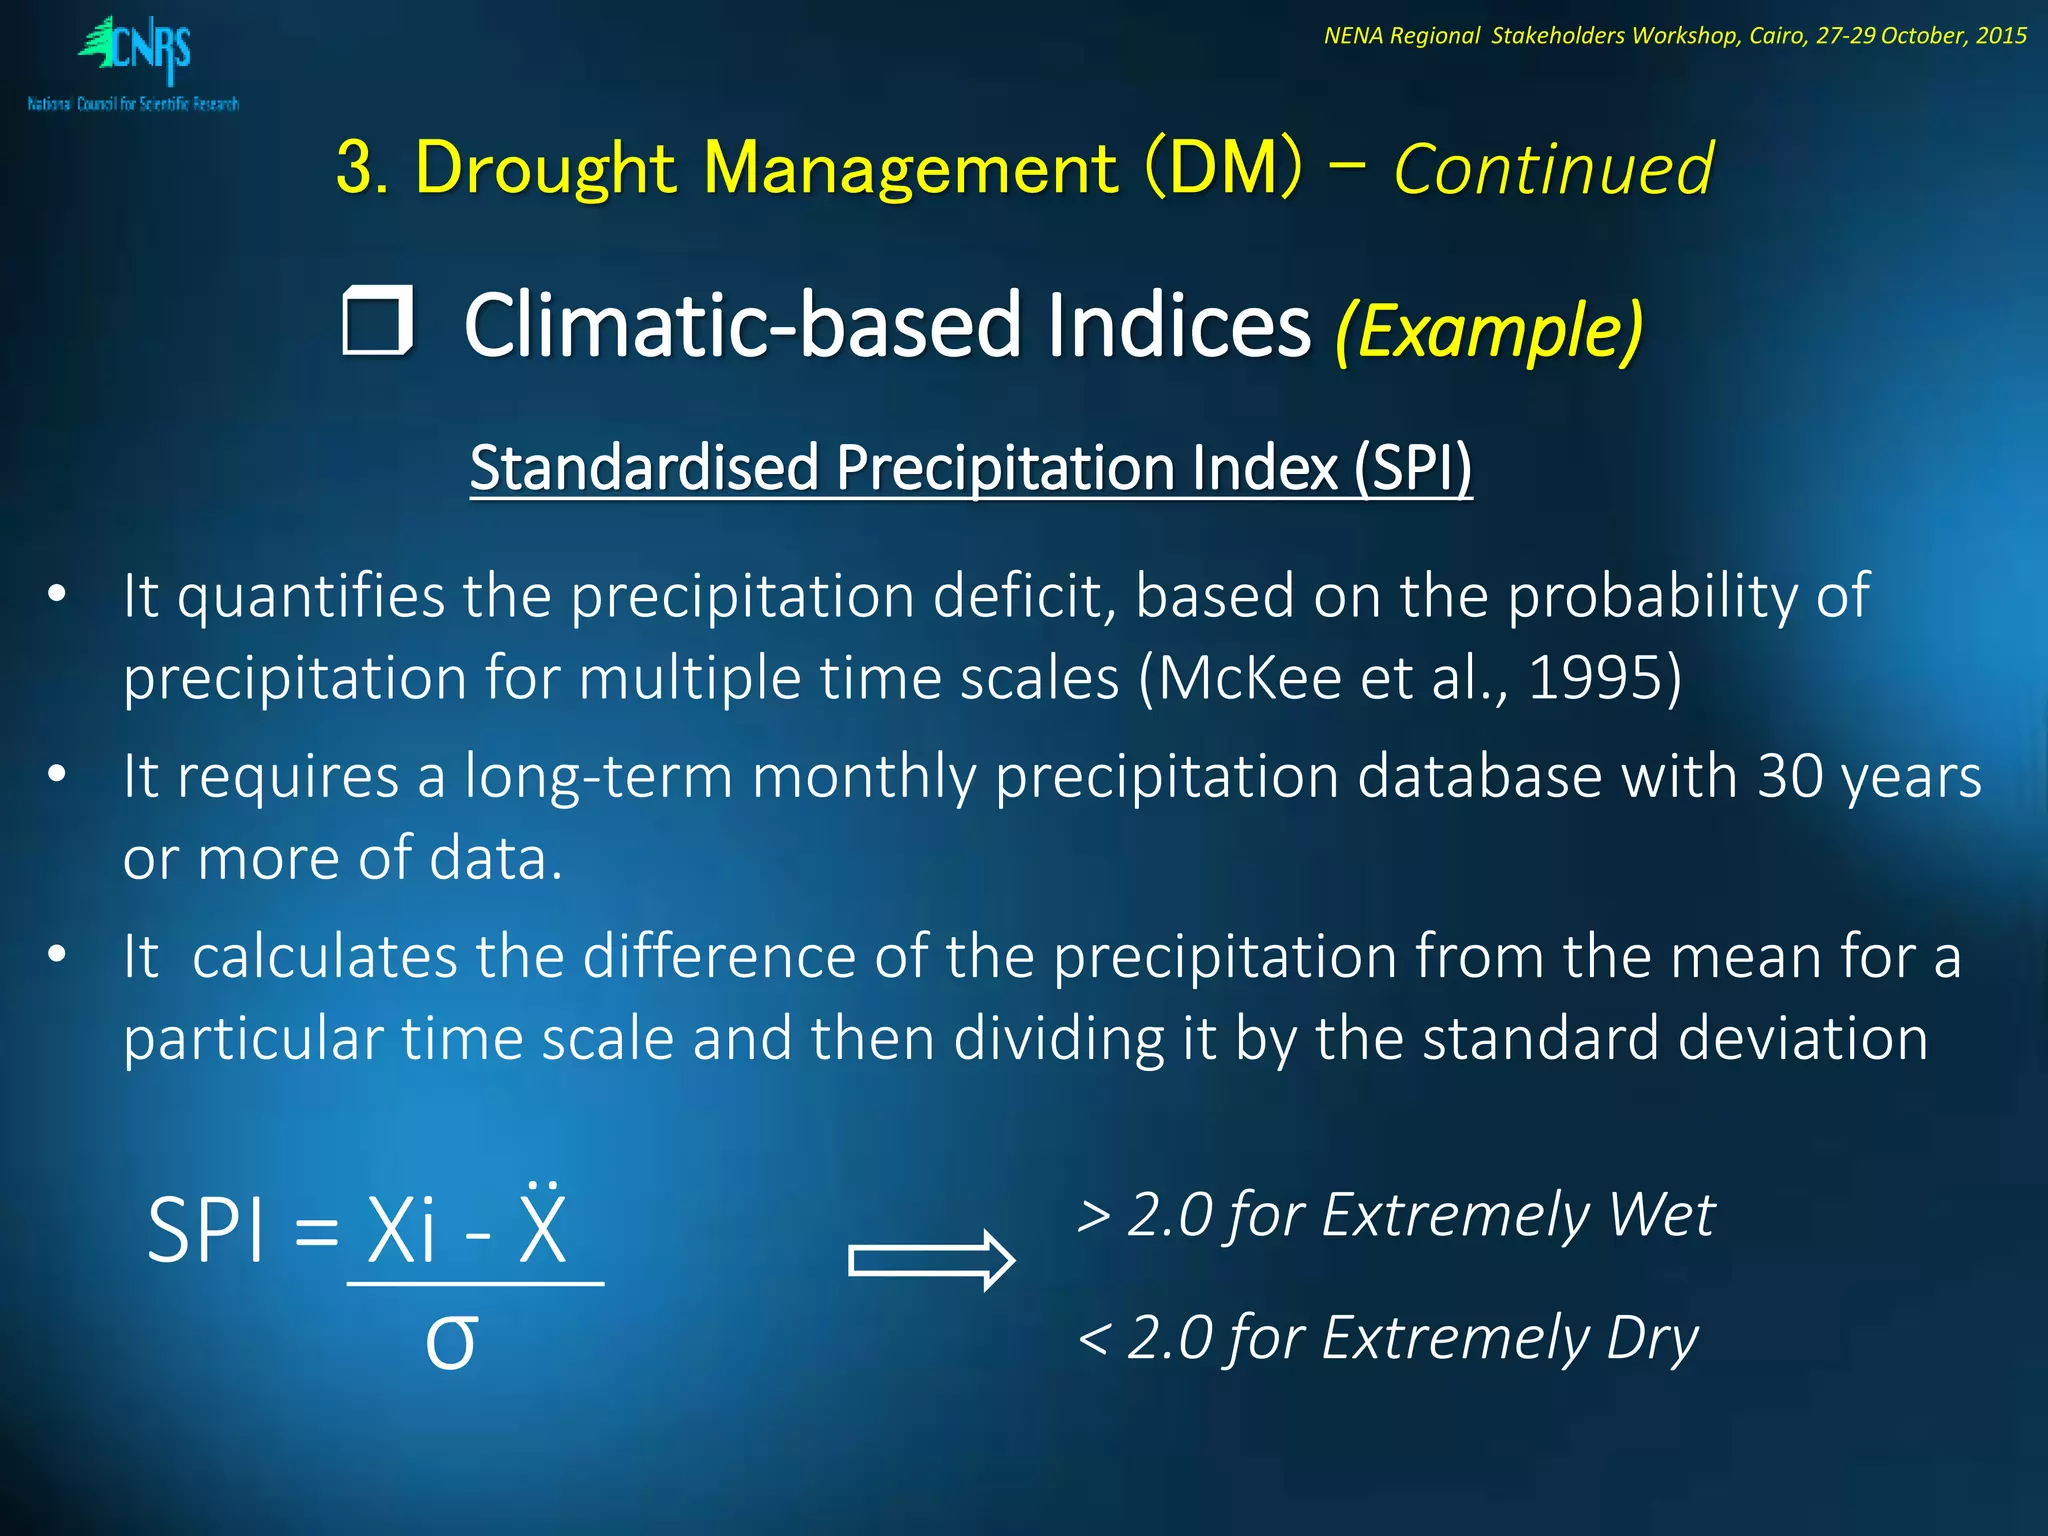
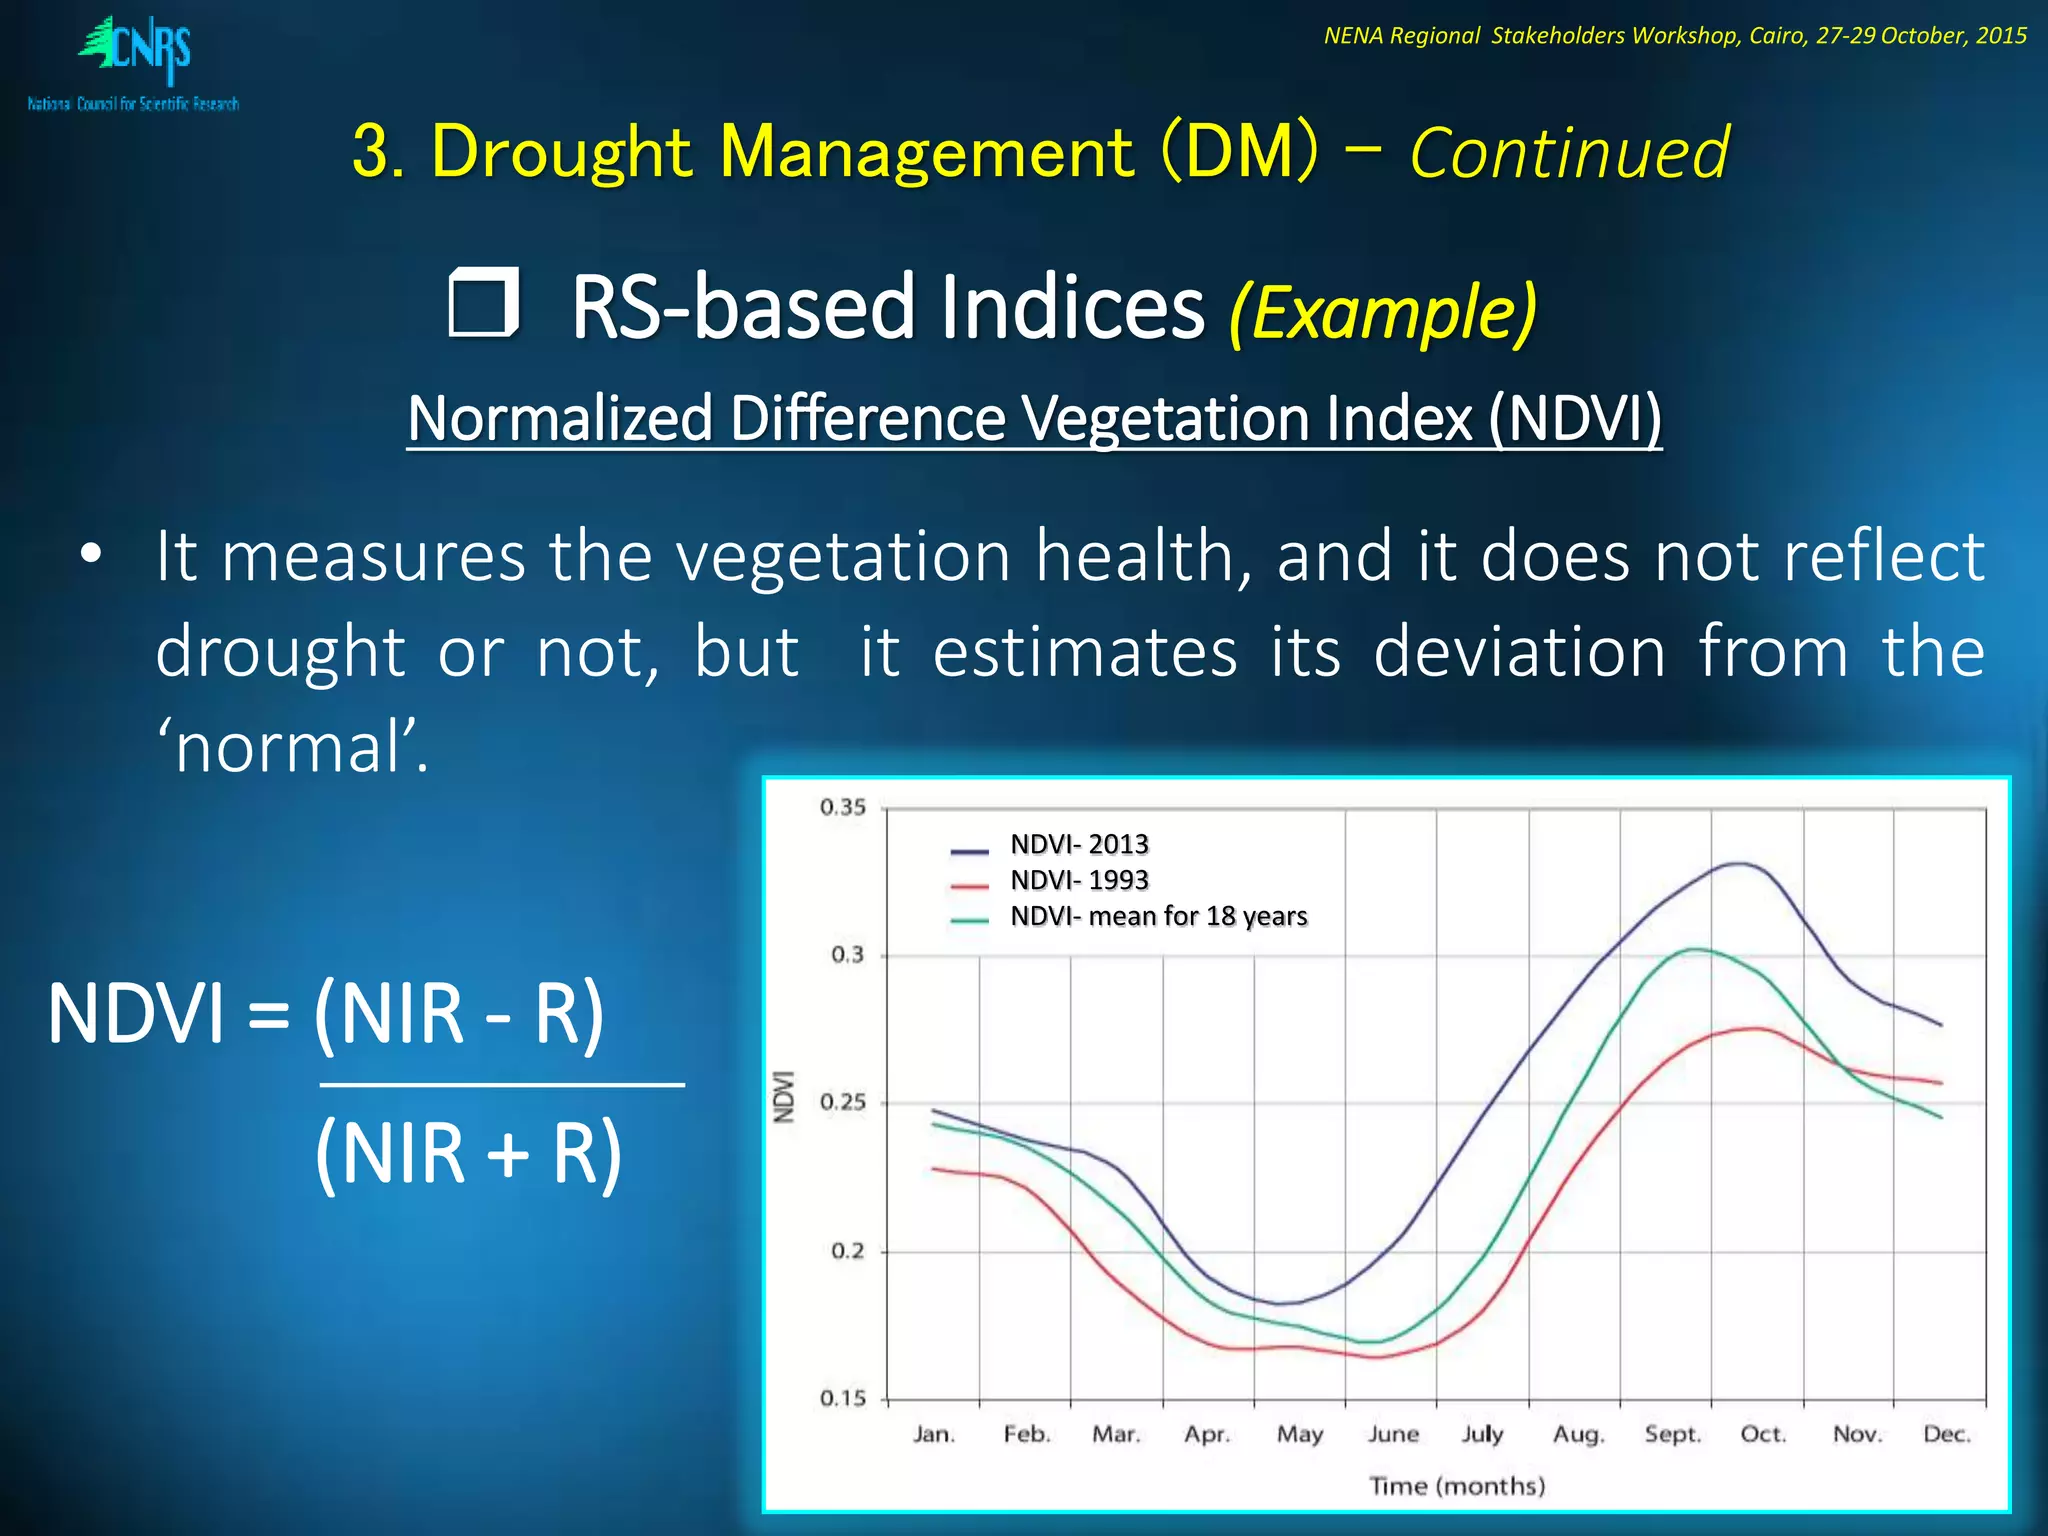
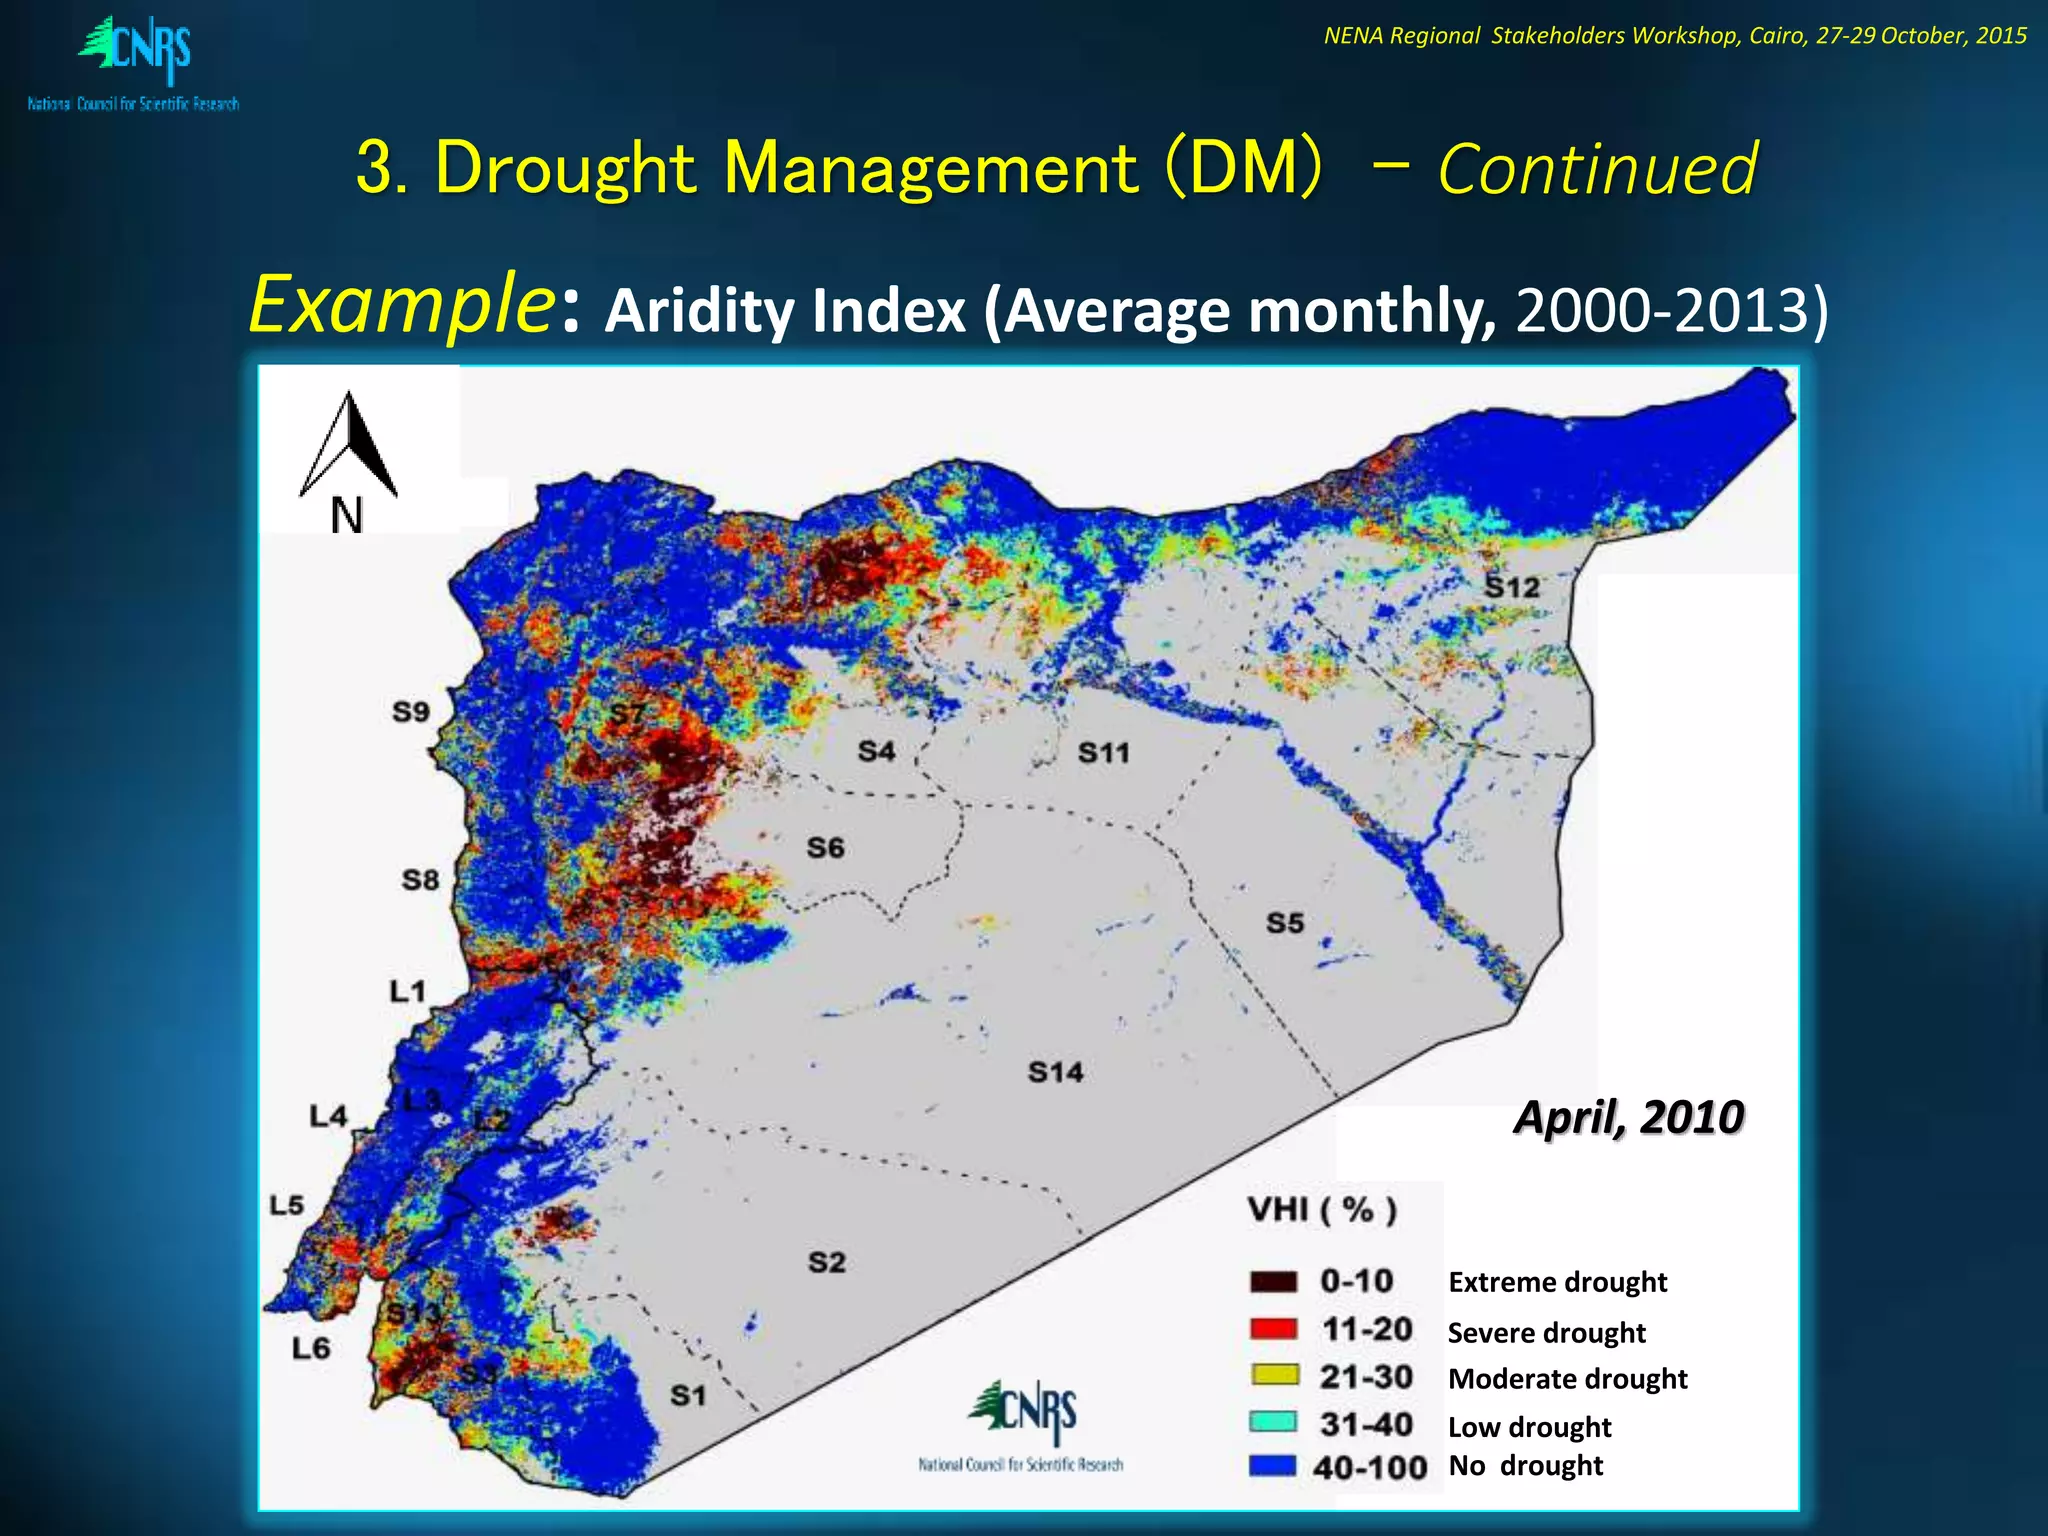
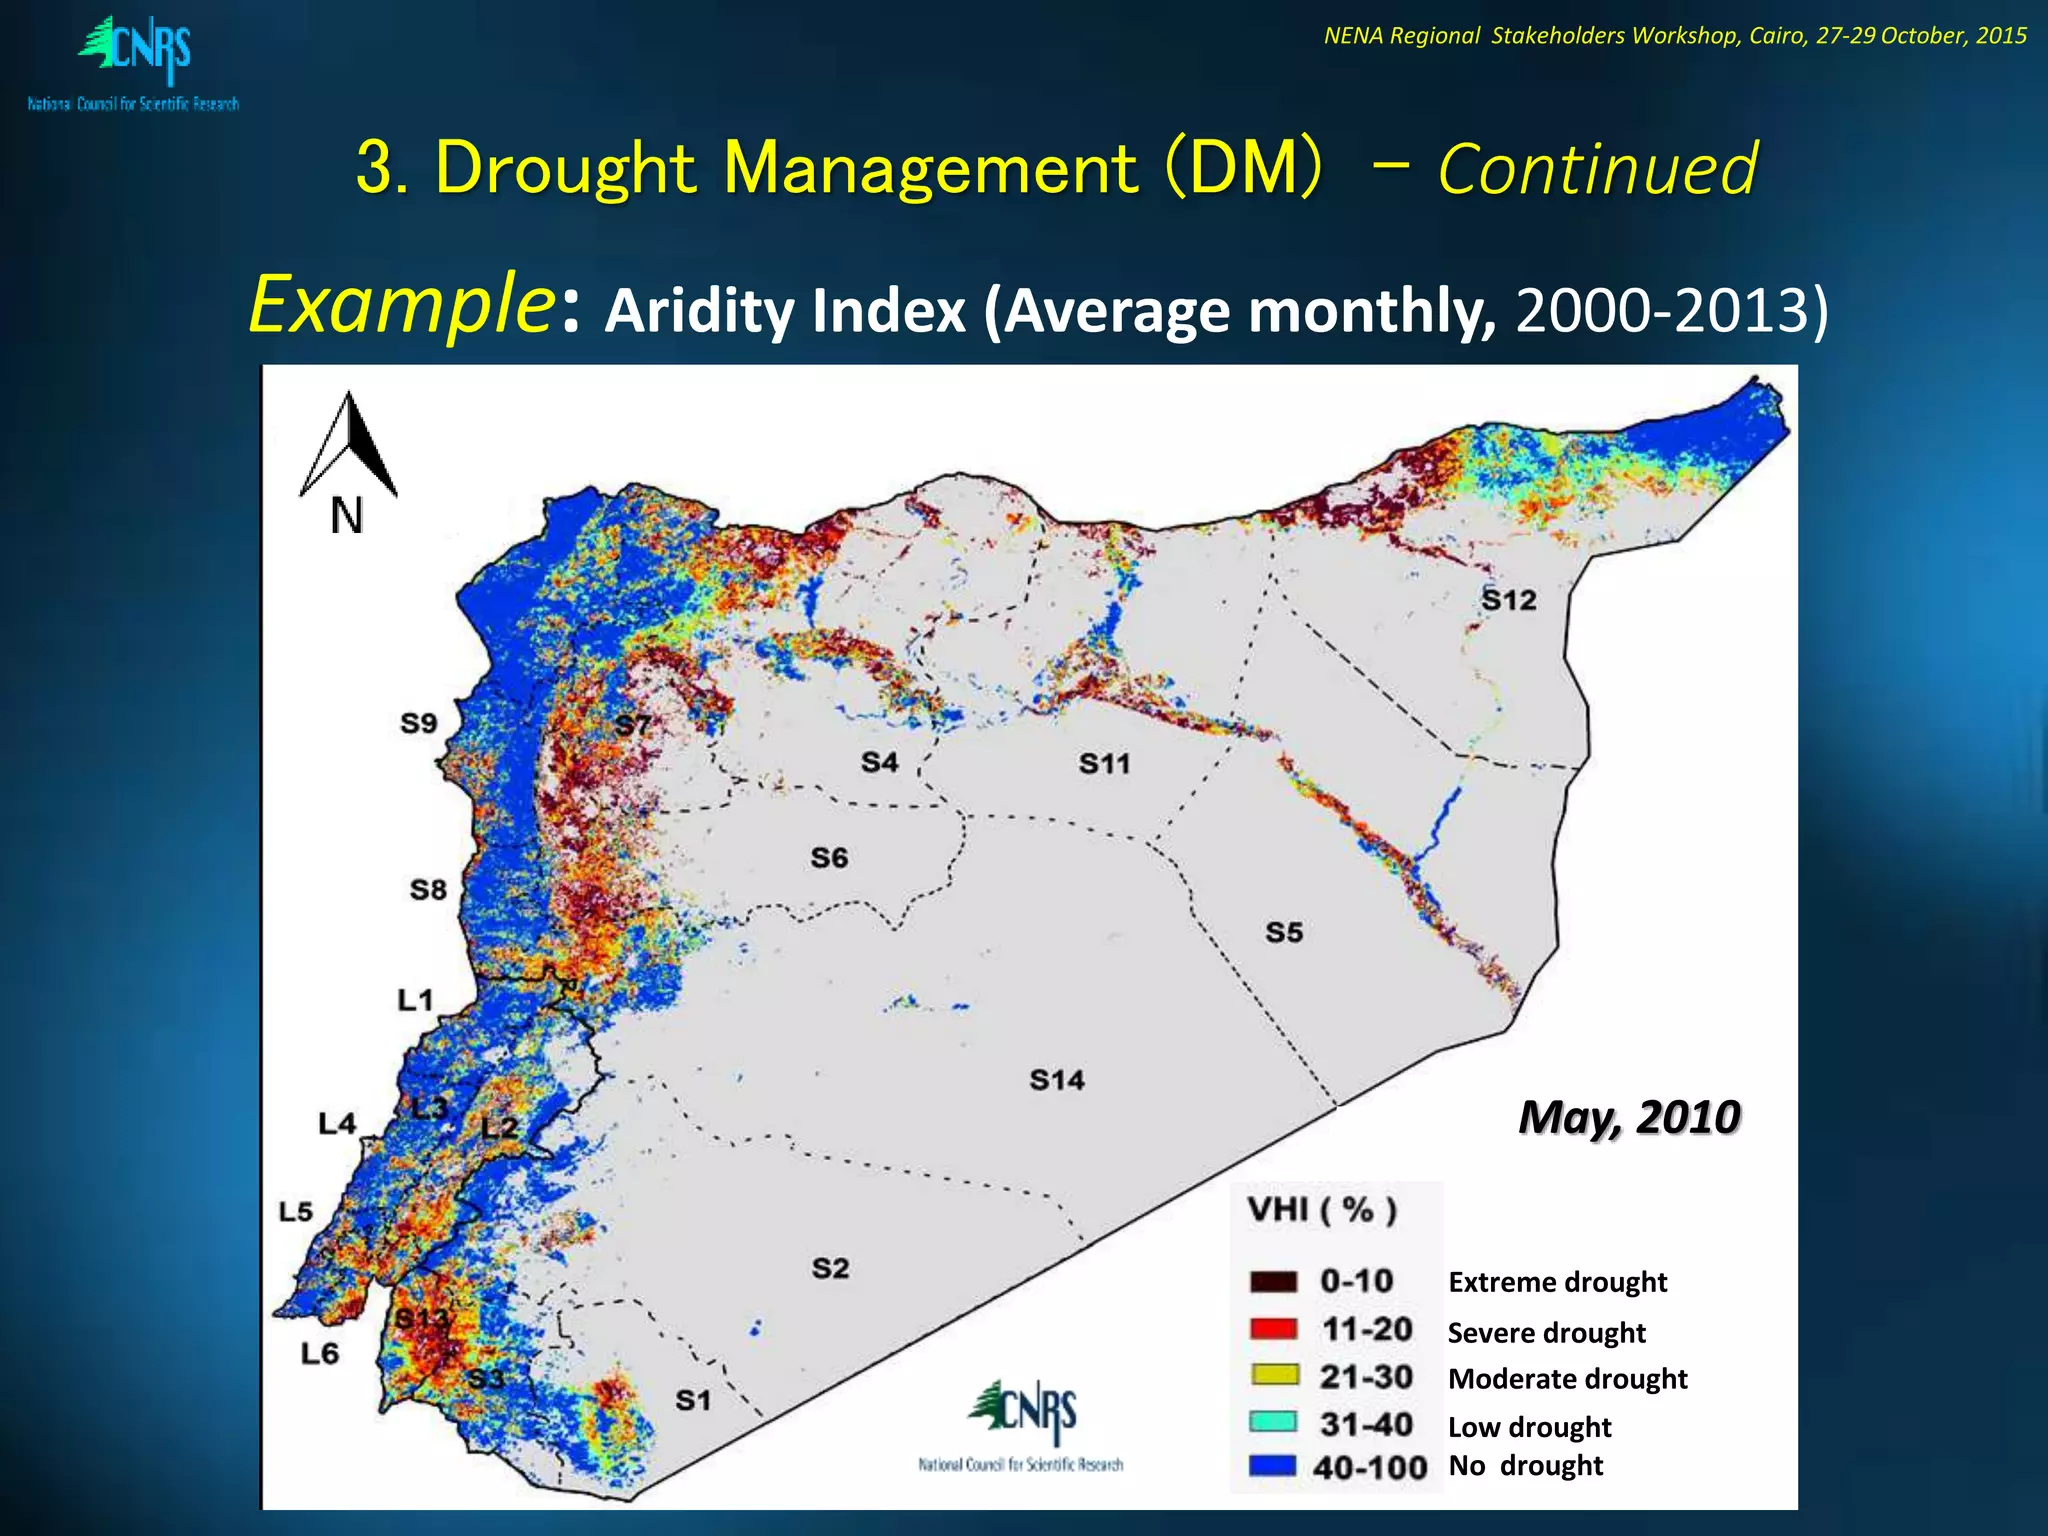

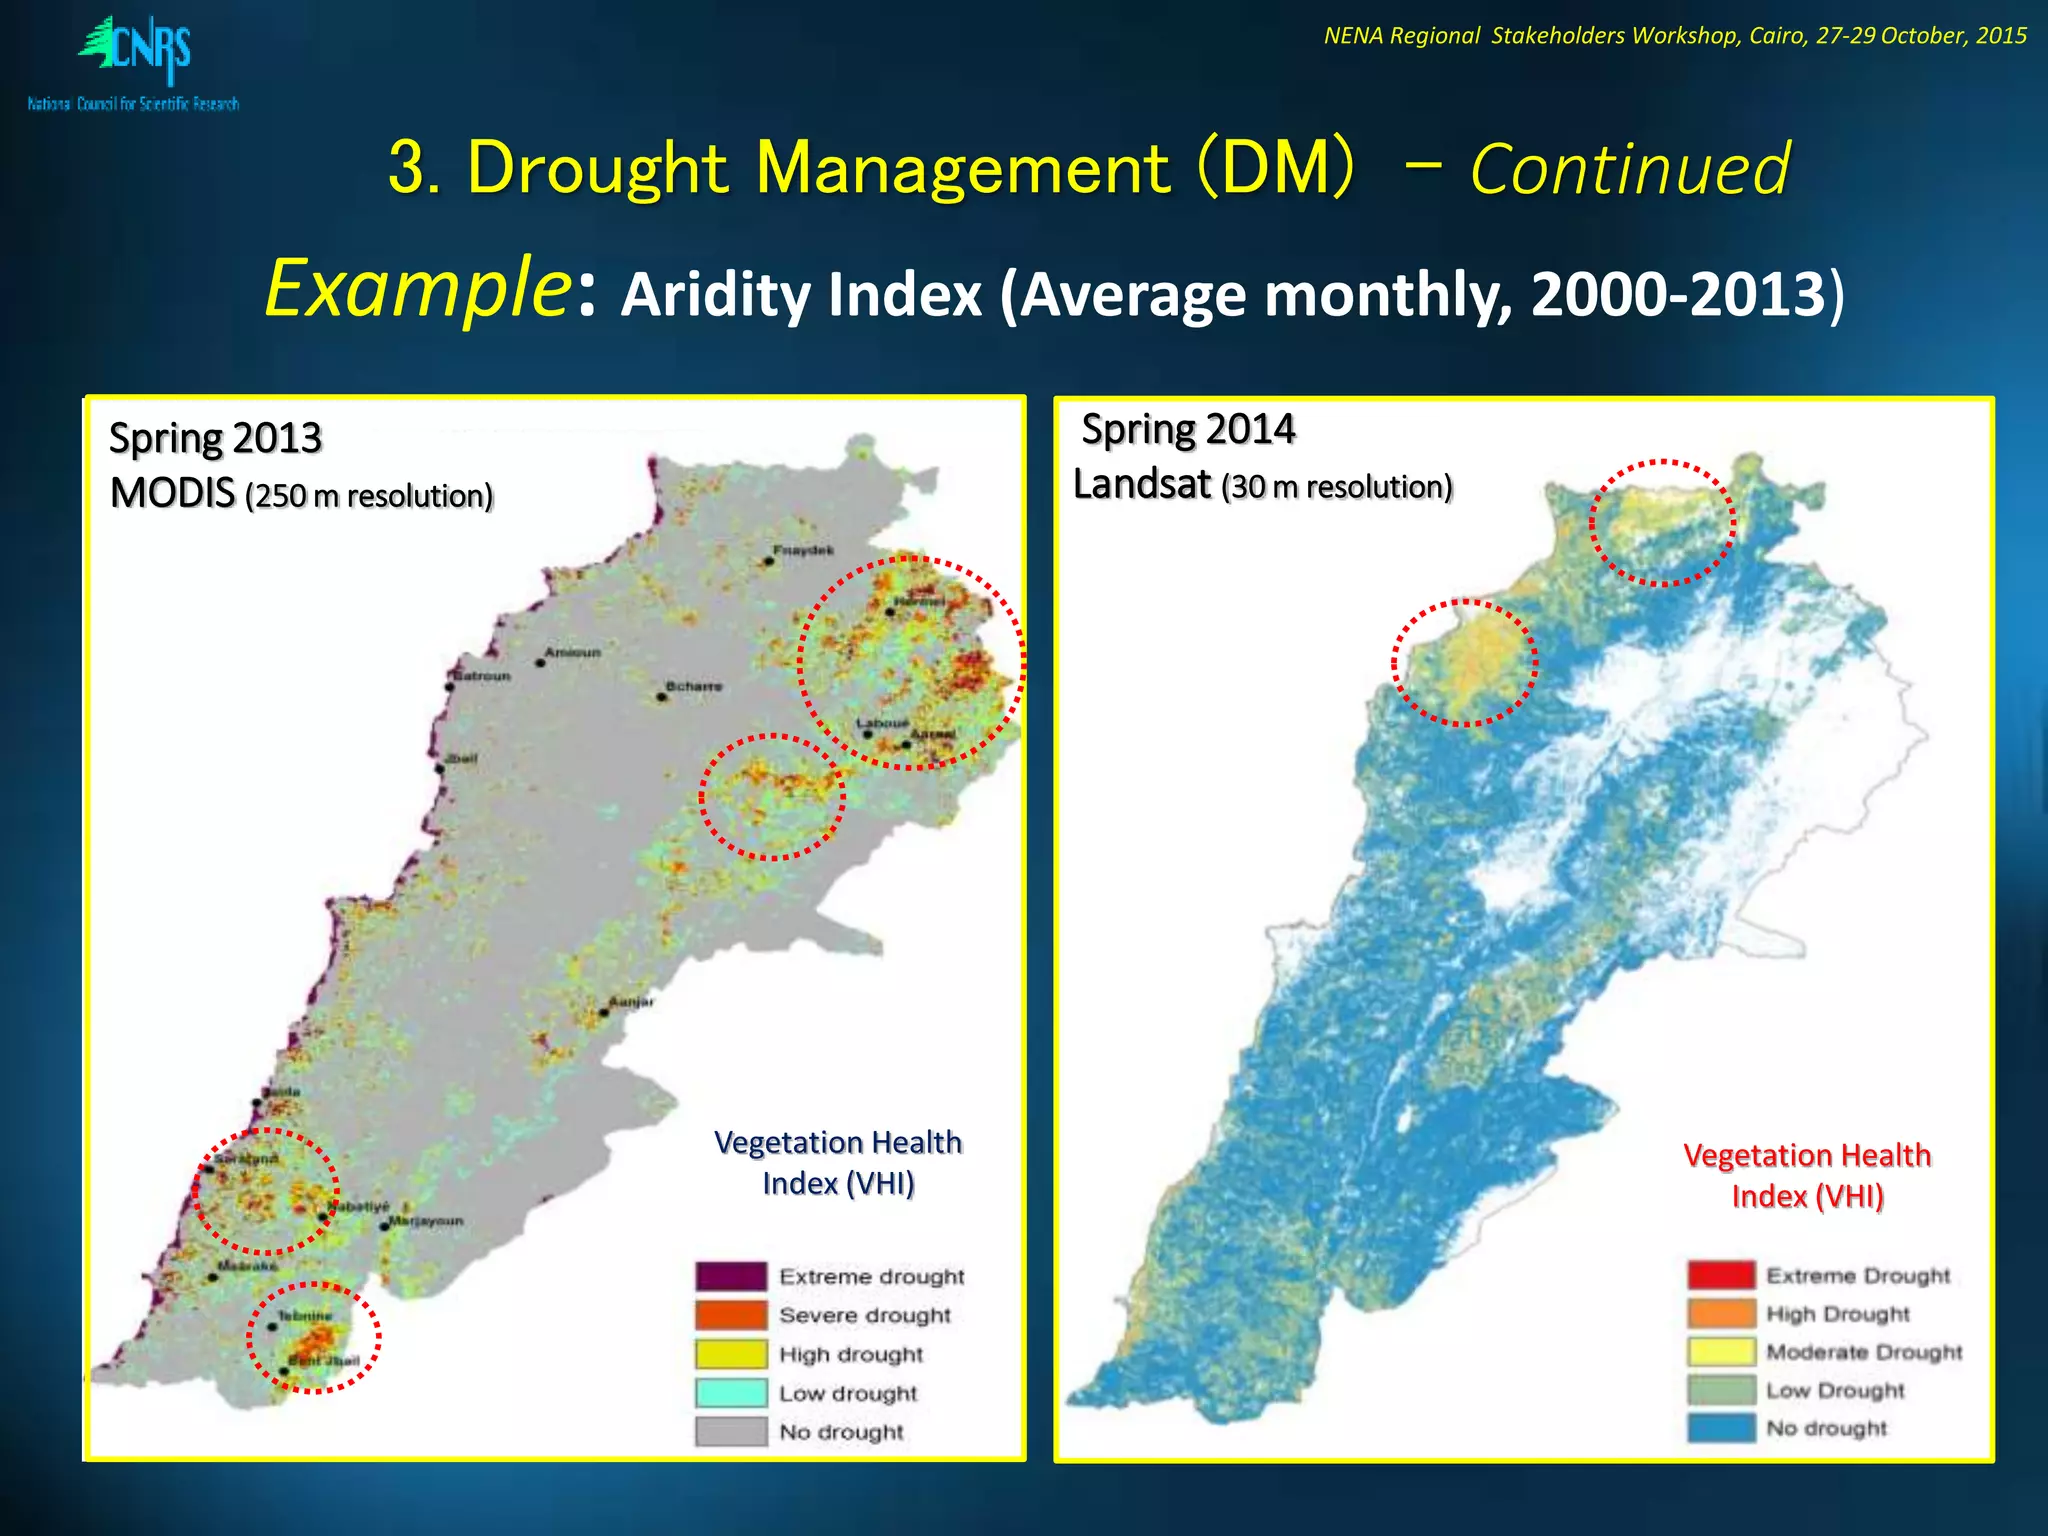
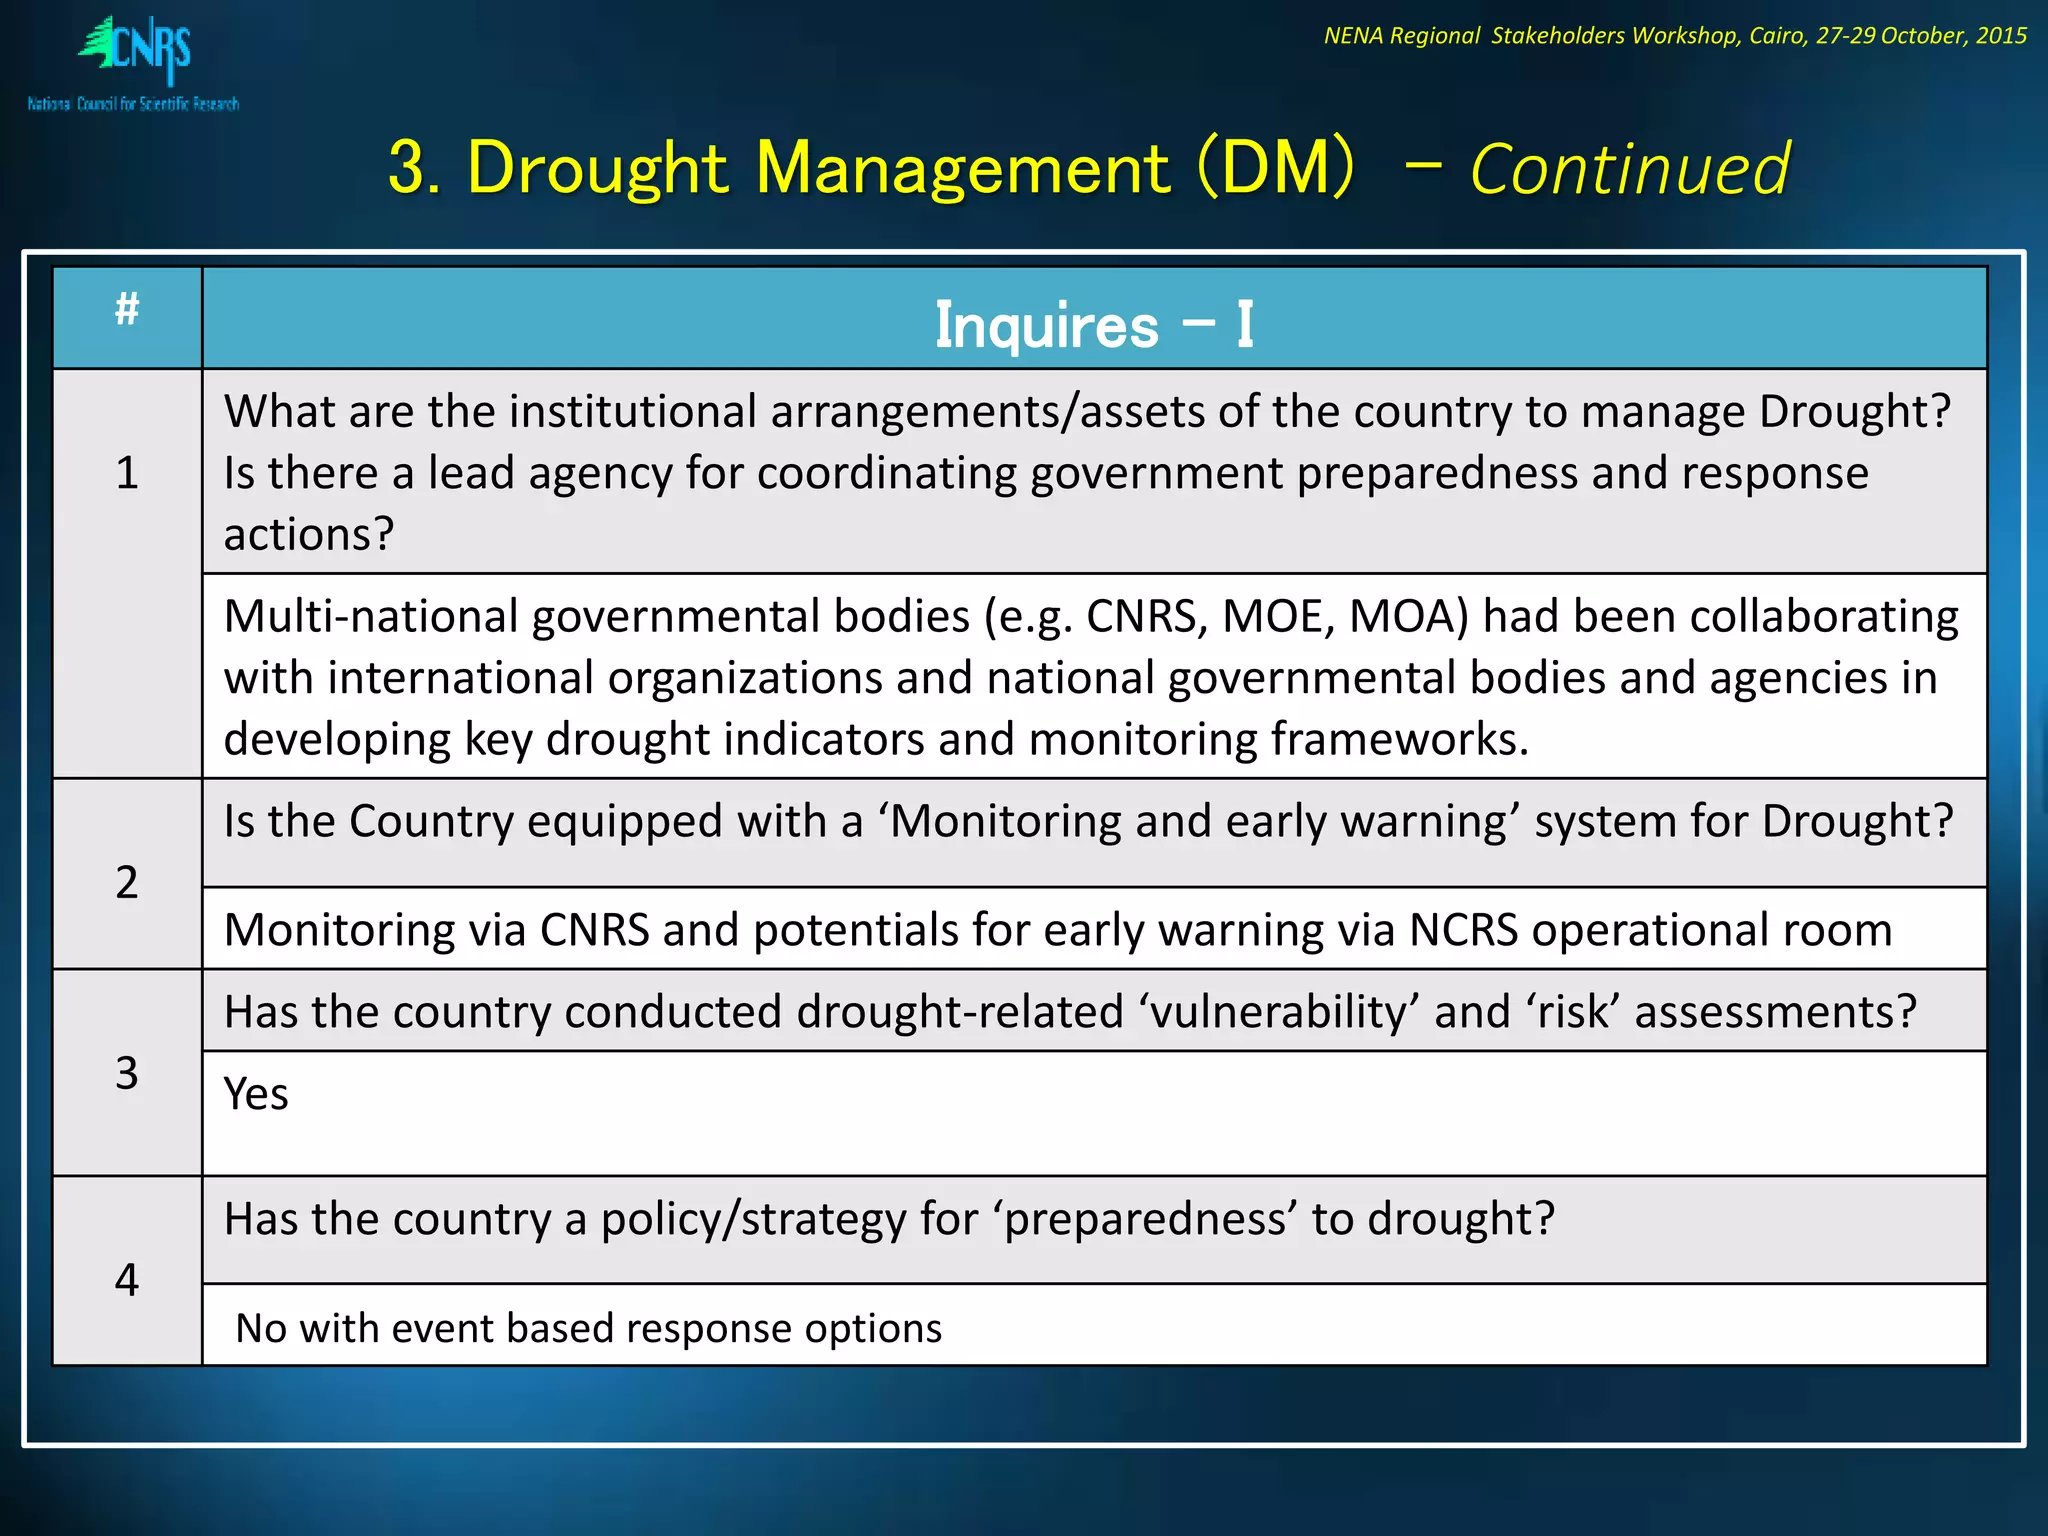

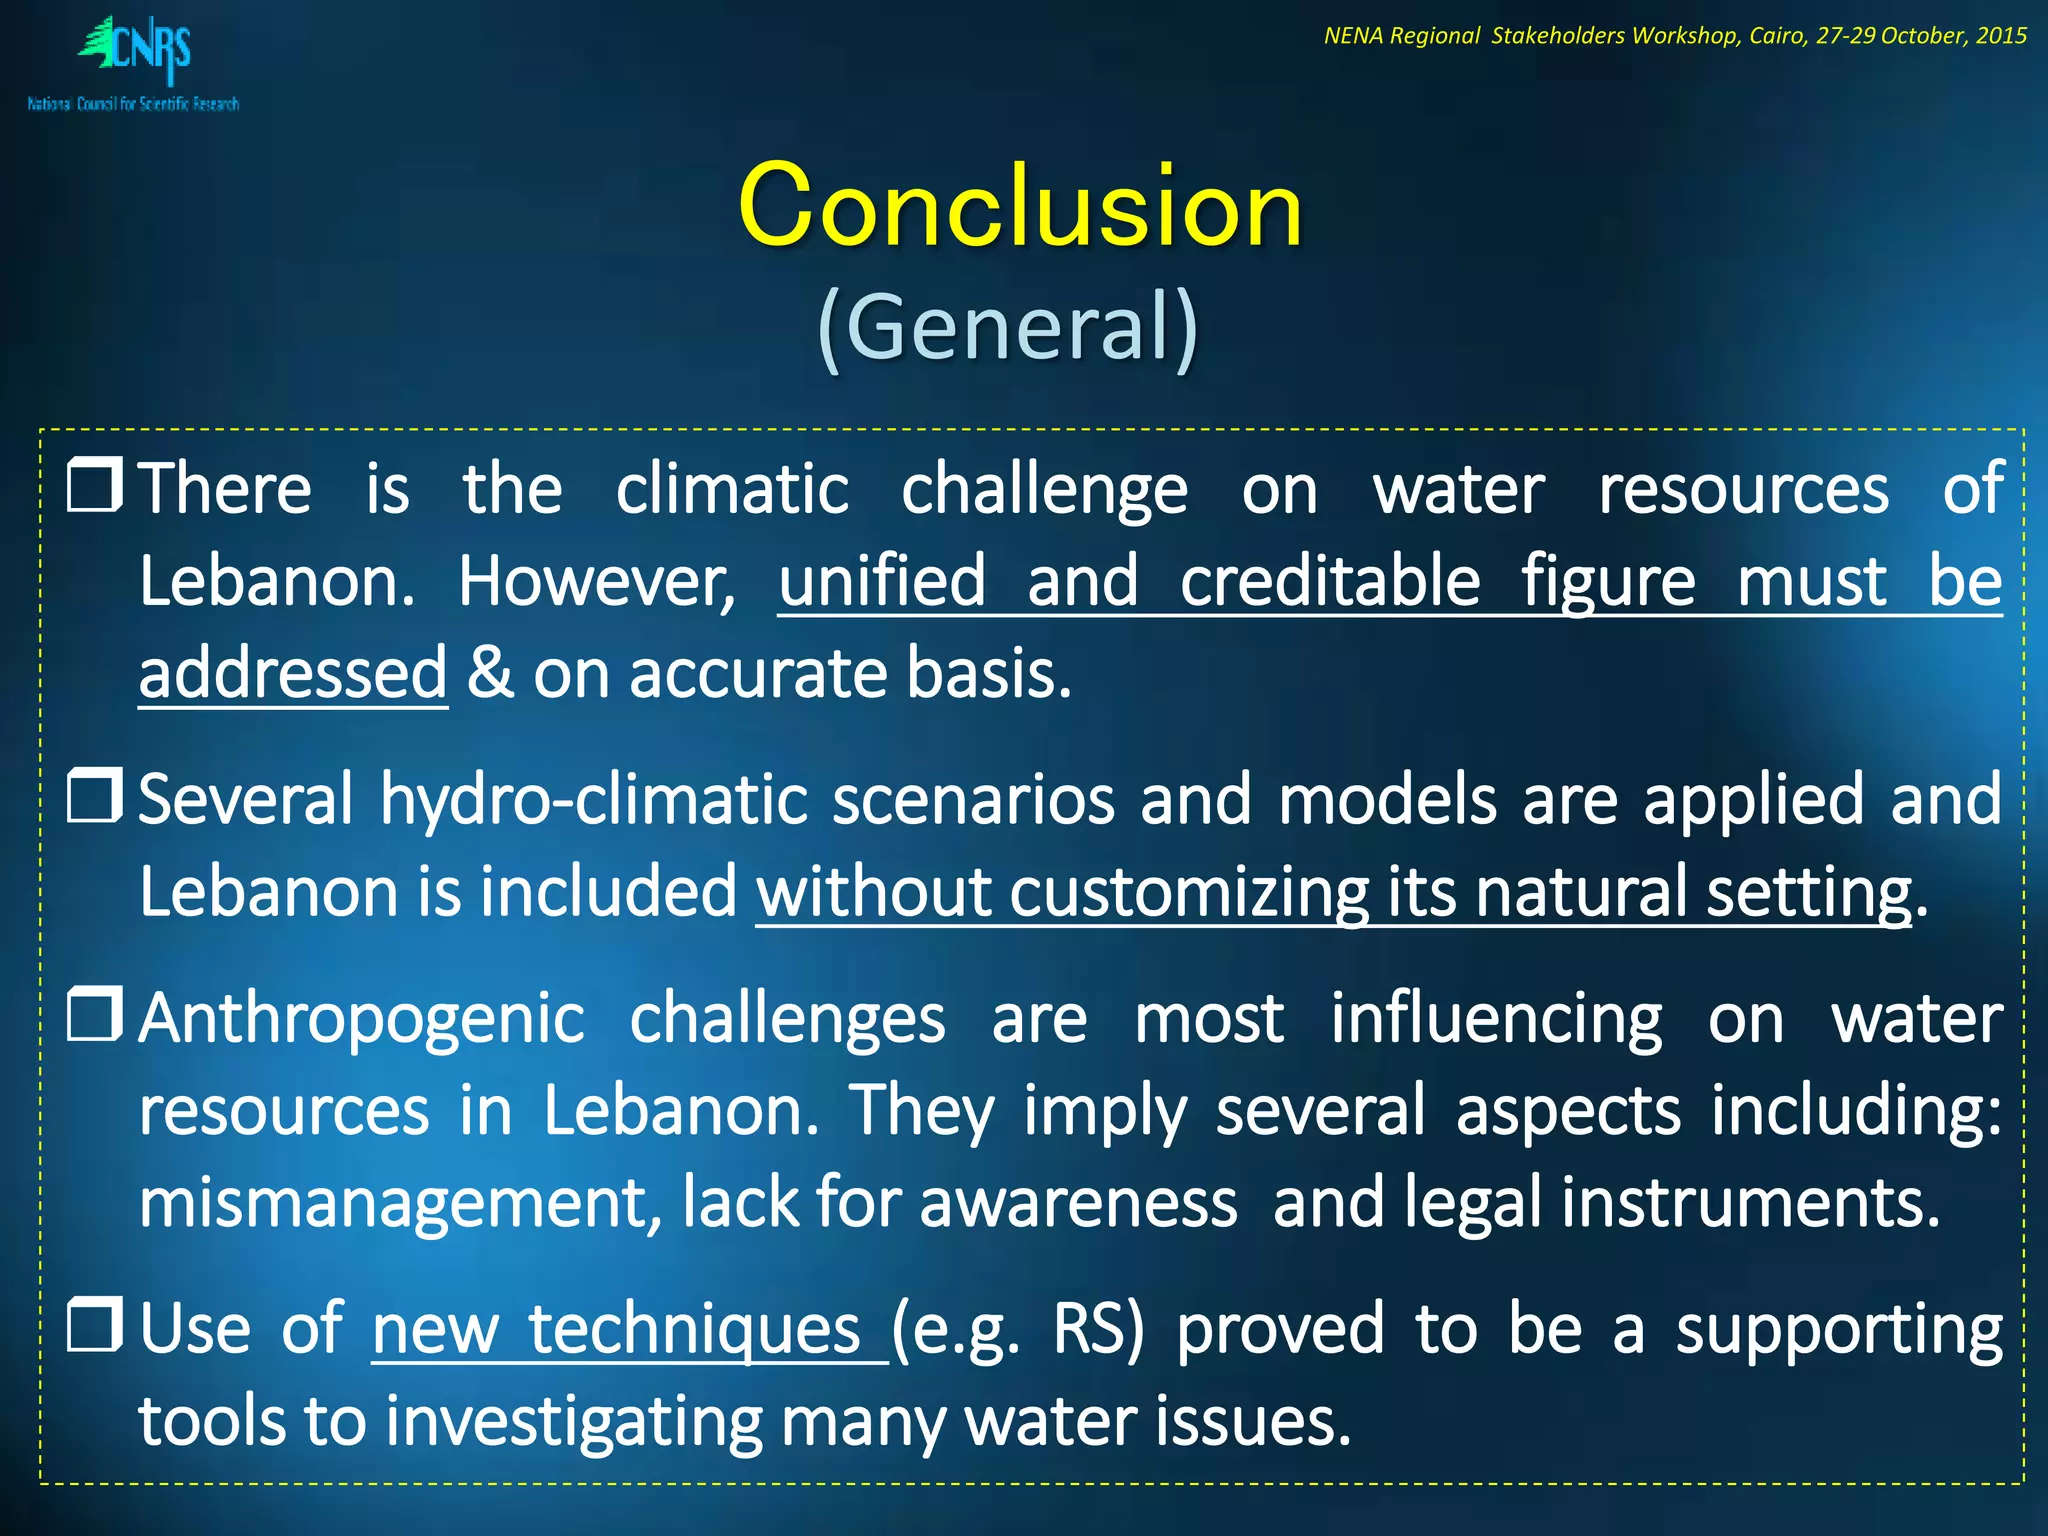

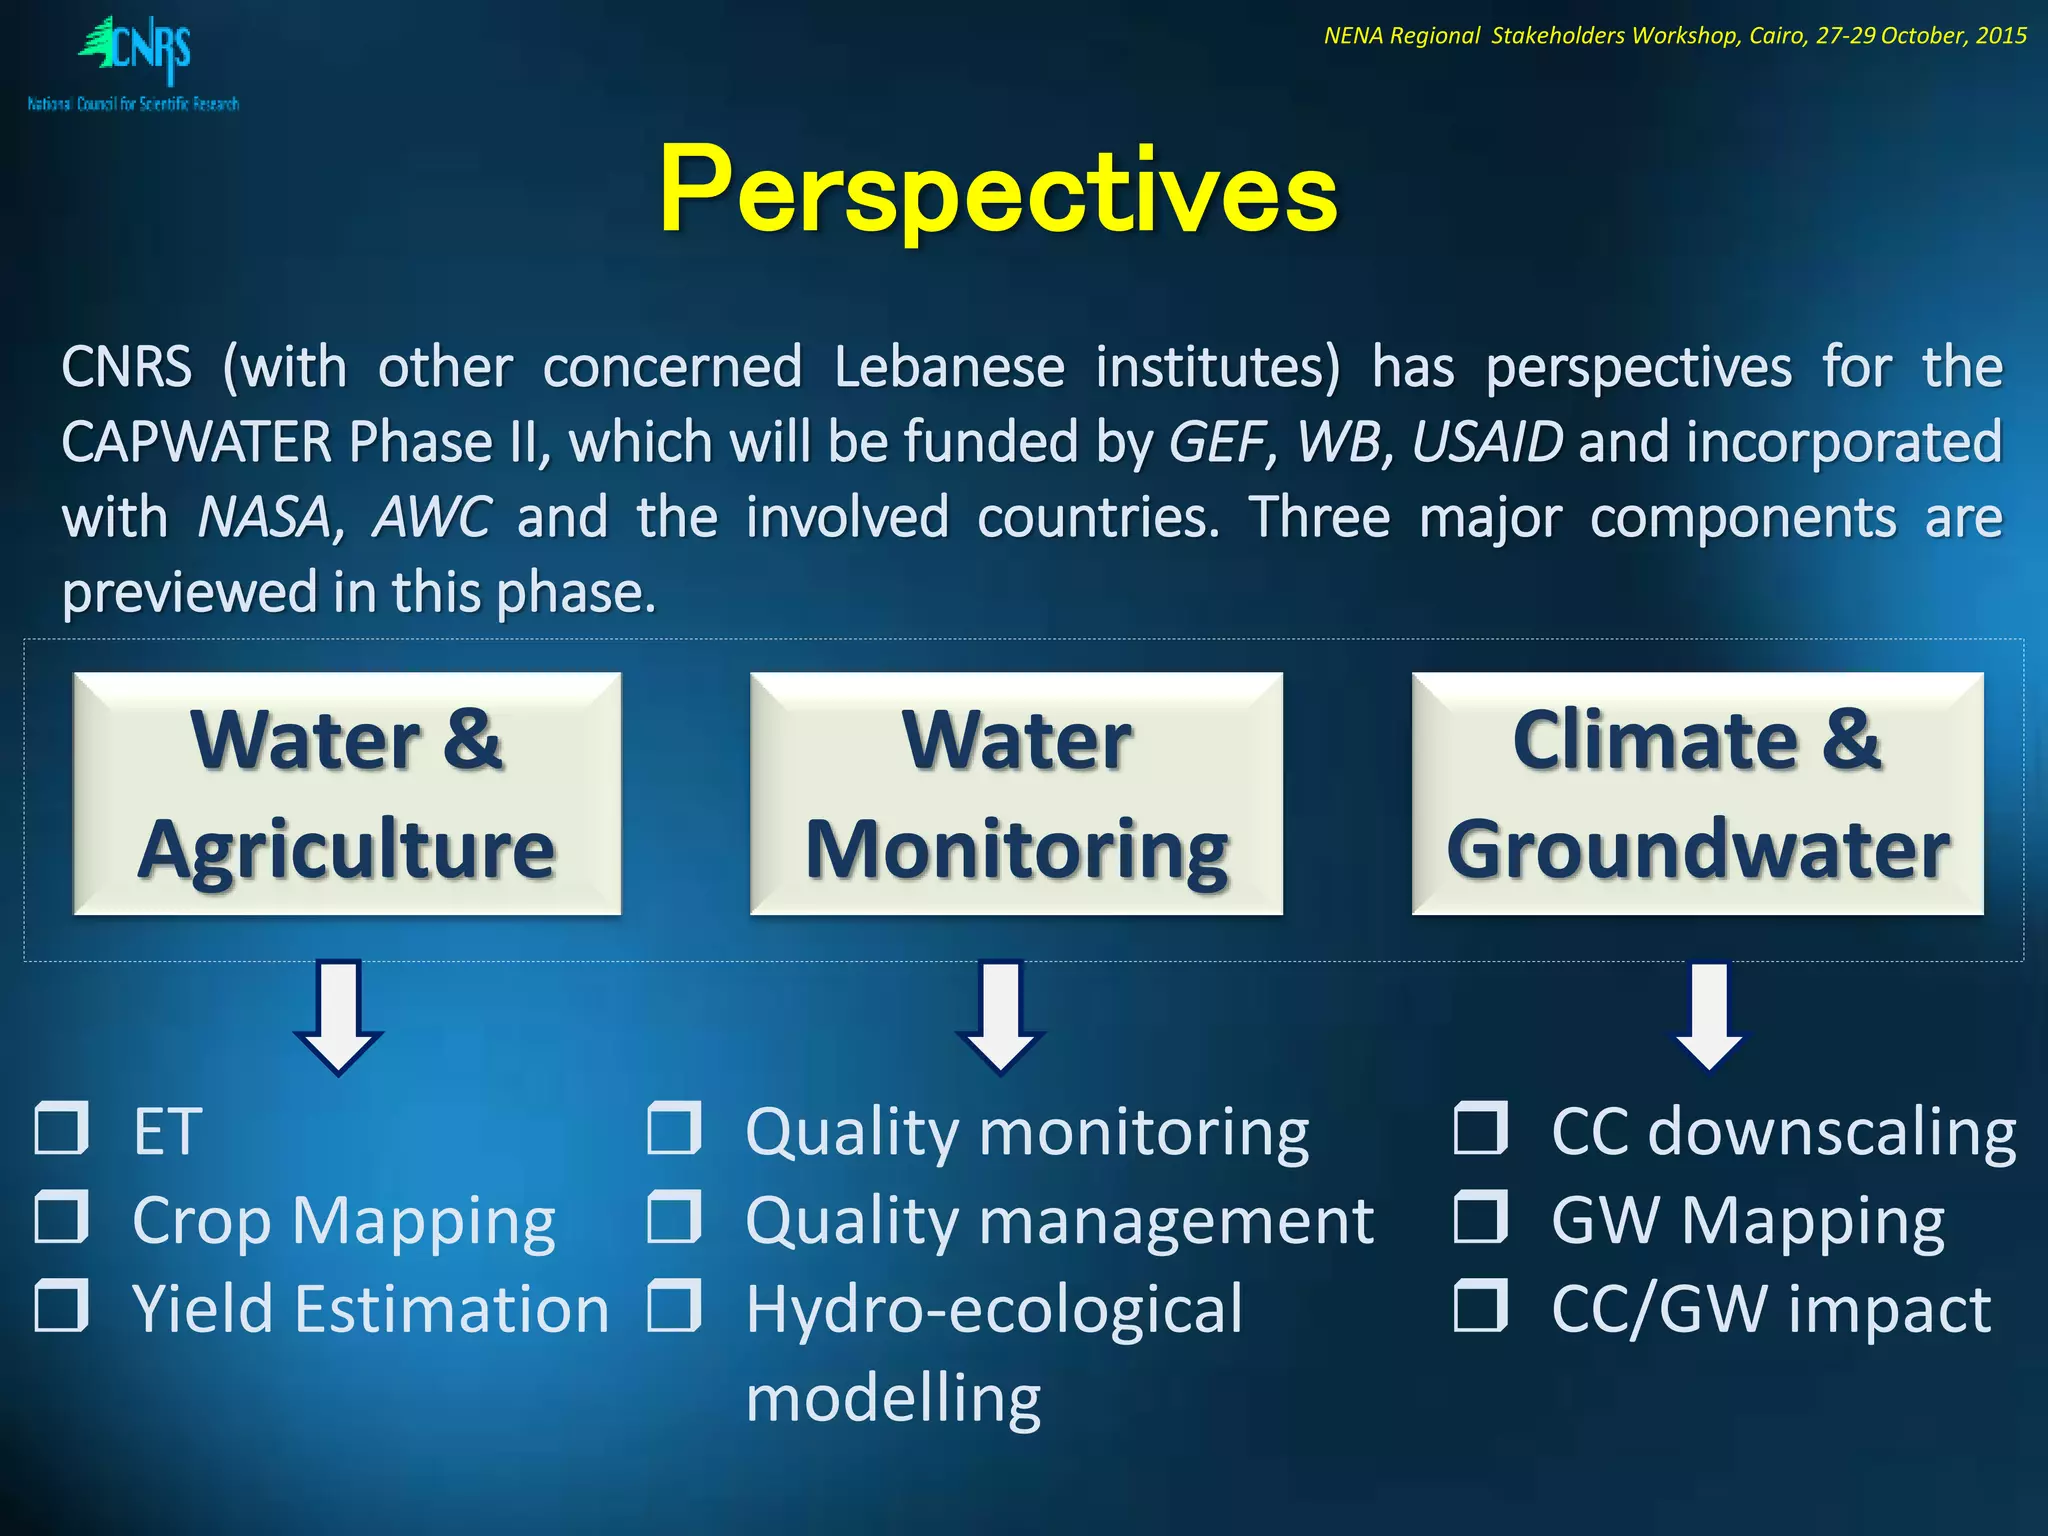


The document discusses the use of remote sensing to analyze water resources, consumption, and drought management in Lebanon, emphasizing the challenges posed by climatic variability and water allocation. It presents data on surface and groundwater resources, water consumption rates, and the impact of climate change on rainfall and temperature trends. It further explores methodologies for monitoring evapotranspiration, crop water productivity, and drought management through remote sensing technologies and identifies institutional capacities and ongoing projects aimed at addressing these challenges.


