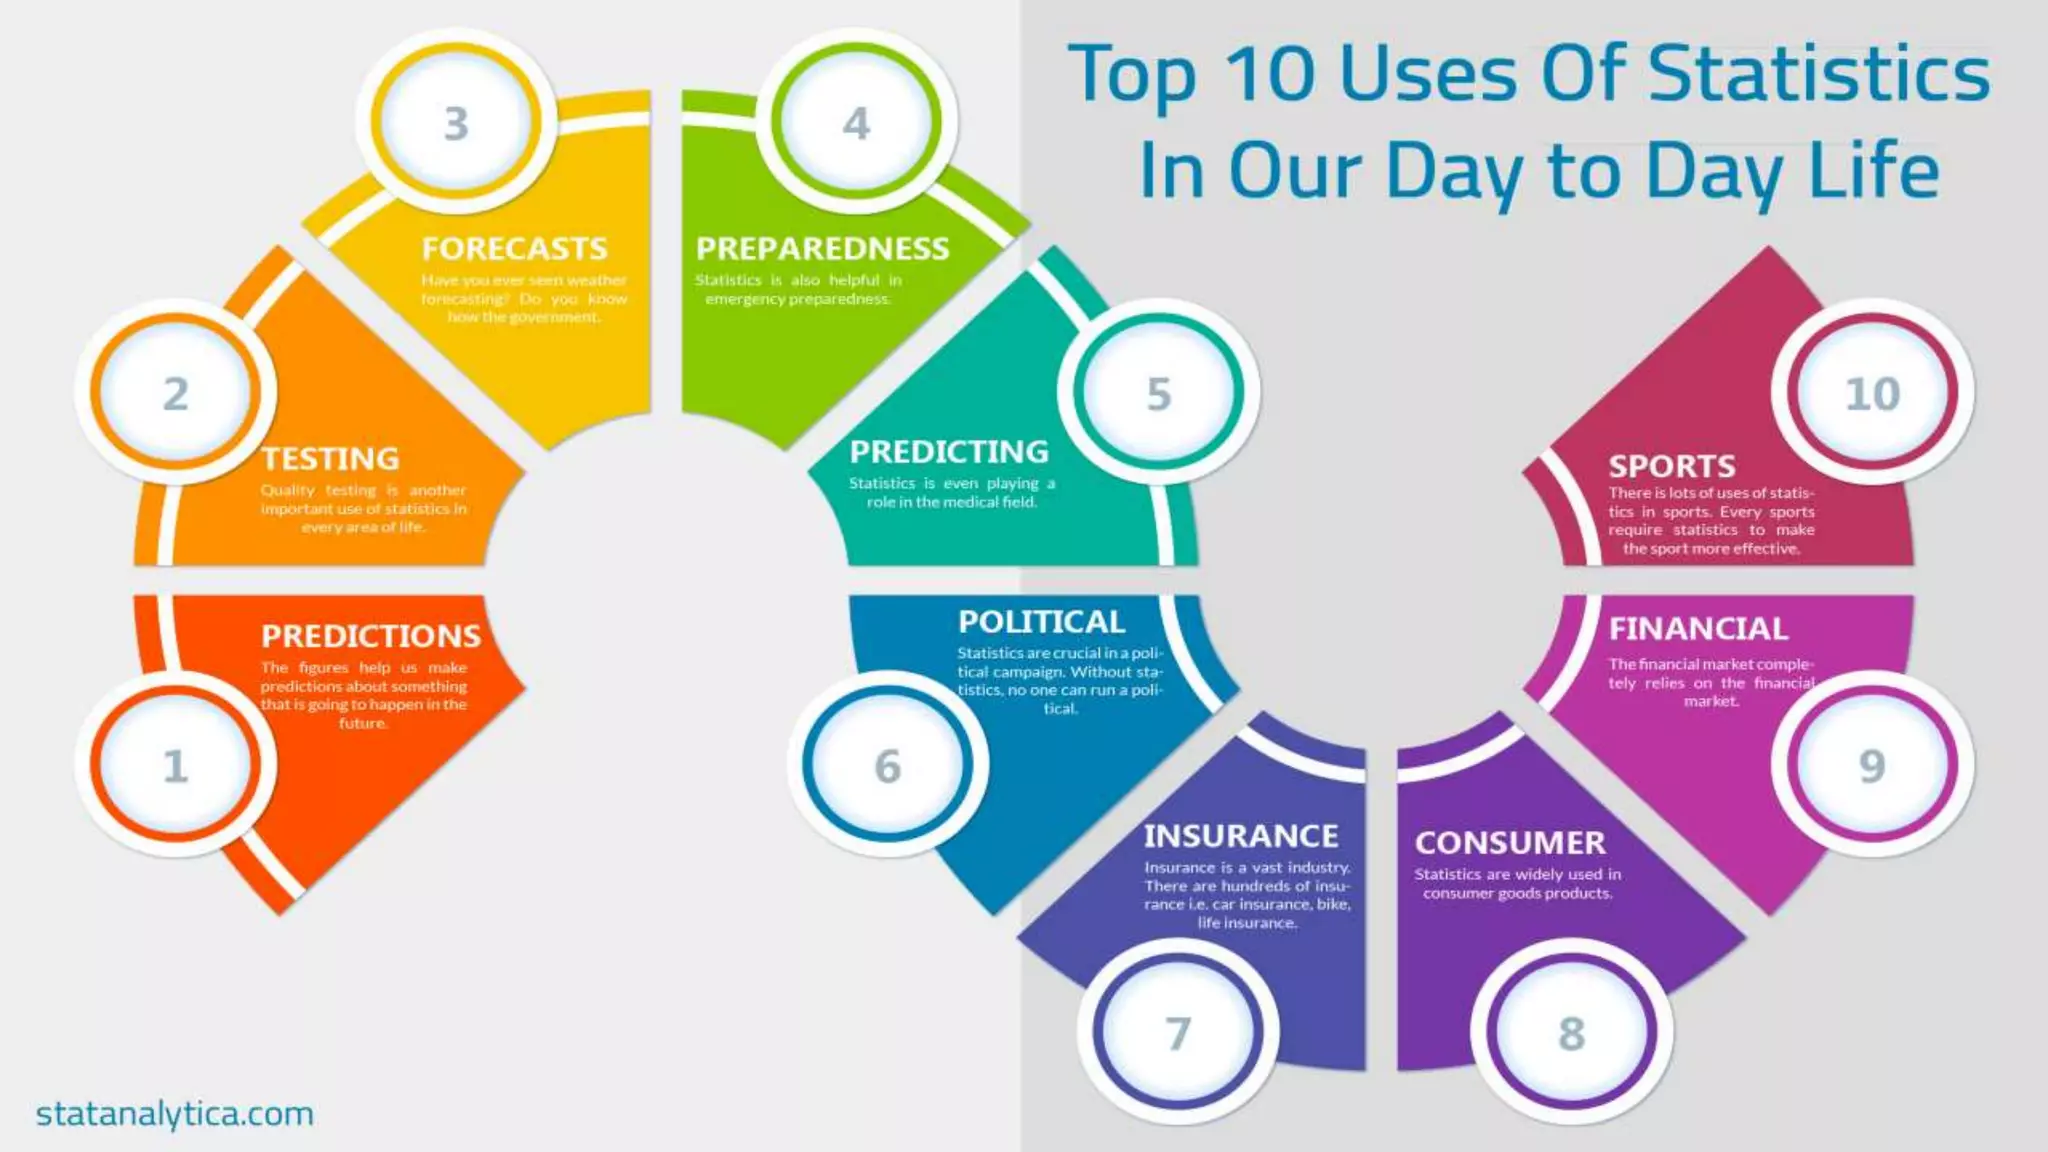
WHAT IS STATISTICS?
•“The word ‘statistics’ and ‘statistical’ are derived from the Latin word status, means political
state
•“ It is a mathematical science pertaining to the collection, analysis, interpretation or
explanation, and presentation of data. Also with prediction and forecasting based on data.
INDEX
•What is Statistics?
• Statistics in daily life
• Mean
• Mode
• Median
• Conclusion
Statistics in real life
• INDUSTRIES AND BUSINESS
Report of early sales & comparison others. It shows where the
factory or its sales lack and where they are good .
Statistics in real life
• AGRICULTURE
What amount of crops are grown this year in comparison to previous year or in
comparison to required amount of crop for the country Quality and size of grains grown
due to use of different fertilizer.
Statistics in real life
•EDUCATION
Money spend on girls education in comparison to boys education? Increase in no. of
girl students who seated in who Seated for different exams?
Statistics in real life
•ECOLOGICAL STUDIES
Comparison of increasing impact of pollution on global warming?
Increasing effect of nuclear reactors on environment?
Statistics in real life
• FORESTERY
How much growth has been occurred in area under forest or how much forest has been
depleted in last 5 years? How much different species of flora and fauna have increased or
decreased in last 5 years?
Statistics in real life
•MEDICAL STUDIES
No. of new diseases grown in last 10 year. Increase in no. of patients for a particular
disease. SPORTS Used to compare run rates of to different teams. Used to compare to
different Players result for last 10 years.
Statistics in real life
• Use of Graphs
Nowadays graphs are used almost everywhere. In Stock Market, graphs are used to
determine the profit margins of Stock.There is always a graph showing how prices
have changed over time , unemployment figures , inflation , exchange rates , NASA
space stories , global warming statistics , mortgage lending figures , house price
comparisons ,inflation , budget forecasts. taxation or pension forecasts , Food prices ,
and how they have changed over time etc.
MEAN
•The mean is used as one of the properties of statistics. It is defined as the average of
all the clarifications.
•The mean of a number of observations is the sum of the values of all the
observations divided by the total number of observations. It is denoted by the symbol
x , read as ‘x bar’.
MODE
•The mode is that value of the observation which occurs most frequently, i.e., an
observation with the maximum frequency is called the mode.
•The no. of games succeeded by any team of players.The frequency of the need of infants.
Used to find the number of the mode is also seen in calculation of the wages, in the patients
going to the hospitals, the mode of travel etc.
MEDIAN
•The median is that value of the given number of observations, which divides it into exactly
two parts.
• It is used to measure the distribution of the earnings Used to find the players height e.g.
football players.To find the middle age from the class students. Also used to find the poverty
line.
CONCLUSION
• Statistics and probability are important for making decisions in life.
• Statistics should be taught to all students in primary and secondary school.
• Statistics is not mathematics.The methods sometimes uses mathematics, but the basic
ideas do not require advanced math.
•We need to focus on concepts and importance of statistics.
Statistics in real life

Statistics in real life

  • 1.
    WHAT IS STATISTICS? •“Theword ‘statistics’ and ‘statistical’ are derived from the Latin word status, means political state •“ It is a mathematical science pertaining to the collection, analysis, interpretation or explanation, and presentation of data. Also with prediction and forecasting based on data.
  • 2.
    INDEX •What is Statistics? •Statistics in daily life • Mean • Mode • Median • Conclusion
  • 4.
    Statistics in reallife • INDUSTRIES AND BUSINESS Report of early sales & comparison others. It shows where the factory or its sales lack and where they are good .
  • 5.
    Statistics in reallife • AGRICULTURE What amount of crops are grown this year in comparison to previous year or in comparison to required amount of crop for the country Quality and size of grains grown due to use of different fertilizer.
  • 6.
    Statistics in reallife •EDUCATION Money spend on girls education in comparison to boys education? Increase in no. of girl students who seated in who Seated for different exams?
  • 7.
    Statistics in reallife •ECOLOGICAL STUDIES Comparison of increasing impact of pollution on global warming? Increasing effect of nuclear reactors on environment?
  • 8.
    Statistics in reallife • FORESTERY How much growth has been occurred in area under forest or how much forest has been depleted in last 5 years? How much different species of flora and fauna have increased or decreased in last 5 years?
  • 9.
    Statistics in reallife •MEDICAL STUDIES No. of new diseases grown in last 10 year. Increase in no. of patients for a particular disease. SPORTS Used to compare run rates of to different teams. Used to compare to different Players result for last 10 years.
  • 10.
    Statistics in reallife • Use of Graphs Nowadays graphs are used almost everywhere. In Stock Market, graphs are used to determine the profit margins of Stock.There is always a graph showing how prices have changed over time , unemployment figures , inflation , exchange rates , NASA space stories , global warming statistics , mortgage lending figures , house price comparisons ,inflation , budget forecasts. taxation or pension forecasts , Food prices , and how they have changed over time etc.
  • 11.
    MEAN •The mean isused as one of the properties of statistics. It is defined as the average of all the clarifications. •The mean of a number of observations is the sum of the values of all the observations divided by the total number of observations. It is denoted by the symbol x , read as ‘x bar’.
  • 12.
    MODE •The mode isthat value of the observation which occurs most frequently, i.e., an observation with the maximum frequency is called the mode. •The no. of games succeeded by any team of players.The frequency of the need of infants. Used to find the number of the mode is also seen in calculation of the wages, in the patients going to the hospitals, the mode of travel etc.
  • 13.
    MEDIAN •The median isthat value of the given number of observations, which divides it into exactly two parts. • It is used to measure the distribution of the earnings Used to find the players height e.g. football players.To find the middle age from the class students. Also used to find the poverty line.
  • 14.
    CONCLUSION • Statistics andprobability are important for making decisions in life. • Statistics should be taught to all students in primary and secondary school. • Statistics is not mathematics.The methods sometimes uses mathematics, but the basic ideas do not require advanced math. •We need to focus on concepts and importance of statistics.